Upgrade to Pro — share decks privately, control downloads, hide ads and more …

HolyJS Moscow 2016: Debugging Node.js in Production

HolyJS Moscow 2016: Debugging Node.js in Production

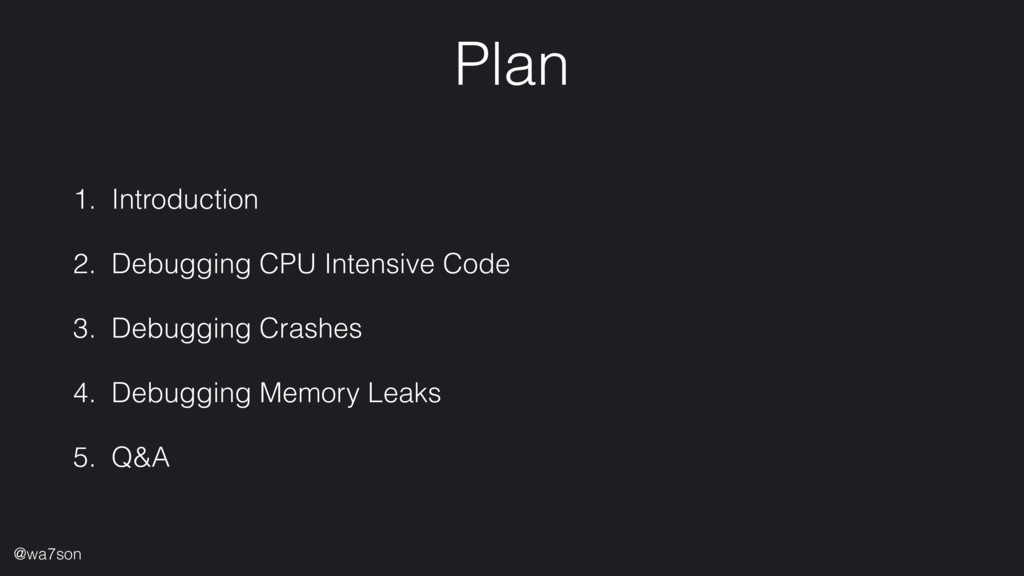
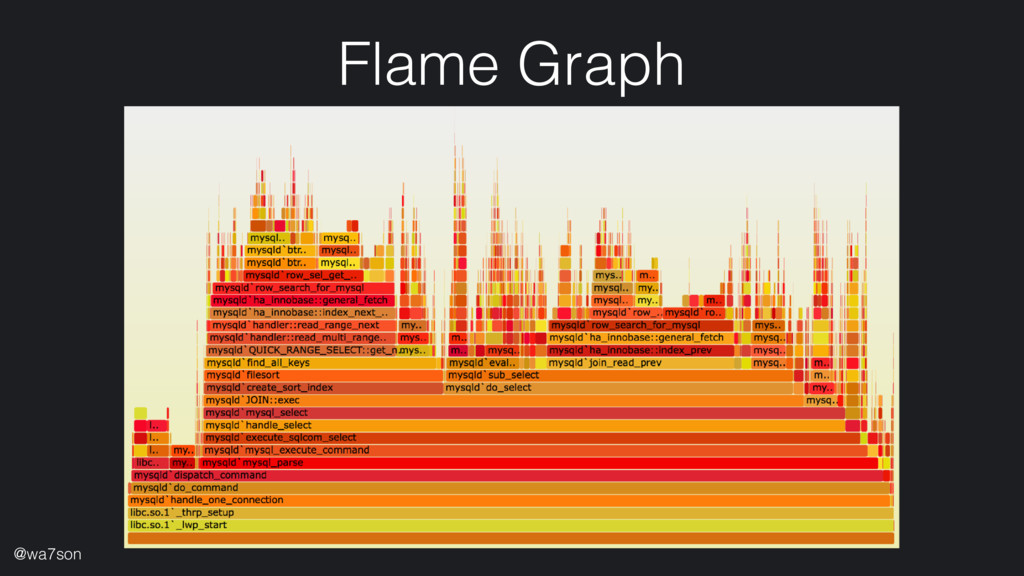
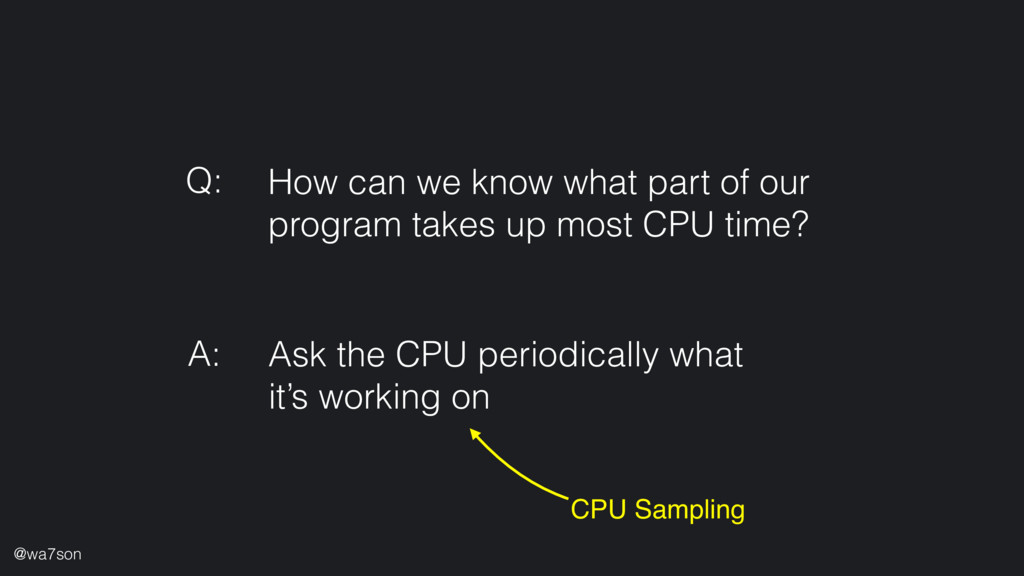
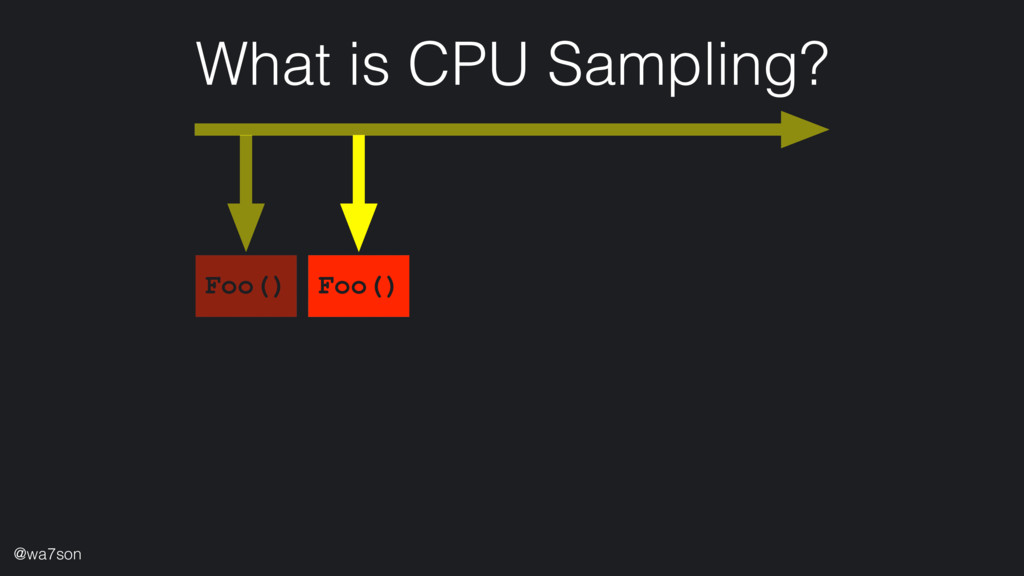
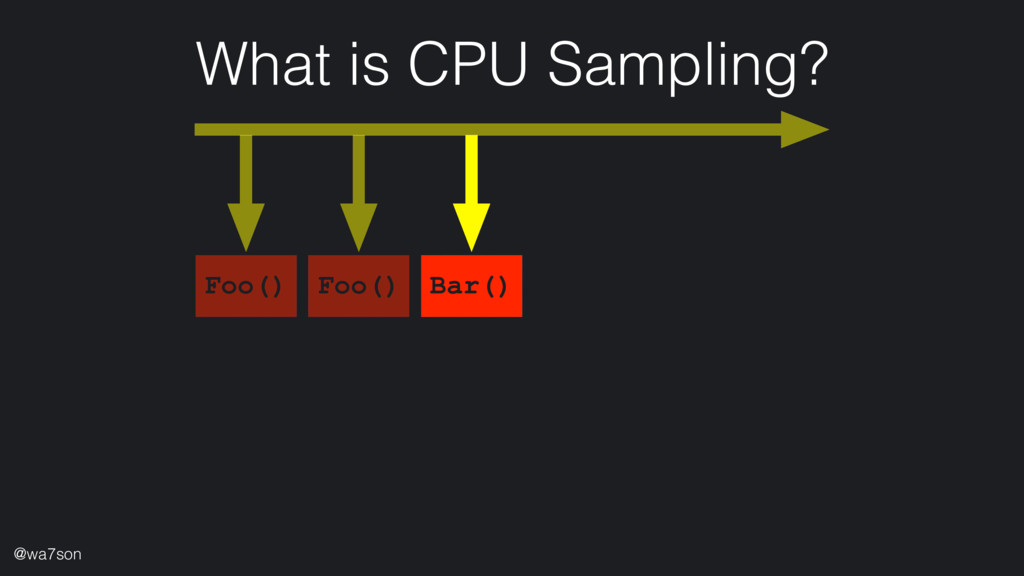
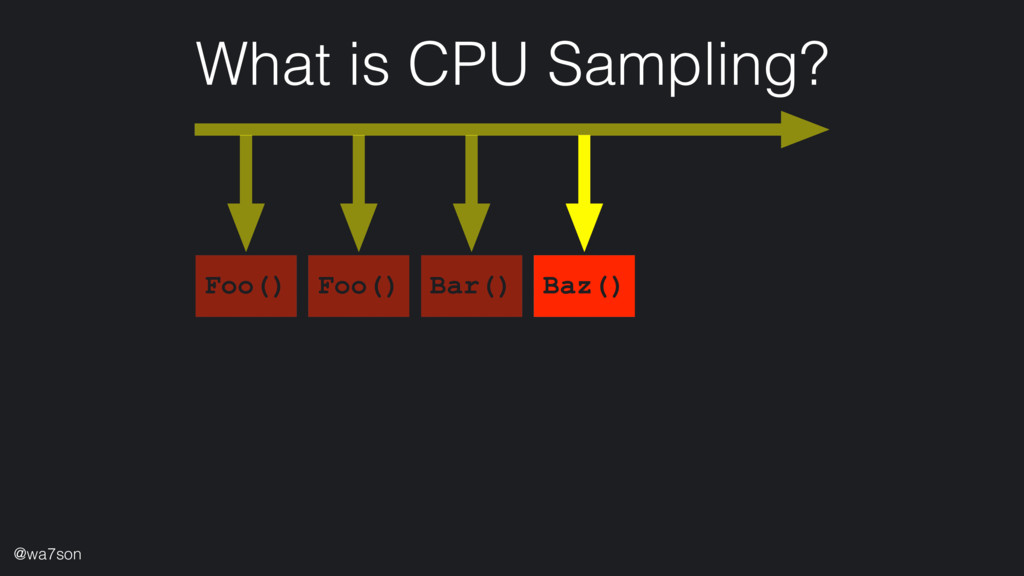
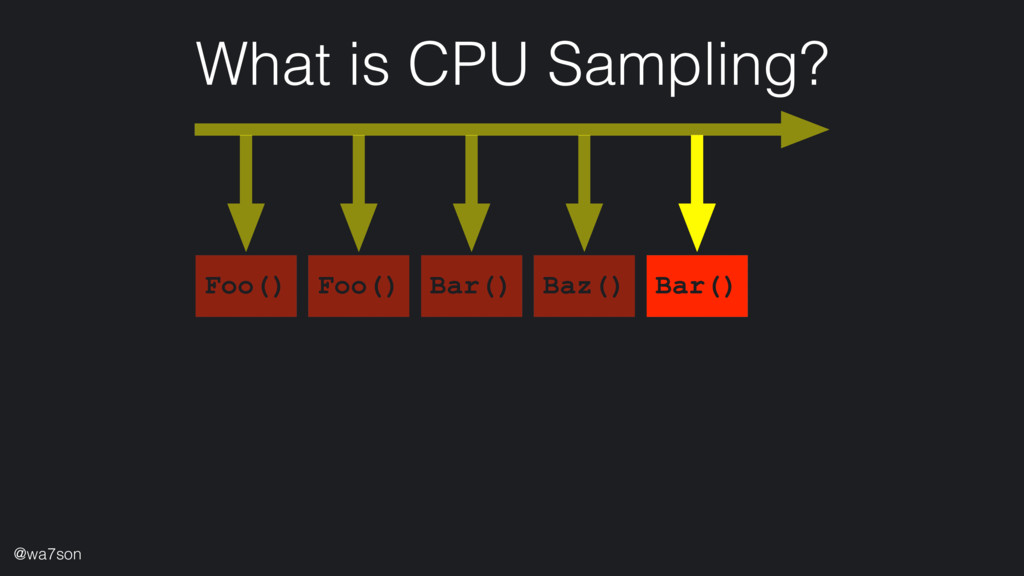
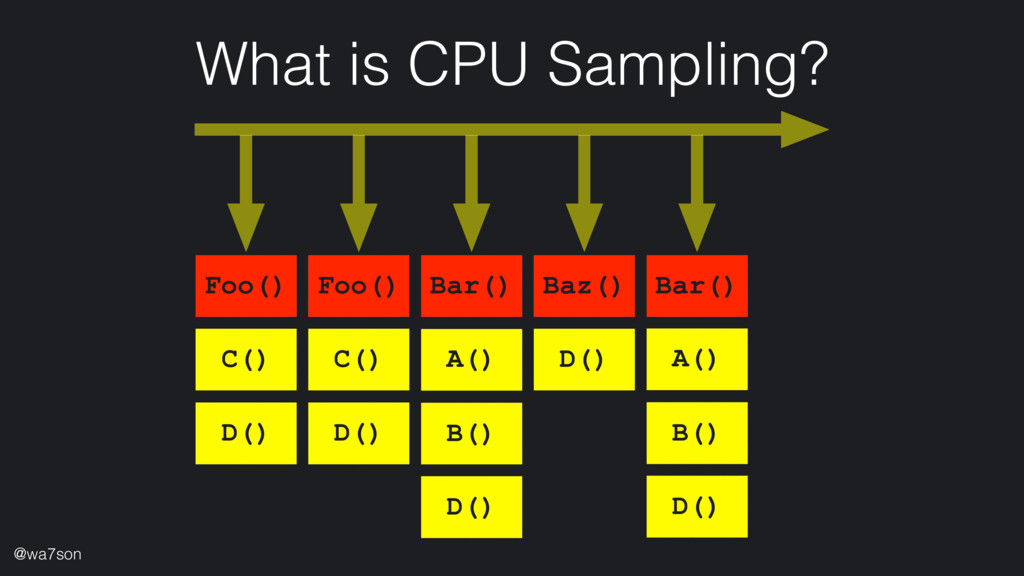
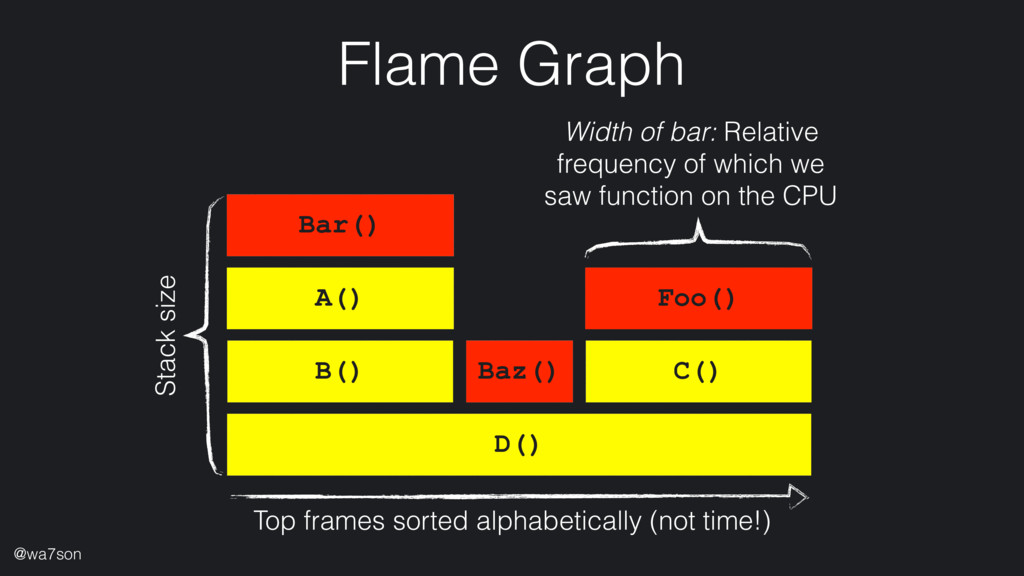
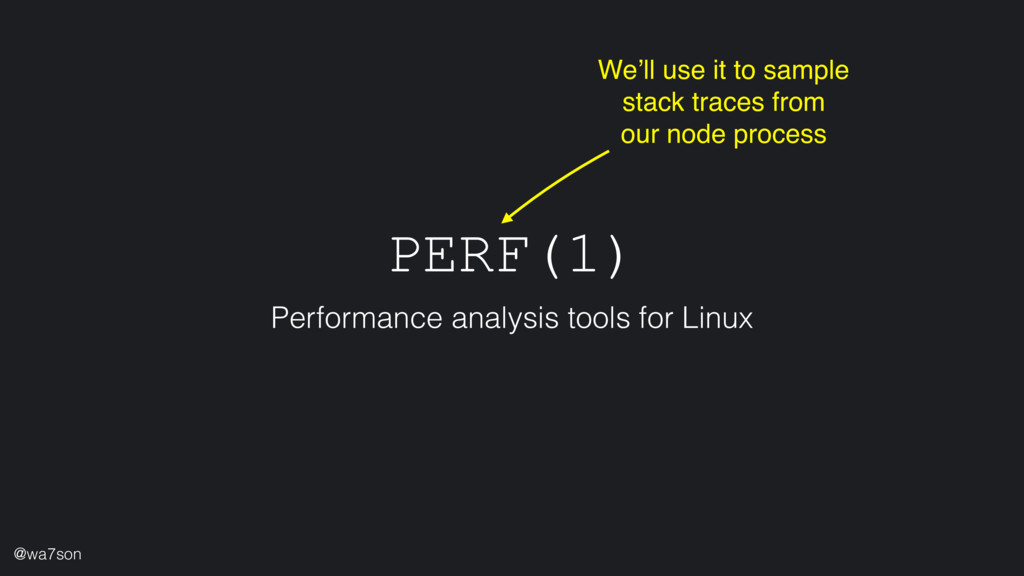
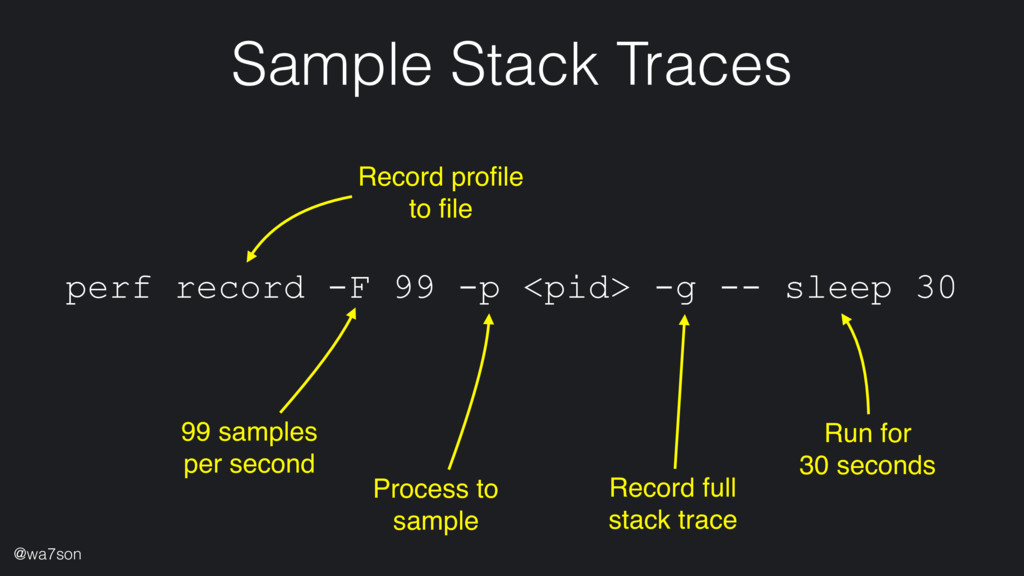
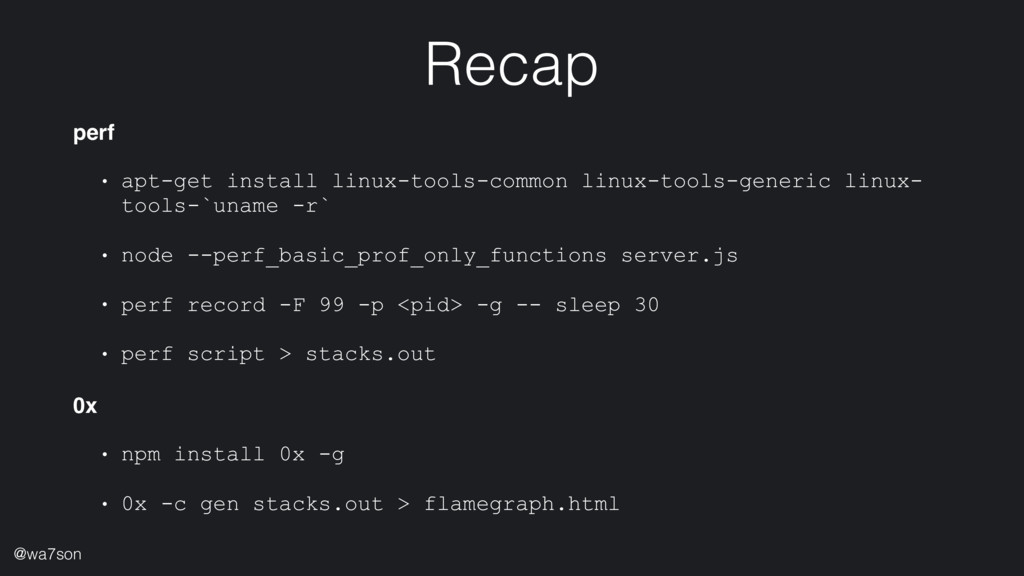
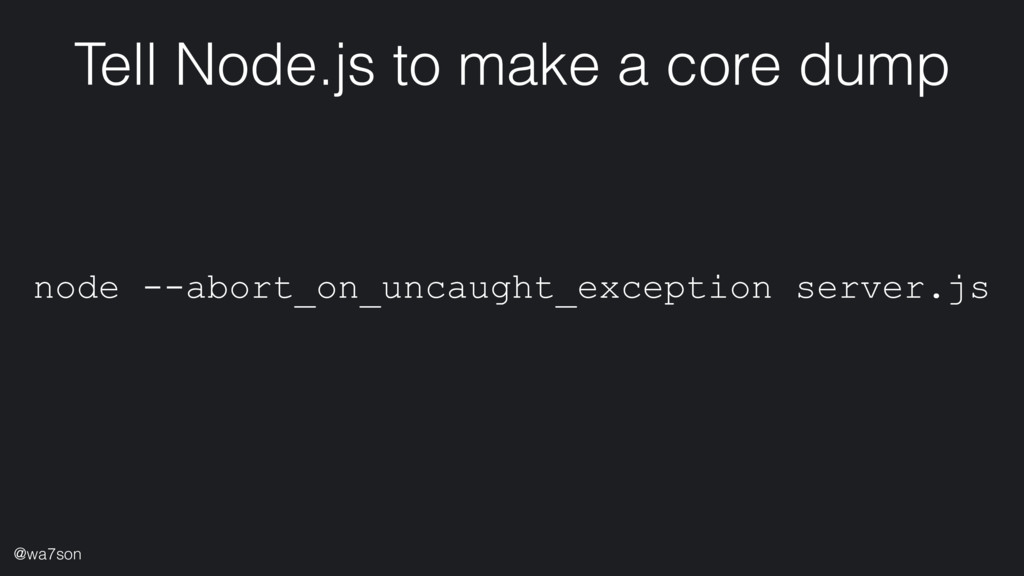
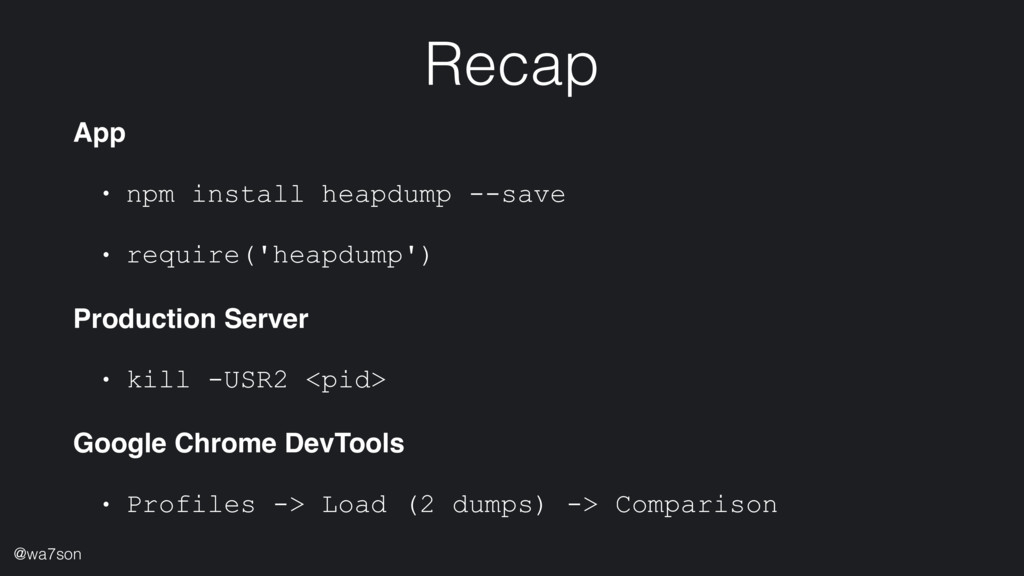
Node.js doesn’t require much to get started. But as with any other platform, you will run into issues like scalability, memory leaks, or slow requests. This talk covers the top Node.js performance issues, and will guide you through how to solve them.

Thomas Watson

December 11, 2016
Tweet

More Decks by Thomas Watson

Other Decks in Programming

Transcript

  1. Plan 1. Introduction 2. Debugging CPU Intensive Code 3. Debugging

    Crashes 4. Debugging Memory Leaks 5. Q&A @wa7son
  2. Who is this guy anyway? • Thomas Watson • Open

    Source developer at github.com/watson • Node.js Lead at Opbeat • Member of the Diagnostics Working Group under the Node.js Foundation • Tweets as @wa7son @wa7son
  3. Prior Work • Brendan Gregg, Netflix • Previously: Sun Microsystems

    + Joyent • LISA Outstanding Achievement Award "For contributions to the field of system administration, particularly groundbreaking work in systems performance analysis methodologies." https://en.wikipedia.org/wiki/Brendan_Gregg Yes, that Joyent! @wa7son
  4. Causes of Slowness • (Single-threaded) • CPU intensive code •

    Slow I/O • Event Loop saturation • Running out of memory • Garbage Collection @wa7son
  5. CPU Intensive Code • Synchronous I/O • JSON.parse • Regular

    Expressions • Crypto • Templates • … @wa7son
  6. Q: How can we know what part of our program

    takes up most CPU time? A: Ask the CPU periodically what it’s working on CPU Sampling @wa7son
  7. What is CPU Sampling? Bar() Baz() Bar() D() A() B()

    D() A() B() D() Foo() Foo() C() D() C() D() @wa7son
  8. Flame Graph D() B() A() Bar() Baz() Foo() C() Width

    of bar: Relative frequency of which we saw function on the CPU Stack size Top frames sorted alphabetically (not time!) @wa7son
  9. PERF(1) Performance analysis tools for Linux We’ll use it to

    sample stack traces from our node process @wa7son
  10. Sample Stack Traces Record profile to file 99 samples per

    second Process to sample Record full stack trace Run for 30 seconds perf record -F 99 -p <pid> -g -- sleep 30 @wa7son
  11. Sample Stack Trace 751dcc v8::internal::Compiler::Compile (/usr/local/bin/node) a84a96 v8::internal::Runtime_CompileLazy (/usr/local/bin/node) 223055f092a7

    [unknown] (/tmp/perf-27806.map) 223055f34338 [unknown] (/tmp/perf-27806.map) 22305609a84f [unknown] (/tmp/perf-27806.map) 223056021453 [unknown] (/tmp/perf-27806.map) 223056020ebb [unknown] (/tmp/perf-27806.map) 223055f09895 [unknown] (/tmp/perf-27806.map) 223056098b9f [unknown] (/tmp/perf-27806.map) 22305609669f [unknown] (/tmp/perf-27806.map) 223055f3b7c3 [unknown] (/tmp/perf-27806.map) 223055f2508f [unknown] (/tmp/perf-27806.map) 84f994 v8::internal::Execution::Call (/usr/local/bin/node) 570a99 v8::Function::Call (/usr/local/bin/node) 57ec51 v8::Function::Call (/usr/local/bin/node) c86a79 node::AsyncWrap::MakeCallback (/usr/local/bin/node) cc9fd7 node::Parser::on_headers_complete (/usr/local/bin/node) f0444b http_parser_execute (/usr/local/bin/node) command: perf script @wa7son JavaScript frames
  12. Sample Stack Trace with JavaScript frames 5e6f22 v8::internal::(anonymous namespace)::HandleApiCallHelper<false> (/usr/local/bin/node)

    5e759e v8::internal::Builtin_HandleApiCall (/usr/local/bin/node) 17712b1092a7 [unknown] (/tmp/perf-27742.map) 17712b29c49d LazyCompile:~pbkdf2 crypto.js:571 (/tmp/perf-27742.map) 17712b109895 [unknown] (/tmp/perf-27742.map) 17712b29c02f LazyCompile:~exports.pbkdf2Sync crypto.js:562 (/tmp/perf-27742.map) 17712b2ac721 LazyCompile:~foo /home/watson/1-cpu/cpu.js:13 (/tmp/perf-27742.map) 17712b29b4a3 LazyCompile:~ /home/watson/1-cpu/cpu.js:4 (/tmp/perf-27742.map) 17712b2221b3 LazyCompile:~emitTwo events.js:104 (/tmp/perf-27742.map) 17712b221cdb LazyCompile:~emit events.js:136 (/tmp/perf-27742.map) 17712b109895 [unknown] (/tmp/perf-27742.map) 17712b29979f LazyCompile:~parserOnIncoming _http_server.js:463 (/tmp/perf-27742.map) 17712b29729f LazyCompile:~parserOnHeadersComplete _http_common.js:45 (/tmp/perf-27742.map) 17712b13b7c3 [unknown] (/tmp/perf-27742.map) 17712b12508f [unknown] (/tmp/perf-27742.map) 84f994 v8::internal::Execution::Call (/usr/local/bin/node) 570a99 v8::Function::Call (/usr/local/bin/node) 57ec51 v8::Function::Call (/usr/local/bin/node) c86a79 node::AsyncWrap::MakeCallback (/usr/local/bin/node) cc9fd7 node::Parser::on_headers_complete (/usr/local/bin/node) f0444b http_parser_execute (/usr/local/bin/node) @wa7son command: perf script
  13. # $ $ $ $ $ $ $ $ $

    $ $ $ $ $ $ $ $ $ $ $ $ $ $ $ @wa7son
  14. Recap perf • apt-get install linux-tools-common linux-tools-generic linux- tools-`uname -r`

    • node --perf_basic_prof_only_functions server.js • perf record -F 99 -p <pid> -g -- sleep 30 • perf script > stacks.out 0x • npm install 0x -g • 0x -c gen stacks.out > flamegraph.html @wa7son
  15. ~/core.<pid> @wa7son 48 54 54 50 2f 31 2e 31

    20 32 30 30 20 4f 4b 0d 0a 44 61 74 65 3a 20 32 30 31 36 2d 31 32 2d 31 31 0d 0a 0d 0a 43 6f 6e 67 72 61 74 75 6c 61 74 69 6f 6e 73 21 20 59 6f 75 20 73 68 6f 75 6c 64 20 61 70 70 6c 79 20 66 6f 72 20 6a 6f 62 20 61 74 20 4f 70 62 65 61 74 20 3a 29 0d 0a 57 65 27 72 65 20 61 6c 77 61 79 73 20 6c 6f 6f 6b 69 6e 67 20 66 6f 72 20 74 61 6c 65 6e 74 65 64 20 64 65 76 65 6c 6f 70 65 72 73 2e 0d 0a 45 6d 61 69 6c 20 72 6f 6e 40 6f 70 62 65 61 74 2e 63 6f 6d
  16. mdb Modular Debugger - An extensible, low-level debugger developed by

    Sun Microsystems for the Solaris 7 operation system @wa7son
  17. Using mdb • Solaris variant • mdb (runs only on

    Solaris and friends) • mdb v8 - https://github.com/joyent/mdb_v8 • core file • node binary @wa7son
  18. Using mdb @wa7son Production Server Solaris Box core file Install

    mdb Install mdb v8 plugin node binary Run mdb
  19. @wa7son Oracle VirtualBox SmartOS SSH ALL THE THINGS!!! mdb v8

    VirtualBox is a Prerequisite SmartOS + mdb are installed by Autopsy
  20. Recap 1/2 Production Server • ulimit -c unlimited • node

    --abort-on-uncaught-exception server.js @wa7son
  21. Recap 2/2 Solaris • mdb node core mdb • ::load

    v8 Load v8 features • ::jsstack -vn0 Show js stack with details • <addr>::jsprint Output content of a memory address @wa7son
  22. See also github.com / tjfontaine / lldb-v8 github.com / nodejs

    / llnode github.com / nodejs / post-mortem @wa7son
  23. Recap @wa7son App • npm install heapdump --save • require('heapdump')

    Production Server • kill -USR2 <pid> Google Chrome DevTools • Profiles -> Load (2 dumps) -> Comparison
  24. Finding Leaks with gcore & mdb @wa7son Production Server •

    gcore <pid> Solaris • mdb node core mdb • ::findjsobjects Scan entire heap, group + log objects by type • ::findjsobjects ! sort -k2 Sort by count column • <addr>::findjsobjects -r Find parent objects referring to <addr> object