Upgrade to Pro — share decks privately, control downloads, hide ads and more …

Where are the comments?!!

Rhys Evans
December 07, 2016

Where are the comments?!!

Data and performance trade-offs on ft.com

Rhys Evans

December 07, 2016
Tweet

More Decks by Rhys Evans

Other Decks in Technology

Transcript

  1. Where are the comments?!!
    Data and performance trade-offs on ft.com
    Rhys Evans @wheresrhys

    View Slide

  2. Probably the fastest pink news website in the world

    View Slide

  3. Why is ft.com so fast?
    ● Early on we artificially slowed the site down for some users, and
    demonstrated that poor perf would cost money
    ● This helped get agreement from stakeholders, all the way up to the
    board that speed is important.
    ● So able to avoid pitfalls such as
    ○ Tag managers and other 3rd party nonsense
    ○ “My thing absolutely must go on the front page”
    ○ “The design uses this font-weight, and you will respect the design’s authority!”
    ● There is no secret recipe - we’re just empowered to apply best
    practice and to say no when it matters

    View Slide

  4. Lazy-loading, one of our favourite tricks
    Deferring the loading of less important features
    ● Initial page load only includes the most important things - content,
    navigation, minimal amount of styles
    ● Use IntersectionObserver (thank you polyfill.io) to load images,
    comments, ads etc. as the user scrolls down the page later
    Bandwidth is not taken up by less important downloads, so the main
    content loads super fast
    ...so everyone’s happy?

    View Slide

  5. “Where are the
    comments?!!”
    - about 8 users a week

    View Slide

  6. ● Why are comments so slow?
    ● Because we lazy 
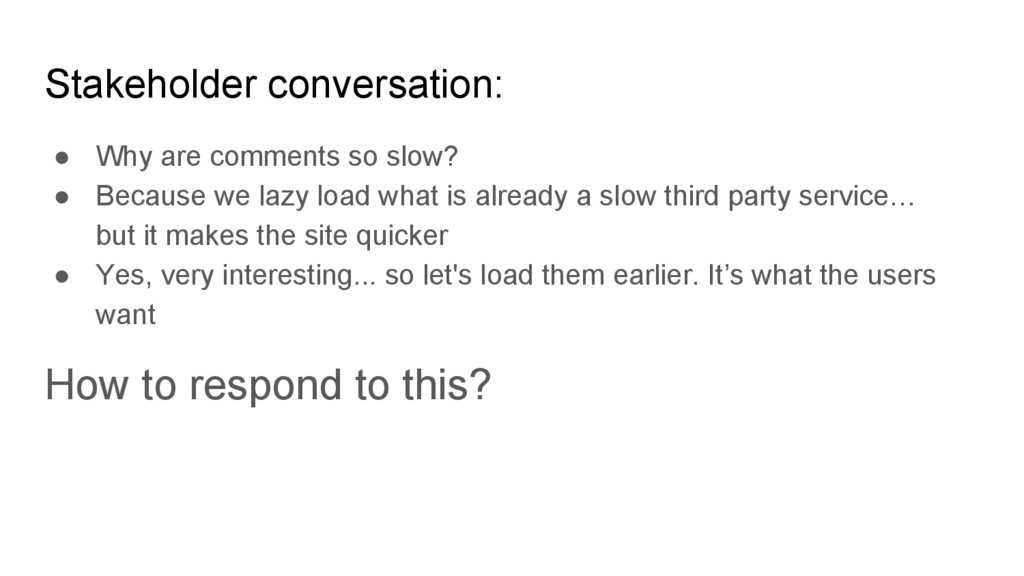
load what is already a slow third party service…
    but it makes the site quicker
    ● Yes, very interesting... so let's load them earlier. It’s what the users
    want
    How to respond to this?
    Stakeholder conversation:

    View Slide

  7. DATA

    View Slide

  8. Able to easily collect data on how many users scroll as far as the comments
    … it’s really not very many
    We have a great in-house data collection tool - spoor

    View Slide

  9. But sometimes data is not your friend
    I’ve mislaid the graph...
    ...the data told us
    but this is roughly how long...
    … it often took to load comments.
    ...sorry… what were we talking about again?

    View Slide

  10. ● But breaking perf rules is a slippery slope
    ● Making one thing faster will probably slow something else
    down
    Whatever you do, hold the line!
    So we had to do something

    View Slide

  11. Different users care about different features
    Build a strong, performant 
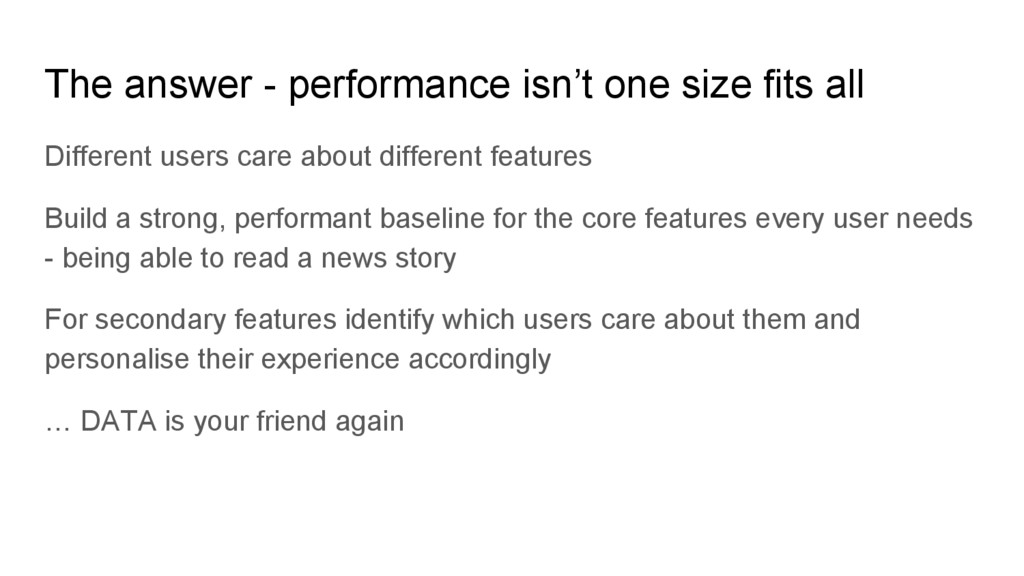
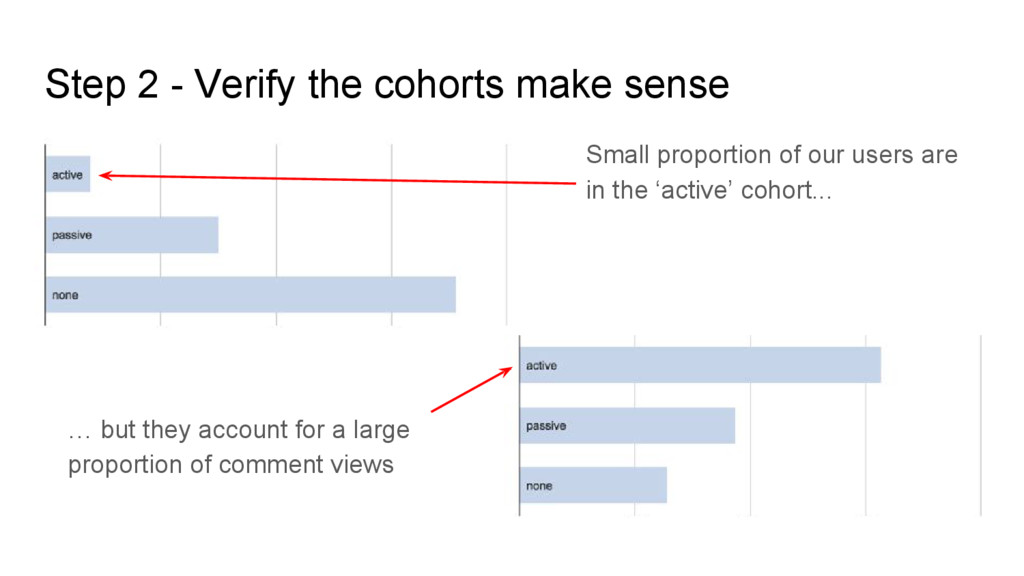
baseline for the core features every user needs
    - being able to read a news story
    For secondary features identify which users care about them and
    personalise their experience accordingly
    … DATA is your friend again
    The answer - performance isn’t one size fits all

    View Slide

  12. Step 1- partition users into groups
    - active comment user
    interacted with comments in
    the last month
    - passive comment user
    seen comments in the last
    month
    - everyone else
    fingers in their ears
    Data to identify the user’s cohort
    is stored in localstorage and used
    to decorate analytics
    Users in each cohort

    View Slide

  13. Step 2 - Verify the cohorts make sense
    Small proportion of our users are
    in the ‘active’ cohort...
    … but they account for a large
    proportion of comment views

    View Slide

  14. For active users, we started loading comments as soon as 
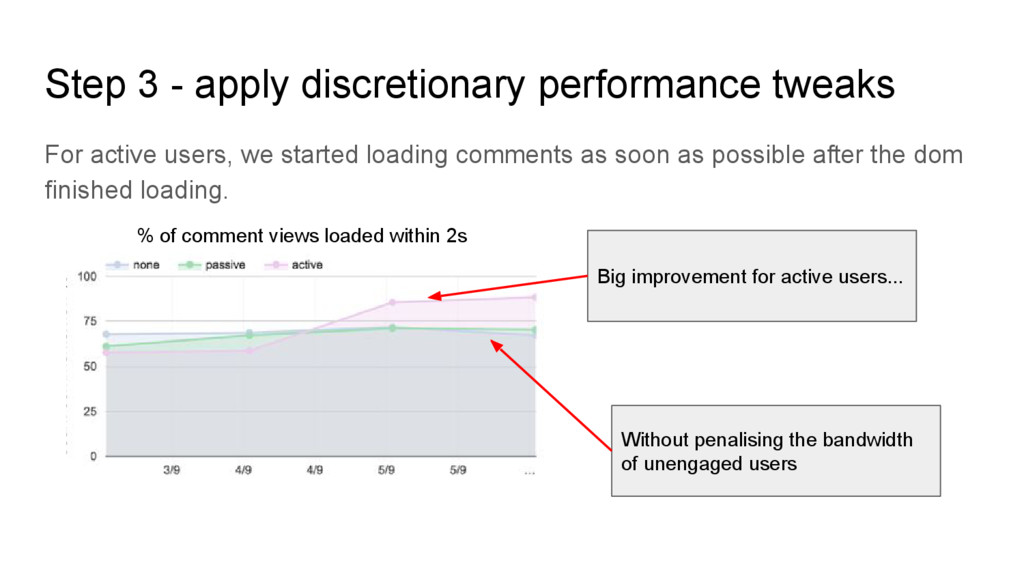
possible after the dom
    finished loading.
    Step 3 - apply discretionary performance tweaks
    Big improvement for active users...
    Without penalising the bandwidth
    of unengaged users
    % of comment views loaded within 2s

    View Slide

  15. 3 key facts:
    1. We still lazy load for most users
    2. Load within
    2s 75% of the time for users who care
    3. Underlying service 75th percentile response time is
    7s

    View Slide

  16. 3 key facts:
    1. We still lazy load for most users
    2. Load within
    2s 75% of the time for users who care
    3. Underlying service 75th percentile response time is
    7s
    2s
    2s
    2s
    2s
    7s
    7s
    7s
    7s

    View Slide

  17. Impact
    Massive decrease in frequency of people asking me to improve comments

    View Slide

  18. Happy customers joining the debate

    View Slide

  19. TL;DO (too long; drifted off)
    ● Even when empowered to 
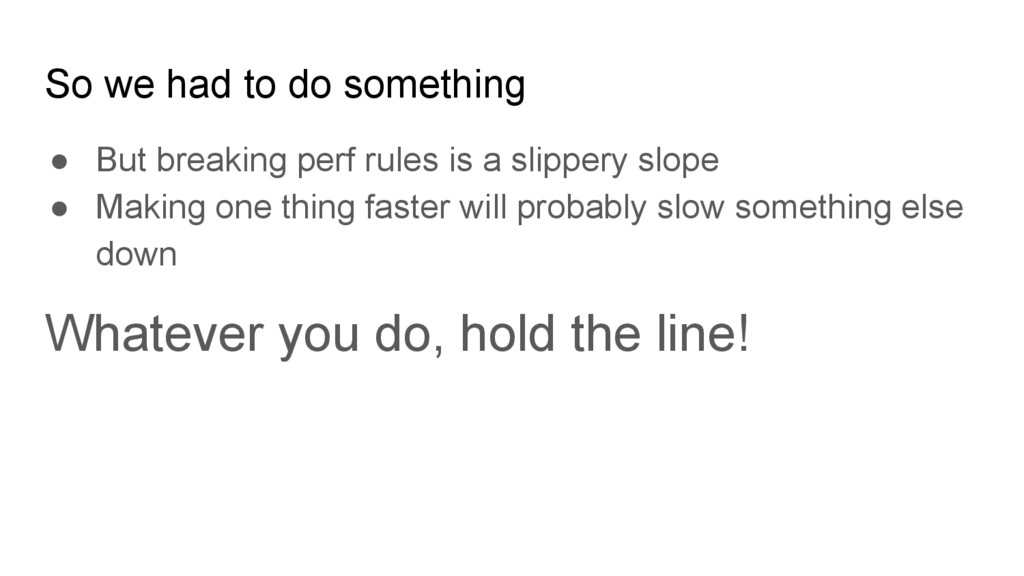
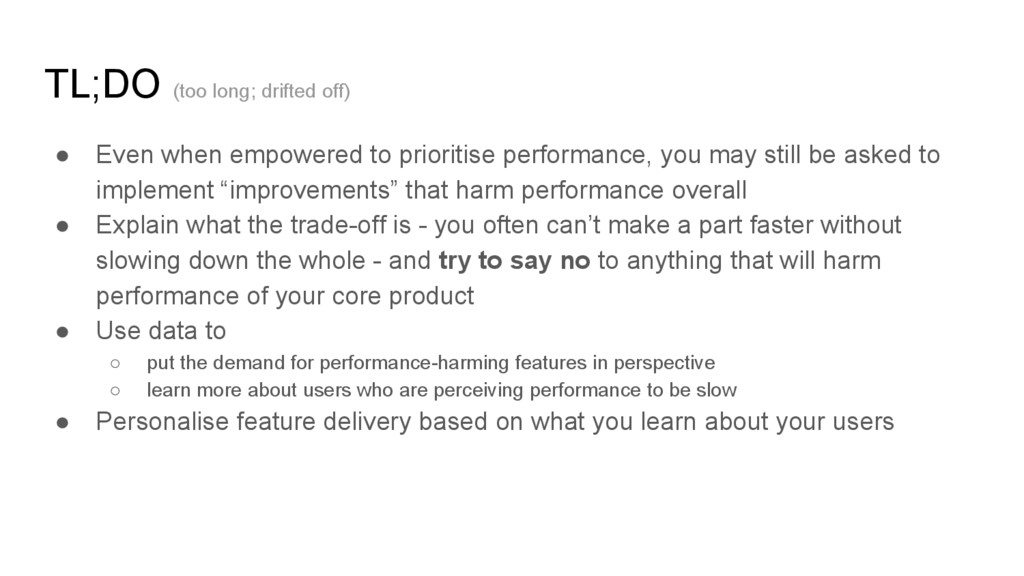
prioritise performance, you may still be asked to
    implement “improvements” that harm performance overall
    ● Explain what the trade-off is - you often can’t make a part faster without
    slowing down the whole - and try to say no to anything that will harm
    performance of your core product
    ● Use data to
    ○ put the demand for performance-harming features in perspective
    ○ learn more about users who are perceiving performance to be slow
    ● Personalise feature delivery based on what you learn about your users

    View Slide

  20. Any comments?

    View Slide