$30 off During Our Annual Pro Sale. View Details »

Python ウェブアプリケーションのためのプロファイラの実装 // Implementation of a profiler for Python web applications

Python ウェブアプリケーションのためのプロファイラの実装 // Implementation of a profiler for Python web applications

PyCon JP 2019 でのトークの発表資料です.
- GitHub: https://github.com/ymyzk/wsgi_lineprof
- YouTube: https://www.youtube.com/watch?v=ojnVMGon5d4

スライド中のリンクをクリックしたい場合は PDF ファイルをダウンロードして下さい.

Yusuke Miyazaki

September 16, 2019
Tweet

More Decks by Yusuke Miyazaki

Other Decks in Programming

Transcript

  1. Python΢ΣϒΞϓϦέʔγϣϯͷͨΊͷ

    ϓϩϑΝΠϥͷ࣮૷
    Yusuke Miyazaki

    PyCon JP 2019 / 2019-09-16
    Implementation of a profiler for Python web applications

    View Slide

  2. Who am I?
    • Yusuke Miyazaki / ٶ㟒 ༐ี / @ymyzk
    • Site Reliability Engineer @ Indeed
    • Personal projects
    • wsgi_lineprof: line-by-line profiler
    • mypy Playground: mypy on web browsers
    • tox-gh-actions:

    smooth integration of tox with GitHub Actions
    • See ymyzk.com for more details

    View Slide

  3. Have you ever used a profiler?


    Result at PyCon JP: about 50%

    View Slide

  4. Have you ever built a profiler?


    " " "
    Result at PyCon JP: only 1 person

    View Slide

  5. Goal of the Talk
    “Implementing a profiler is not so difficult”

    through understanding inside of a profiler

    View Slide

  6. Agenda
    • Introduction
    • What is wsgi_lineprof?
    • Features of wsgi_lineprof
    • How wsgi_lineprof works?
    • Technologies for implementing a profiler
    • Conclusion

    View Slide

  7. What is wsgi_lineprof?

    View Slide

  8. Line-by-Line Profiler for Web Apps
    Shows line-by-line execution time for each request

    View Slide

  9. How to Use
    Add a few lines to the existing WSGI application
    # Your existing WSGI application
    app: WSGIApplication
    # Enable profiler
    from wsgi_lineprof.middleware \

    import LineProfilerMiddleware
    app = LineProfilerMiddleware(app)

    View Slide

  10. Features of wsgi_lineprof
    • Line-by-line profiling
    • Finding a bottleneck quickly
    • WSGI middleware
    • Integration with many Python web applications
    • Easily pluggable
    • All configuration for profiling in one place

    View Slide

  11. Predecessors
    wsgi_lineprof is inspired by the predecessors
    • Line-by-line profiler for Python
    • rkern/line_profiler
    • Line-by-line profiler for Ruby web applications
    • kainosnoema/rack-lineprof

    View Slide

  12. How wsgi_lineprof works?

    View Slide

  13. Python
    Architecture
    Web

    Server
    Web

    App

    View Slide

  14. Python
    Architecture
    Web

    Server
    Web

    App
    Profiler
    1. Capture

    request/response

    View Slide

  15. Python
    Architecture
    Web

    Server
    Web

    App
    Profiler
    1. Capture

    request/response
    2. Get information

    on execution

    View Slide

  16. Python
    Architecture
    Web

    Server
    Web

    App
    Profiler
    Timer
    1. Capture

    request/response
    2. Get information

    on execution
    3. Measure exec. time

    per line precisely

    View Slide

  17. WSGI Middleware
    wsgi_lineprof is implemented as a WSGI middleware
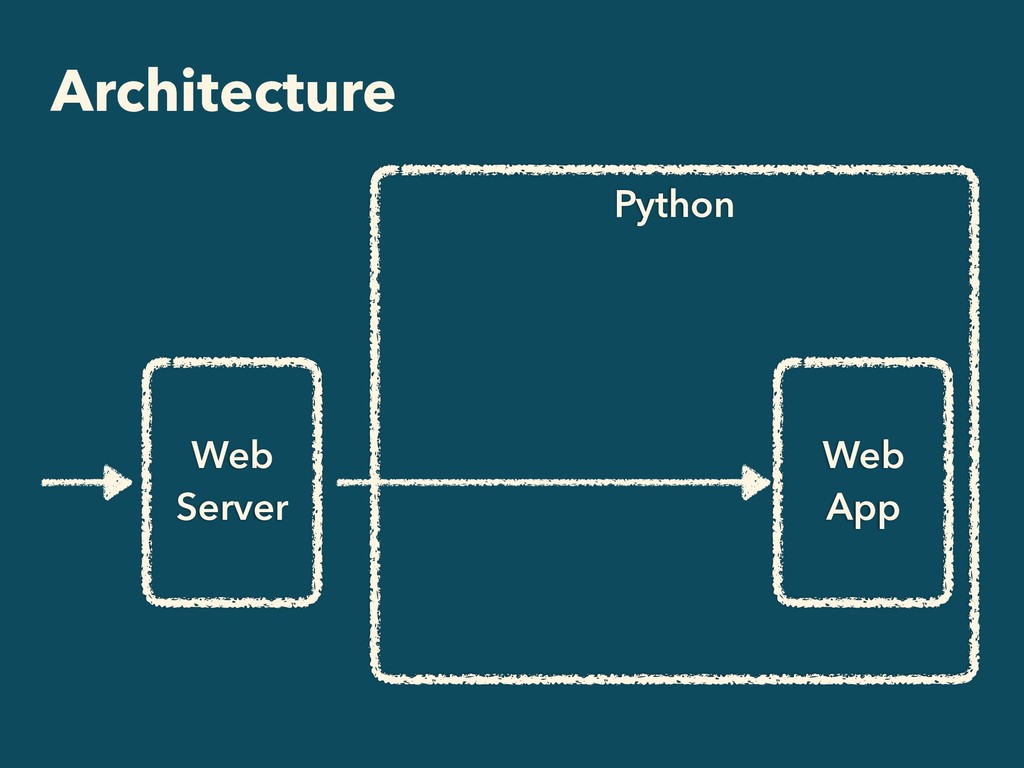
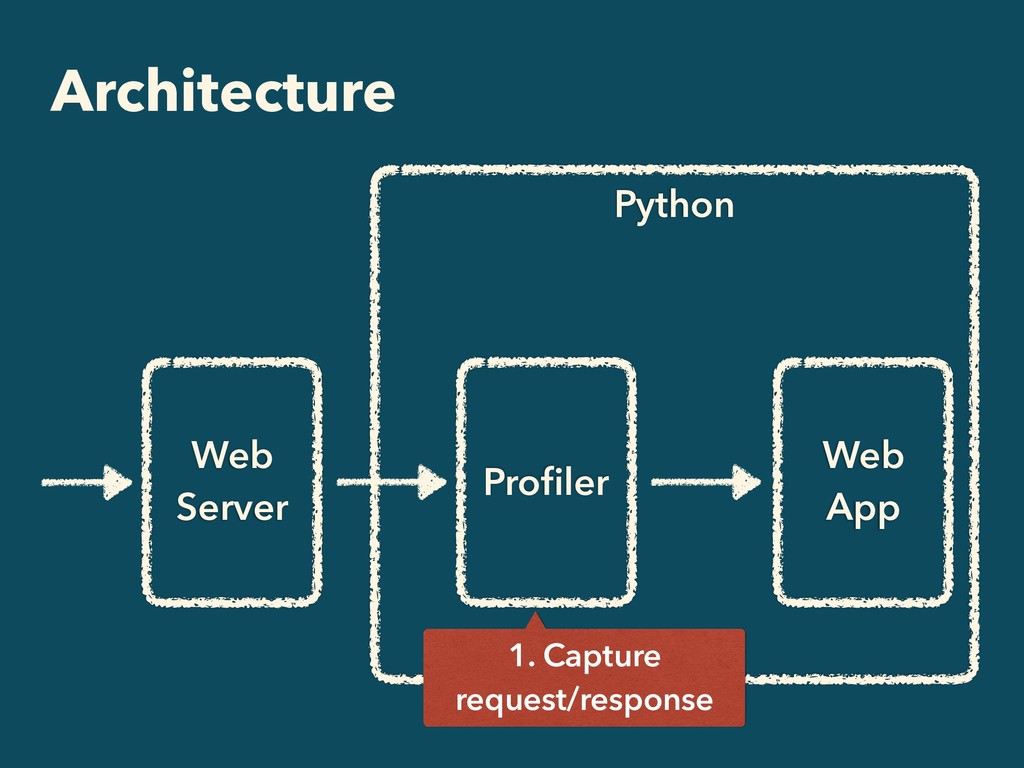
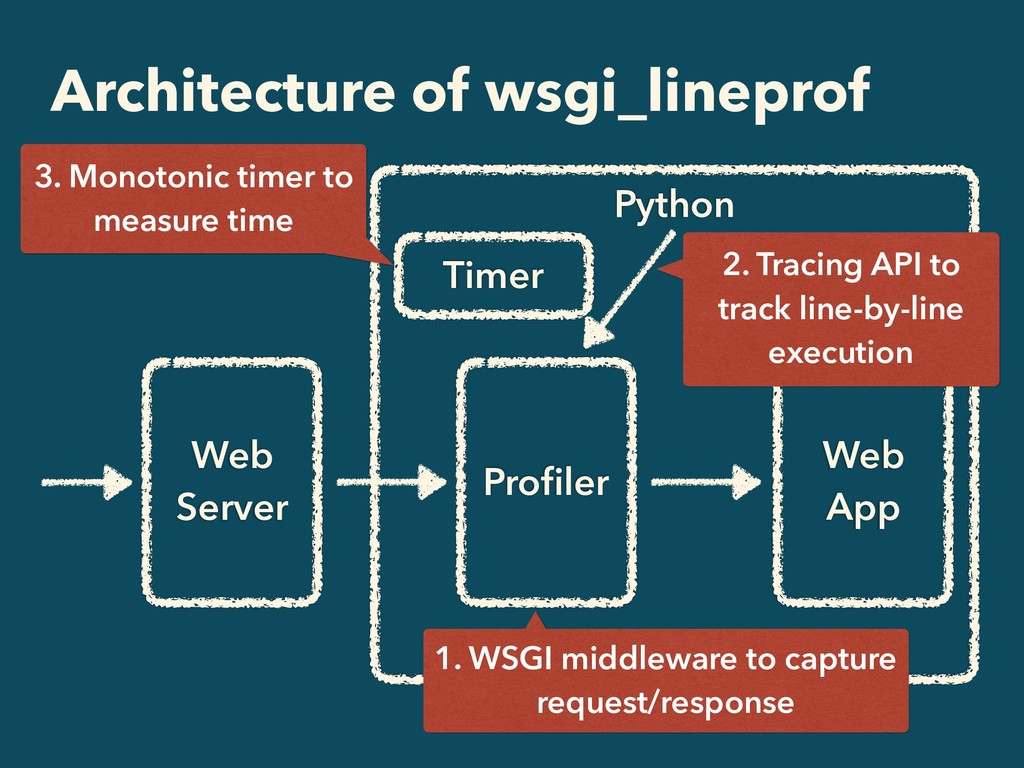
    • What is WSGI middleware?
    • Wrapper for WSGI app to add features
    • Why WSGI middleware?
    • Keep track of HTTP requests
    • Support multiple web application frameworks
    • Easily enable/disable a middleware

    View Slide

  18. Implementing WSGI Middleware
    • WSGI application is a callable (e.g., 
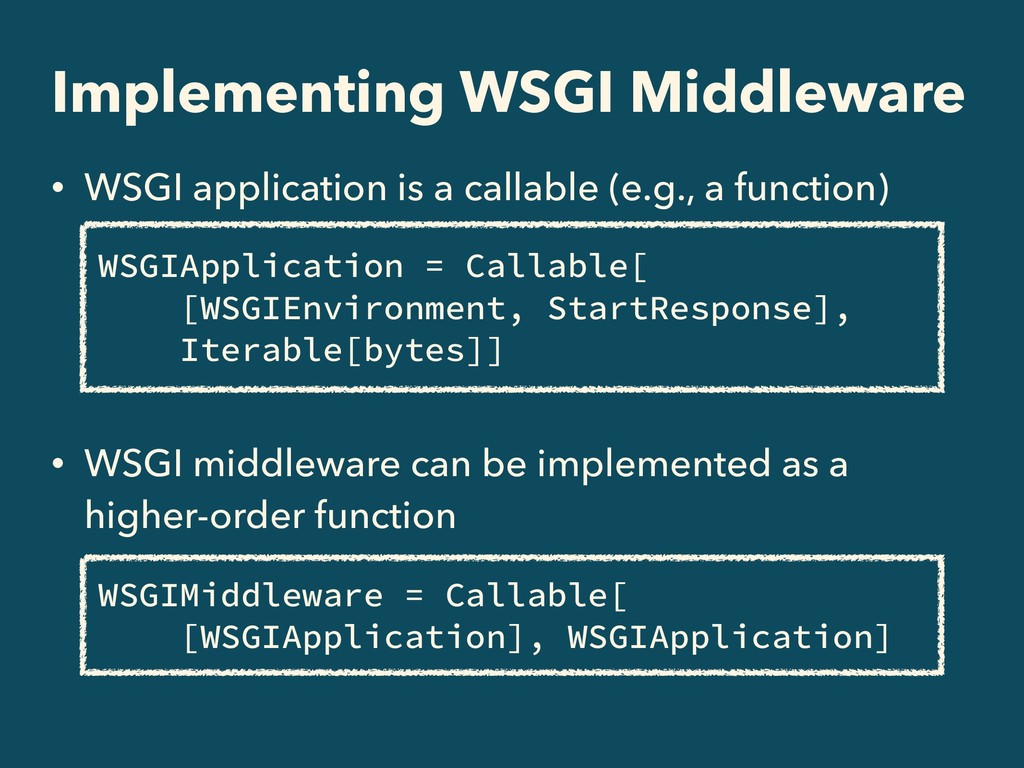
a function)
    • WSGI middleware can be implemented as a
    higher-order function
    WSGIApplication = Callable[

    [WSGIEnvironment, StartResponse],

    Iterable[bytes]]
    WSGIMiddleware = Callable[

    [WSGIApplication], WSGIApplication]

    View Slide

  19. Example of WSGI Middleware
    class MyMiddleware:
    def __init__(self, app):
    self.app = app


    def __call__(self, env, start_response):
    print(“start profiling”)

    res = self.app(env, start_response)

    print(“end profiling”)
    return res
    See wsgi_lineprof/middleware.py

    View Slide

  20. Tracing Line-by-Line Execution
    wsgi_lineprof uses PyEval_SetTrace Python/C API
    via Cython 
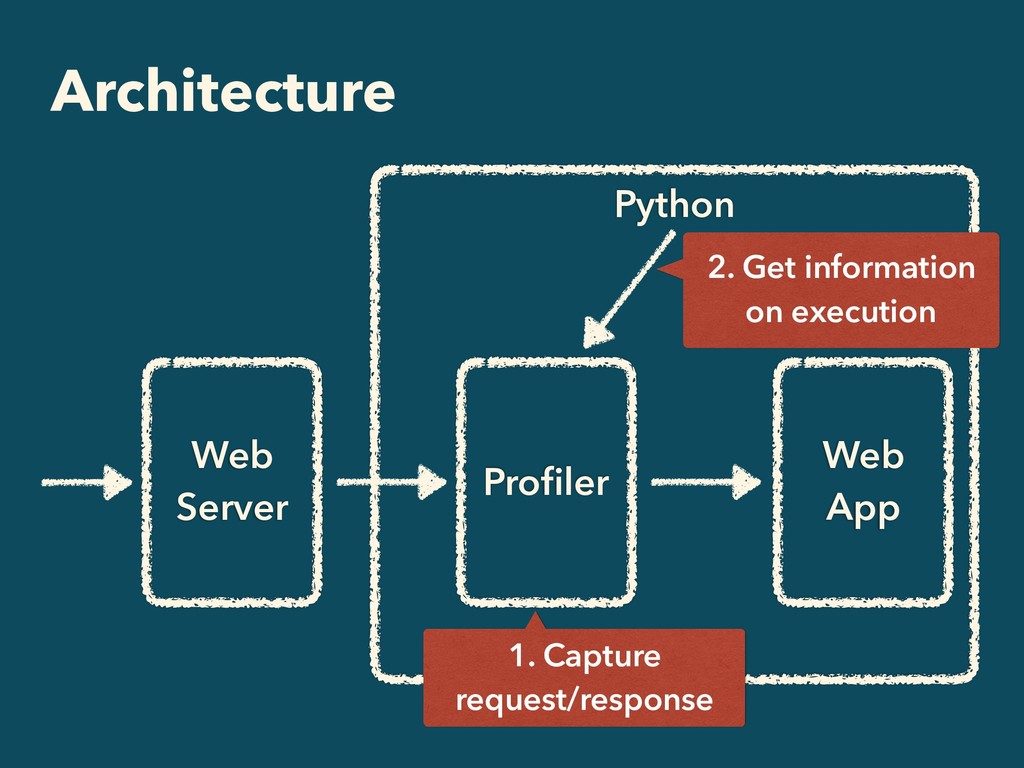
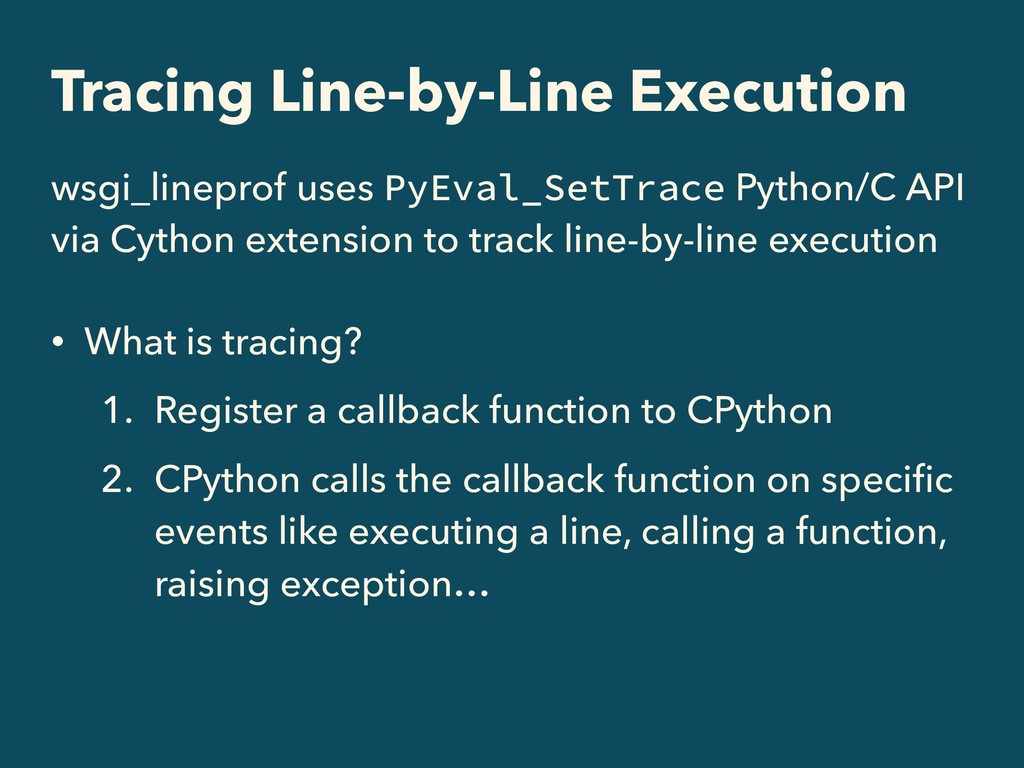
extension to track line-by-line execution
    • What is tracing?
    1. Register a callback function to CPython
    2. CPython calls the callback function on specific
    events like executing a line, calling a function,
    raising exception…

    View Slide

  21. How to Use Tracing on CPython
    CPython provides various levels 
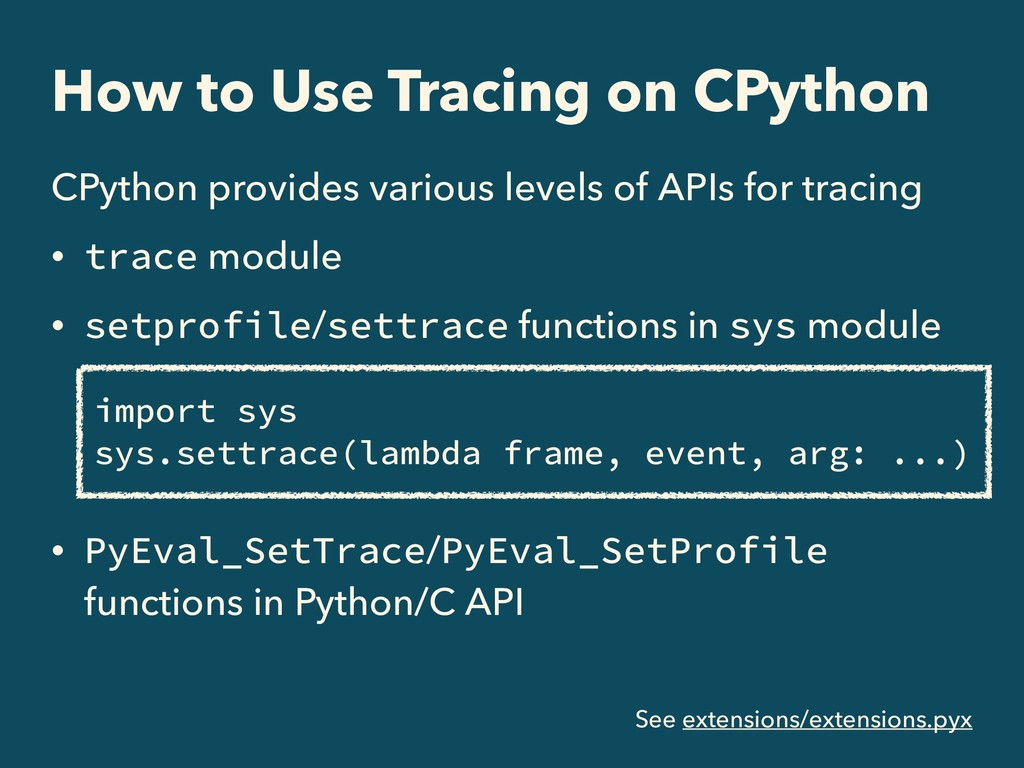
of APIs for tracing
    • trace module
    • setprofile/settrace functions in sys module


    • PyEval_SetTrace/PyEval_SetProfile
    functions in Python/C API
    import sys
    sys.settrace(lambda frame, event, arg: ...)
    See extensions/extensions.pyx

    View Slide

  22. How CPython Evaluates Source Code
    1. Read source code
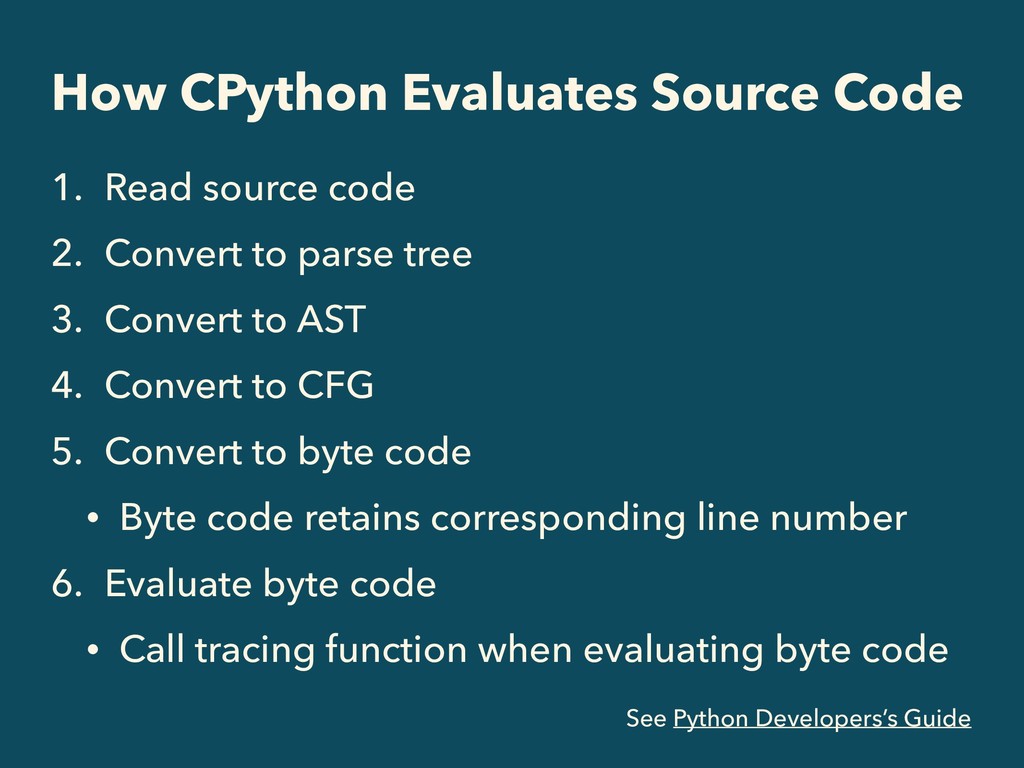
    2. Convert to parse tree
    3. Convert to AST
    4. Convert to CFG
    5. Convert to byte code
    • Byte code retains corresponding line number
    6. Evaluate byte code
    • Call tracing function when evaluating byte code
    See Python Developers’s Guide

    View Slide

  23. Measuring Time
    wsgi_lineprof calls a different timer via C extension
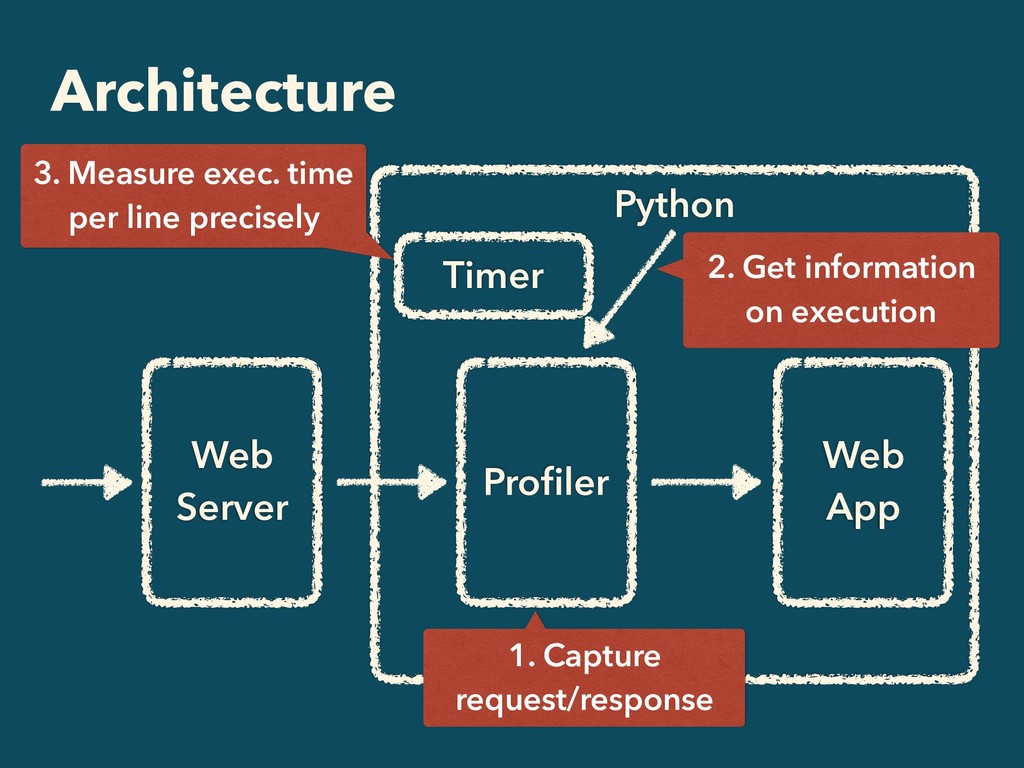
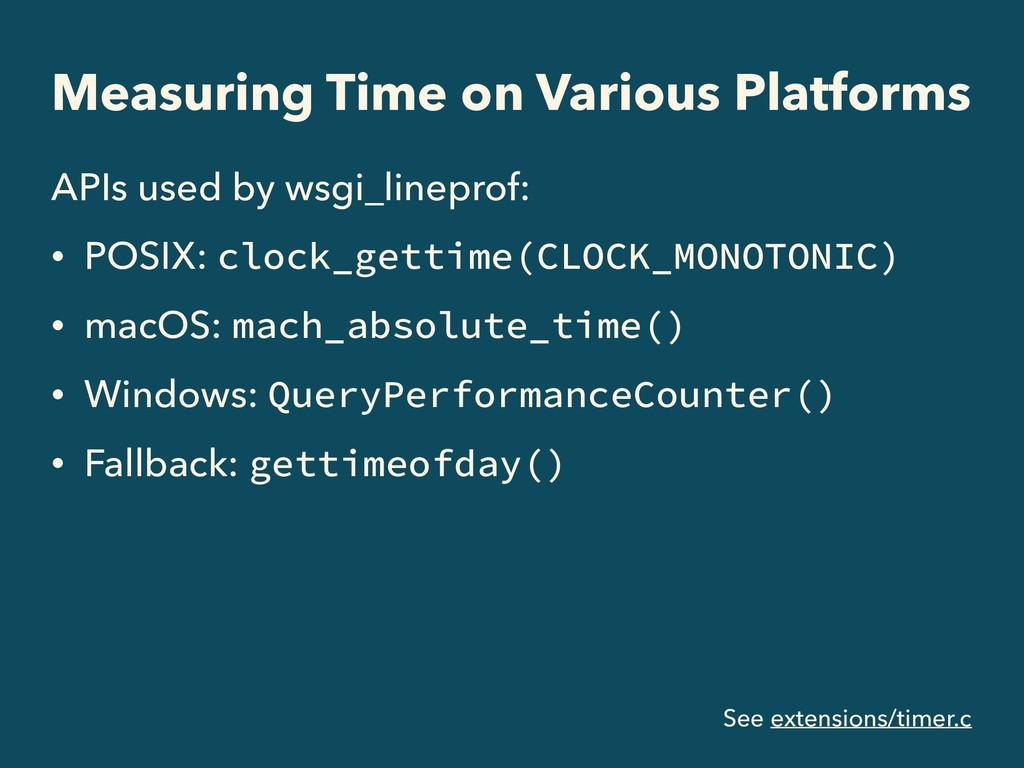
    depending on platforms for measuring time

    • Why measuring time is not simple?
    • Needs to use monotonic timer
    • time.time() / datetime.now() are not
    • Reduce overhead of getting time
    • Use of time.monotonic/perf_counter()
    incurs additional overhead

    View Slide

  24. Measuring Time on Various Platforms
    APIs used by wsgi_lineprof:
    • POSIX: clock_gettime(CLOCK_MONOTONIC)
    • macOS: mach_absolute_time()
    • Windows: QueryPerformanceCounter()
    • Fallback: gettimeofday()
    See extensions/timer.c

    View Slide

  25. • Cython: for implementing the core logic
    • linecache: for 
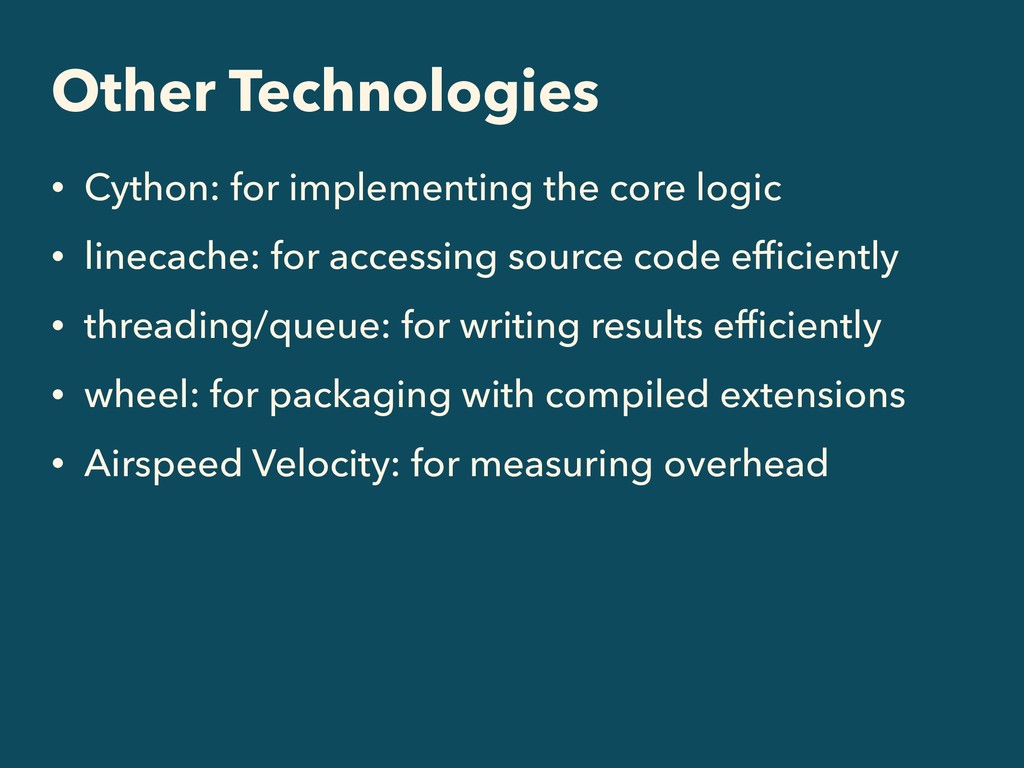
accessing source code efficiently
    • threading/queue: for writing results efficiently
    • wheel: for packaging with compiled extensions
    • Airspeed Velocity: for measuring overhead
    Other Technologies

    View Slide

  26. Conclusion

    View Slide

  27. Python
    Architecture of wsgi_lineprof
    Web

    Server
    Web

    App
    Profiler
    Timer
    1. WSGI middleware to capture

    request/response
    2. Tracing API to
    track line-by-line
    execution
    3. Monotonic timer to
    measure time

    View Slide

  28. Conclusion
    We can build a profiler by combining some basic
    technologies, though making an efficient profiler
    requires additional efforts 

    Future plan of wsgi_lineprof:
    • Show result via HTTP endpoint
    • Support ASGI (asyncio) / multithread
    • Reduce overhead
    wsgi_lineprof is available on GitHub

    View Slide