Upgrade to Pro — share decks privately, control downloads, hide ads and more …

Quiet Time Research

Quiet Time Research

1440 Foundation

March 22, 2013
Tweet

More Decks by 1440 Foundation

Other Decks in Education

Transcript

  1. Stress in Turn Impacts Health & Behavior Stress & Trauma

    Compromises Brain Function Compromises Physical and Psychological Health Compromises Relationships & Behavior
  2. Purpose of Quiet Time   Reduce stress   Reduce violence

      Promote healthy brain development   Promote Mental Health   Happier, positive school climate   Increase clarity of mind   Increase self concept   Improve engagement and pro-social behavior   Improve academic performance
  3. Message from Superintendent “Isn't it ironic that we teach students

    about everything except about themselves? Quite simply, Quiet Time should be in every school.” - Carlos Garcia, Superintendent San Francisco Unified School District 2007 - 20012
  4. Suspension Reduction 1st Semester of Quiet Time Program at Visitacion

    Valley MS Fall 2006 Spring 2007 45% reduction # suspensions 8th grade (controls) 6th & 7th grade average (Quiet Time) The Quiet Time Program at Visitacion Valley Middle School began in March 2007. The 6th and 7th grade students learned TM at this time; 8th grade students did not. The 6th and 7th grades experienced a 45% drop in suspensions from predicted levels relative to controls. 17 25 27 22
  5. Substantial Drop in Suspension Rate VVMS compared to SF Middle

    School Average *Suspension calculated as total number of incidents divided by total school enrollment % Suspensions* 2007-08 2008-09 30 5 15 0 10 25 20 2009-10 Visitacion Valley Middle School Average of other SF Middle Schools (control) 79% drop in suspensions over 3 years Source: SFUSD 2010-11
  6. Reduction in Burton Suspension Rate after introduction of Quiet Time

    in Spring 2011 2009 to 2010 2010 to 2011 2011 to 2012 Source: School Data Prior to Quiet Time Quiet Time
  7. Quiet Time Program Begins 1st full year of program 89.50

    90.00 90.50 91.00 91.50 92.00 92.50 93.00 93.50 94.00 2004-05 2005-06 2006-07 2007-08 2008-09 2009-10 2010-11 Attendance Levels at Everett 94.00 94.50 95.00 95.50 96.00 96.50 97.00 97.50 98.00 98.50 99.00 2004-05 2005-06 2006-07 2007-08 2008-09 2009-10 2010-11 Average Daily Attendance at VVMS
  8. Average Yearly Change in Attendance QT School vs. All Other

    Middle Schools Fall 2007- Spring 2011 Fall 2008- Spring 2011 Fall 2007- Spring 2011 0 0.1 0.2 0.3 0.4 0.5 0.6 0.7 0.8 Visitacion Valley Middle School Everett Middle School Other SF Middle Schools Visitacion Valley Middle School Everett Middle School Other SF Middle Schools Percent Change in Attendance
  9. Burton High School: 1.6% Increase in Average Daily Attendance After

    Introduction of QT Program Fall 2010 Fall 2011 Source: SFUSD
  10. Change in Attendance Fall 2011-Spring 2012, Burton H.S. Random Assignment

    Study 94 94.5 95 95.5 96 96.5 97 97.5 TM Group Control Fall Spring p<.045
  11. 15 Improvement in Psychological Health Burton High School Students 2011

    – after first semester of QT program * Low self- esteem group Psychological Health 0 2 -3 -1 -2 1 Psycho- logical Stress p=.022 Depression p=.024 Anxiety p=.09 Self-Esteem* p=.15 Hyper- Activity p=.10 Source: standardized psychological instruments Control TM
  12. Change from Fall to Spring on Student Ratings by Teachers:

    DESSA -0.4 -0.2 0 0.2 0.4 0.6 0.8 1 1.2 Quiet Time School Control School *p<.01 **p<.075
  13. Change in Quality of Sleep for Burton Students October 2011-April

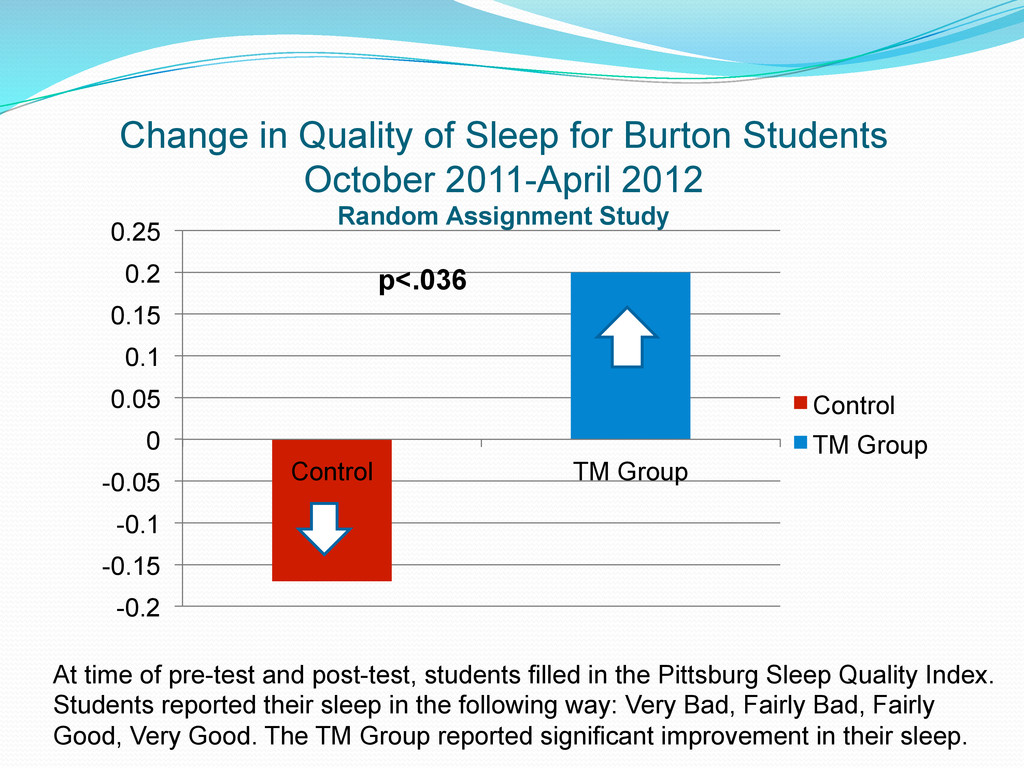
    2012 Random Assignment Study -0.2 -0.15 -0.1 -0.05 0 0.05 0.1 0.15 0.2 0.25 Control TM Group Control TM Group p<.036 At time of pre-test and post-test, students filled in the Pittsburg Sleep Quality Index. Students reported their sleep in the following way: Very Bad, Fairly Bad, Fairly Good, Very Good. The TM Group reported significant improvement in their sleep.
  14. Significant Differences Between TM & Control Random Assignment Study -3.5

    -3 -2.5 -2 -1.5 -1 -0.5 0 0.5 Emotional Symptoms Anger Fatigue TM Control
  15. VVMS English Achievement Percent of Below Proficient Students who increase

    at least one Performance Level Control Quiet Time 0 25 50 p = .005 Percentage with At Least One Performance Level Gain On California STAR 17.2% 36.8% Source: SFUSD Research Planning and Accountability Department. Education 131 (2011): 556 – 565.
  16. VVMS Math Achievement Percent of Below Proficient Students who increase

    at least one Performance Level Control Quiet Time 0 25 50 p = .001 Percentage with At Least One Performance Level Gain On California STAR 15.0% 40.7% Source: SFUSD Research Planning and Accountability Department. Education 131 (2011): 556 – 565.
  17. VVMS Composite STAR Test Scores For Below Basic & Far

    Below Basic Students Scaled STAR Scores Control Quiet Time 0 5 10 p = .019 Change in Composite Scale Scores on California STAR Source: SFUSD Research Planning and Accountability Department. Education 131 (2011): 556 – 565.
  18. Change in ELA Performance Level Randomized Control Trial, Burton H.S.

    3.1 3.2 3.3 3.4 3.5 3.6 3.7 3.8 3.9 Meditators Delayed-Start Controls 2011 2012 p = .08
  19. 24 Increase in GPA after Quiet Time Launch 1.9 Quiet

    Time Program Introduced Everett Middle School Source: SFUSD 2004 2005 2006 2007 2008 2009 2010 2.5 2.0 2.2 2.1 2.4 2.3 Visitacion Valley Middle School 2004 2005 2006 2007 2008 2009 2.2 2.8 2.3 2.5 2.4 2.7 2.6 2.9
  20. Change in GPA: Fall 2007-2009 0 0.05 0.1 0.15 0.2

    0.25 0.3 0.35 0.4 Vis & Everett Other SF Middle Schools Vis & Everett Other SF Middle Schools p=.019 Source: SFUSD
  21. Pan Systemic, Holistic Impact Quiet Time Stress Reduction Brain Integration

    Resilience Focus Creativity Memory Intelligence Happiness Anxiety Anger Depression Fatigue Sleep Problems Violence Suspensions Substance Abuse Incarceration Grades Test Scores Graduation Rates Pro-social Behavior Self Actualization