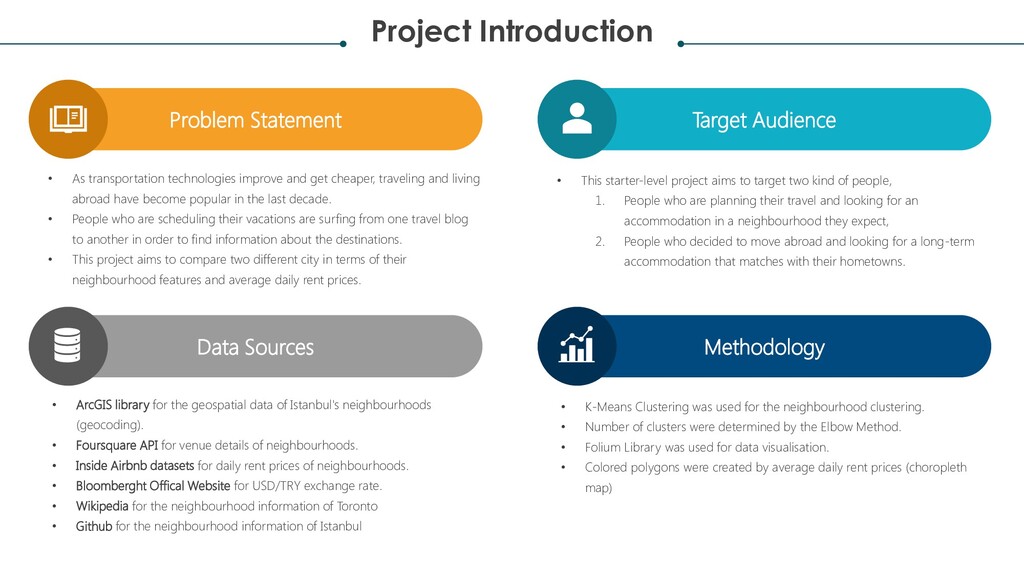
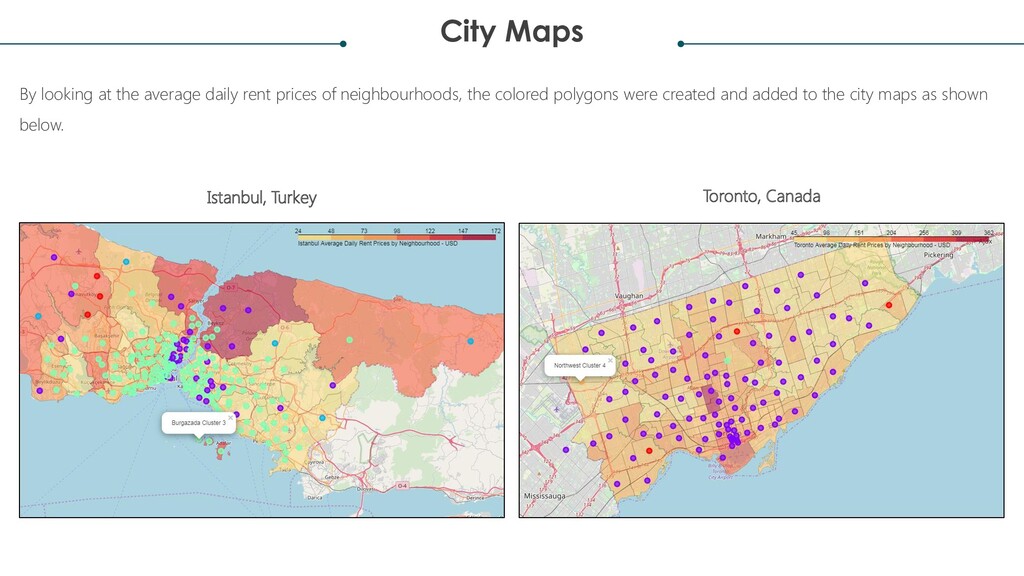
improve and get cheaper, traveling and living abroad have become popular in the last decade. • People who are scheduling their vacations are surfing from one travel blog to another in order to find information about the destinations. • This project aims to compare two different city in terms of their neighbourhood features and average daily rent prices. • This starter-level project aims to target two kind of people, 1. People who are planning their travel and looking for an accommodation in a neighbourhood they expect, 2. People who decided to move abroad and looking for a long-term accommodation that matches with their hometowns. Data Sources • ArcGIS library for the geospatial data of Istanbul's neighbourhoods (geocoding). • Foursquare API for venue details of neighbourhoods. • Inside Airbnb datasets for daily rent prices of neighbourhoods. • Bloomberght Offical Website for USD/TRY exchange rate. • Wikipedia for the neighbourhood information of Toronto • Github for the neighbourhood information of Istanbul Methodology • K-Means Clustering was used for the neighbourhood clustering. • Number of clusters were determined by the Elbow Method. • Folium Library was used for data visualisation. • Colored polygons were created by average daily rent prices (choropleth map)
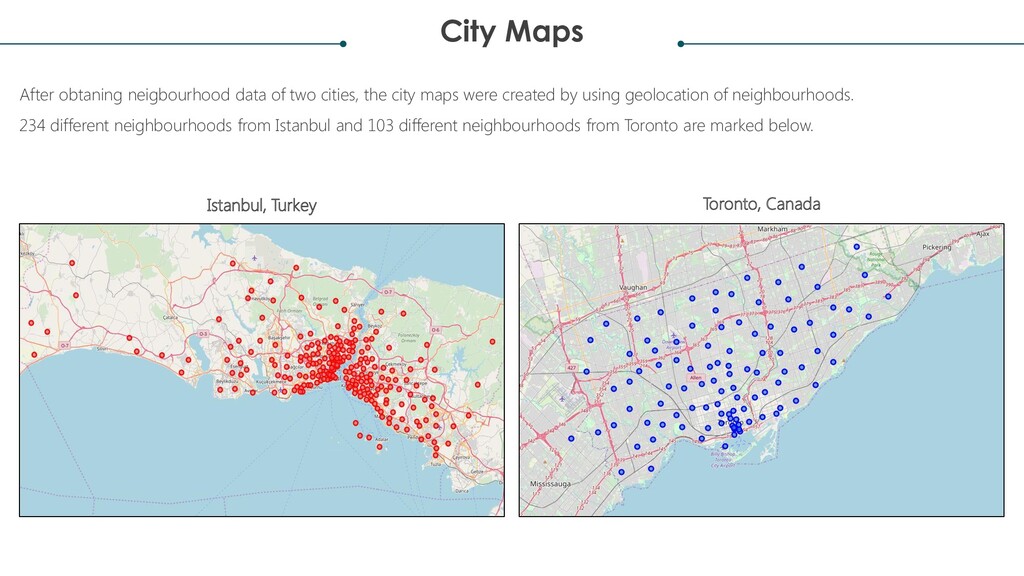
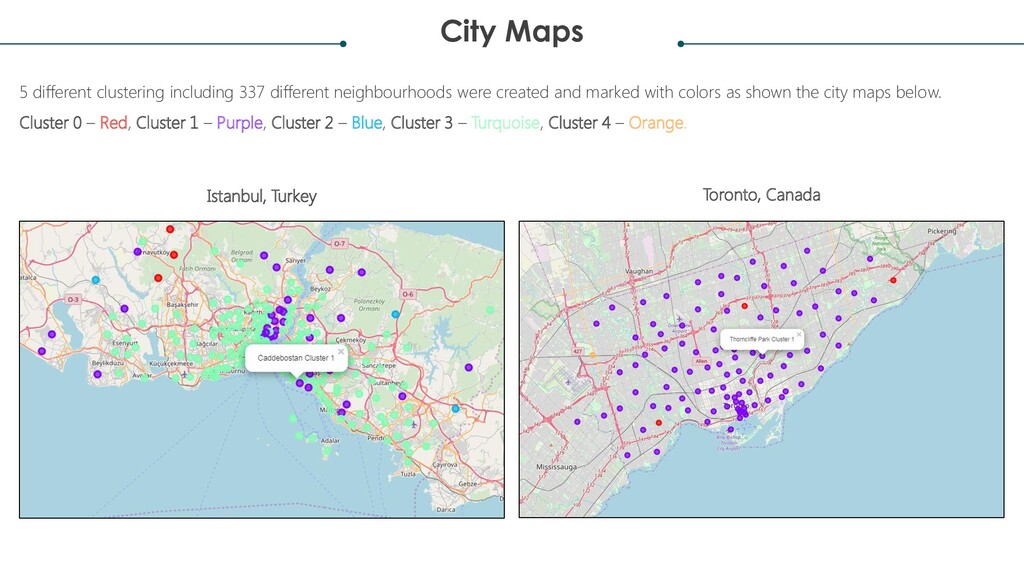
city maps were created by using geolocation of neighbourhoods. 234 different neighbourhoods from Istanbul and 103 different neighbourhoods from Toronto are marked below. Istanbul, Turkey Toronto, Canada
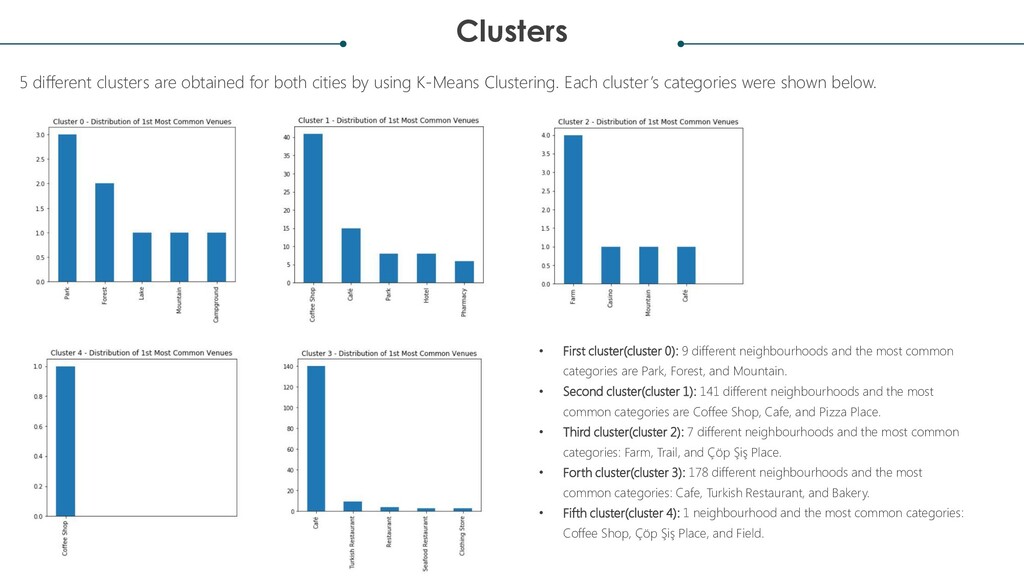
using K-Means Clustering. Each cluster’s categories were shown below. • First cluster(cluster 0): 9 different neighbourhoods and the most common categories are Park, Forest, and Mountain. • Second cluster(cluster 1): 141 different neighbourhoods and the most common categories are Coffee Shop, Cafe, and Pizza Place. • Third cluster(cluster 2): 7 different neighbourhoods and the most common categories: Farm, Trail, and Çöp Şiş Place. • Forth cluster(cluster 3): 178 different neighbourhoods and the most common categories: Cafe, Turkish Restaurant, and Bakery. • Fifth cluster(cluster 4): 1 neighbourhood and the most common categories: Coffee Shop, Çöp Şiş Place, and Field.
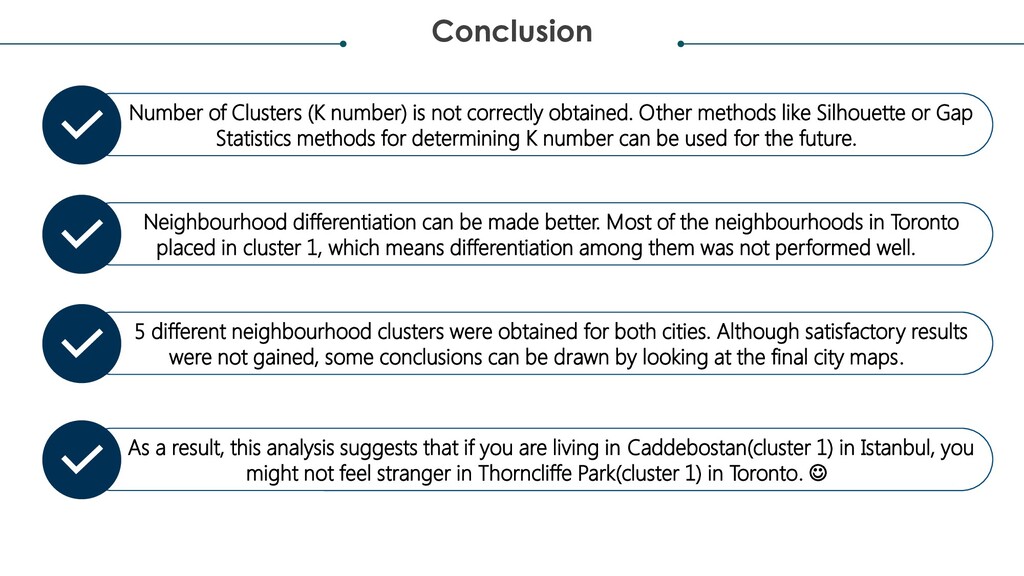
Other methods like Silhouette or Gap Statistics methods for determining K number can be used for the future. Neighbourhood differentiation can be made better. Most of the neighbourhoods in Toronto placed in cluster 1, which means differentiation among them was not performed well. 5 different neighbourhood clusters were obtained for both cities. Although satisfactory results were not gained, some conclusions can be drawn by looking at the final city maps. As a result, this analysis suggests that if you are living in Caddebostan(cluster 1) in Istanbul, you might not feel stranger in Thorncliffe Park(cluster 1) in Toronto. ☺

 Your Podcast. Everywhere. Effortlessly.


 3l4l5
 camel_404
 arnoknobbe
 cbtlibrary
 uranoken
 mutomasa
 juanmartin2026
 doratex
 bvr7352
 signer
 spring_aki
 hiola
 chriscoyier
 mza
 konakalab
 madoxten
 shlominoach
 portentint
 rkendrick25
 sonatard
 aleyda
 lara
 hannesfritz
 reverentgeek