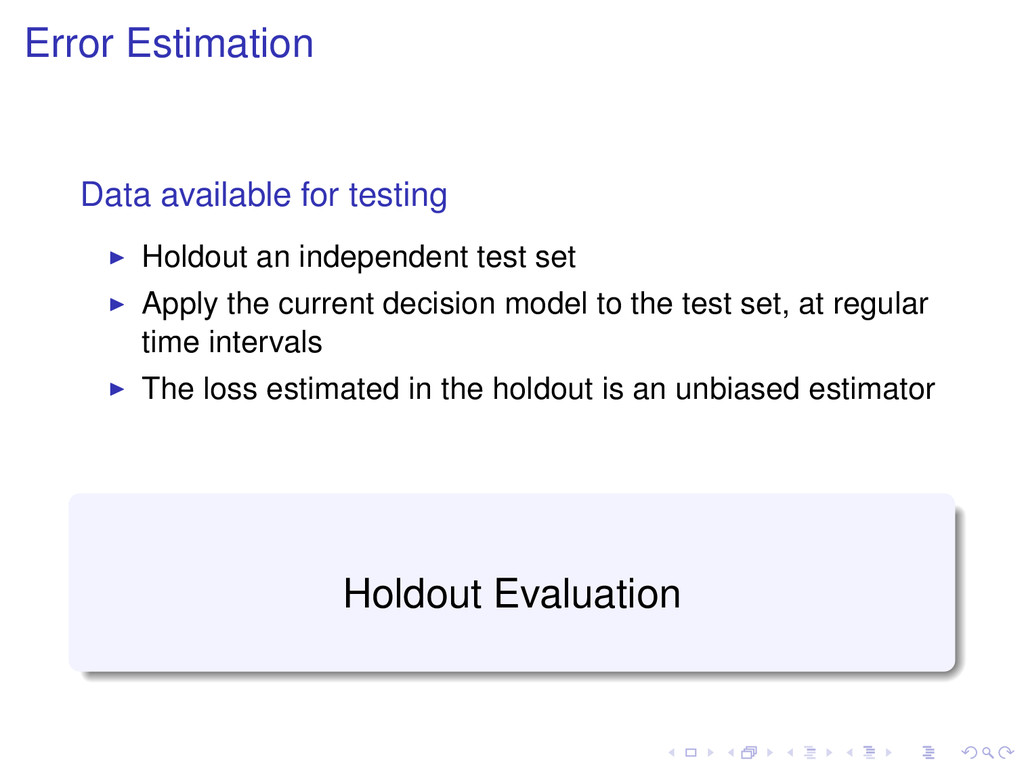
set Apply the current decision model to the test set, at regular time intervals The loss estimated in the holdout is an unbiased estimator Holdout Evaluation
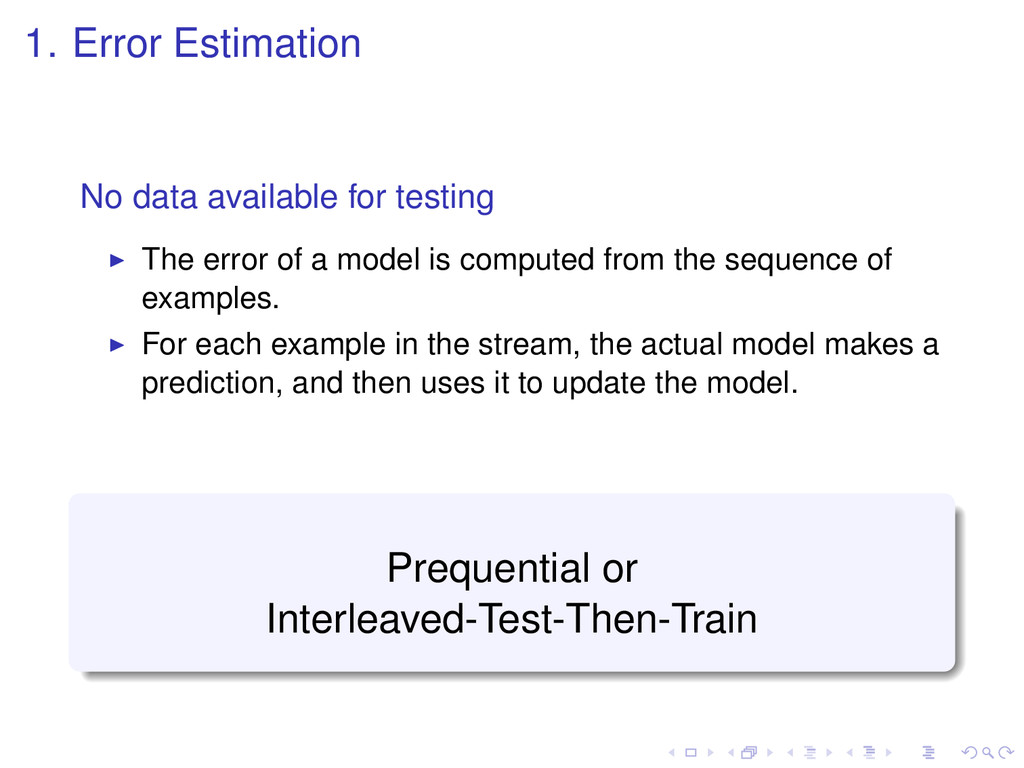
of a model is computed from the sequence of examples. For each example in the stream, the actual model makes a prediction, and then uses it to update the model. Prequential or Interleaved-Test-Then-Train
but needs data for testing. Use prequential to approximate Hold-out Estimate accuracy using sliding windows or fading factors Hold-out or Prequential or Interleaved-Test-Then-Train
prequential accuracy pc: probability that a chance classifier makes a correct prediction. κ statistic κ = p0 − pc 1 − pc κ = 1 if the classifier is always correct κ = 0 if the predictions coincide with the correct ones as often as those of the chance classifier Forgetting mechanism for estimating prequential kappa Sliding window of size w with the most recent observations
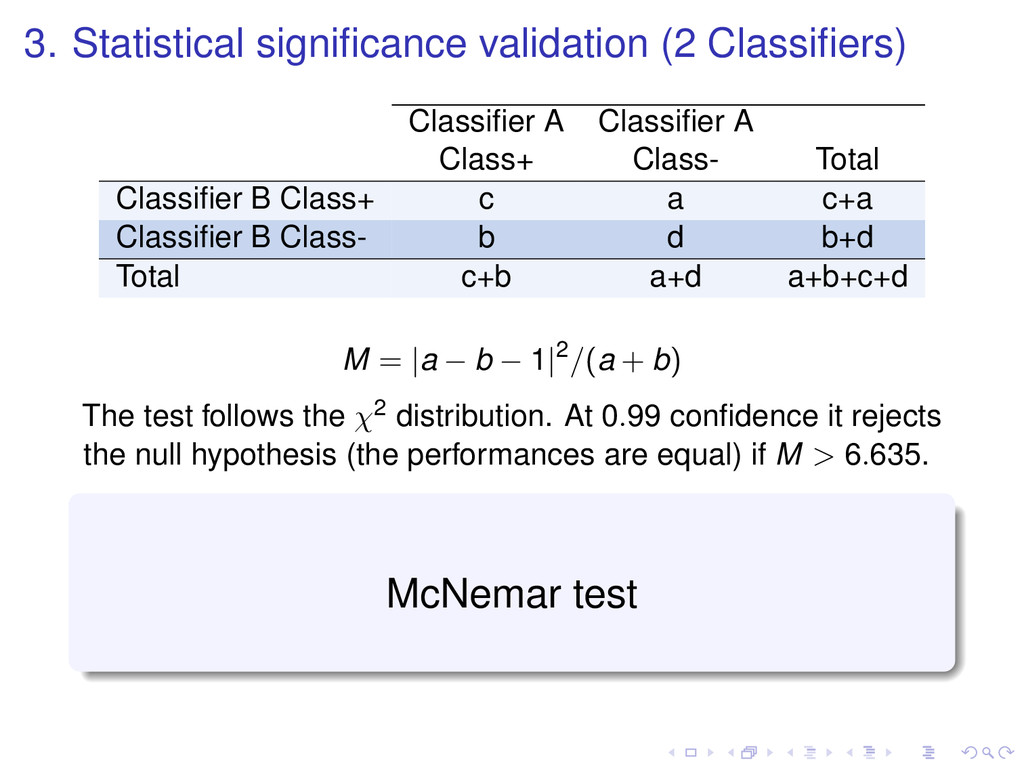
Class+ Class- Total Classifier B Class+ c a c+a Classifier B Class- b d b+d Total c+b a+d a+b+c+d M = |a − b − 1|2/(a + b) The test follows the χ2 distribution. At 0.99 confidence it rejects the null hypothesis (the performances are equal) if M > 6.635. McNemar test
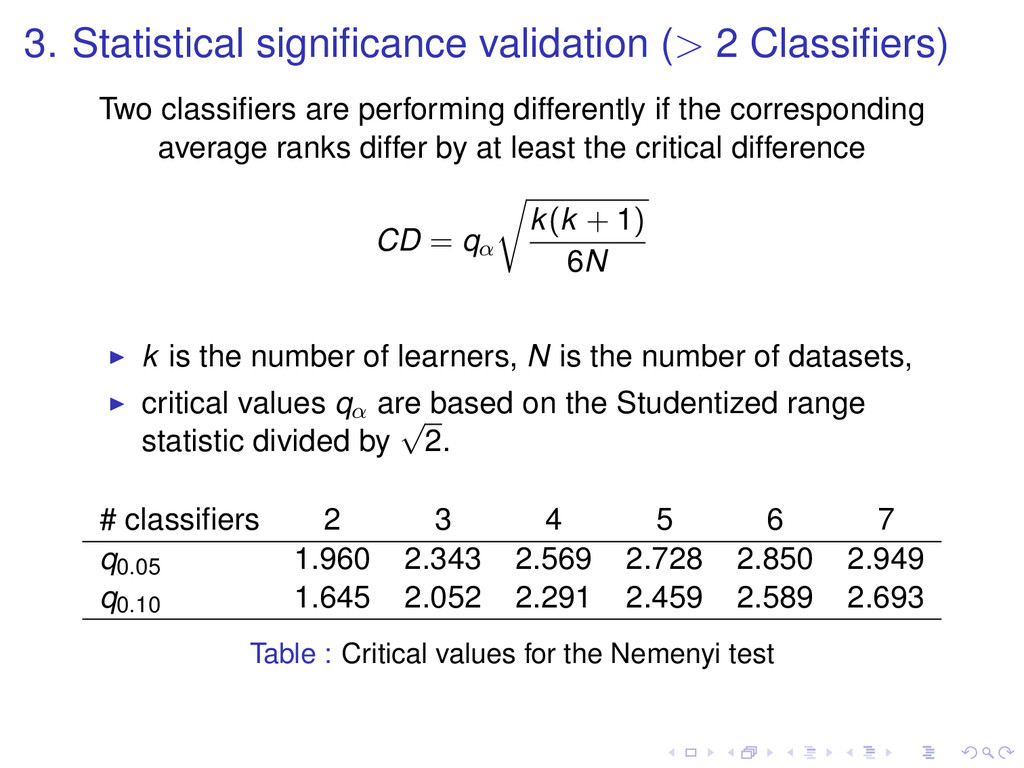
performing differently if the corresponding average ranks differ by at least the critical difference CD = qα k(k + 1) 6N k is the number of learners, N is the number of datasets, critical values qα are based on the Studentized range statistic divided by √ 2. Nemenyi test
performing differently if the corresponding average ranks differ by at least the critical difference CD = qα k(k + 1) 6N k is the number of learners, N is the number of datasets, critical values qα are based on the Studentized range statistic divided by √ 2. # classifiers 2 3 4 5 6 7 q0.05 1.960 2.343 2.569 2.728 2.850 2.949 q0.10 1.645 2.052 2.291 2.459 2.589 2.693 Table : Critical values for the Nemenyi test
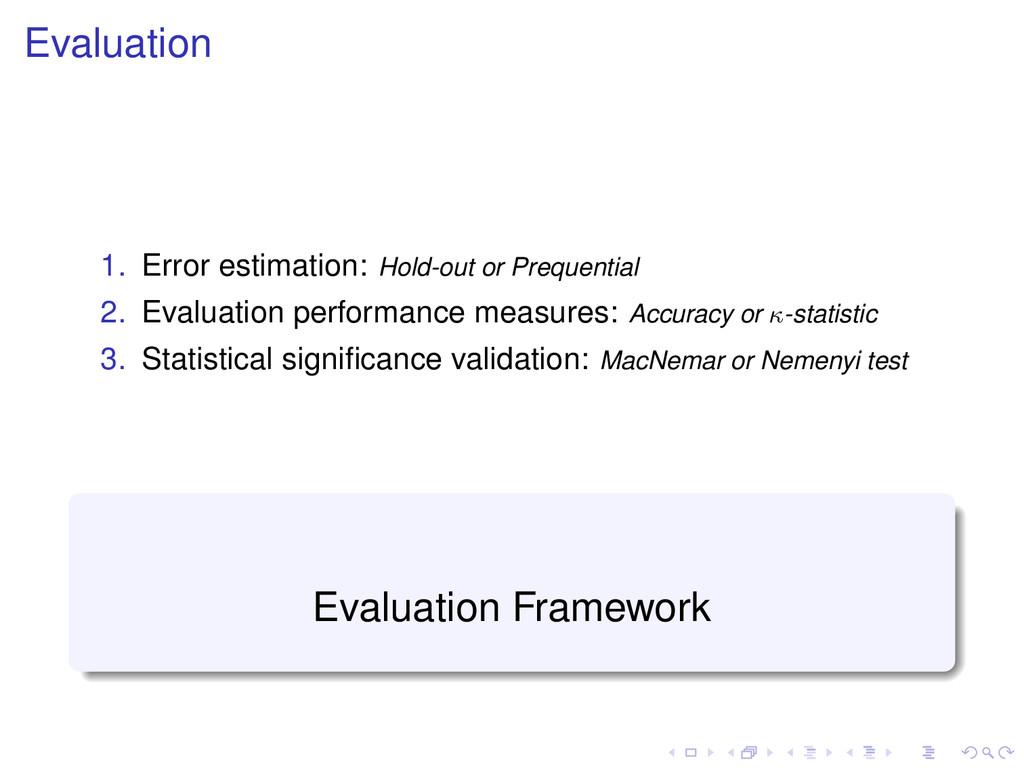
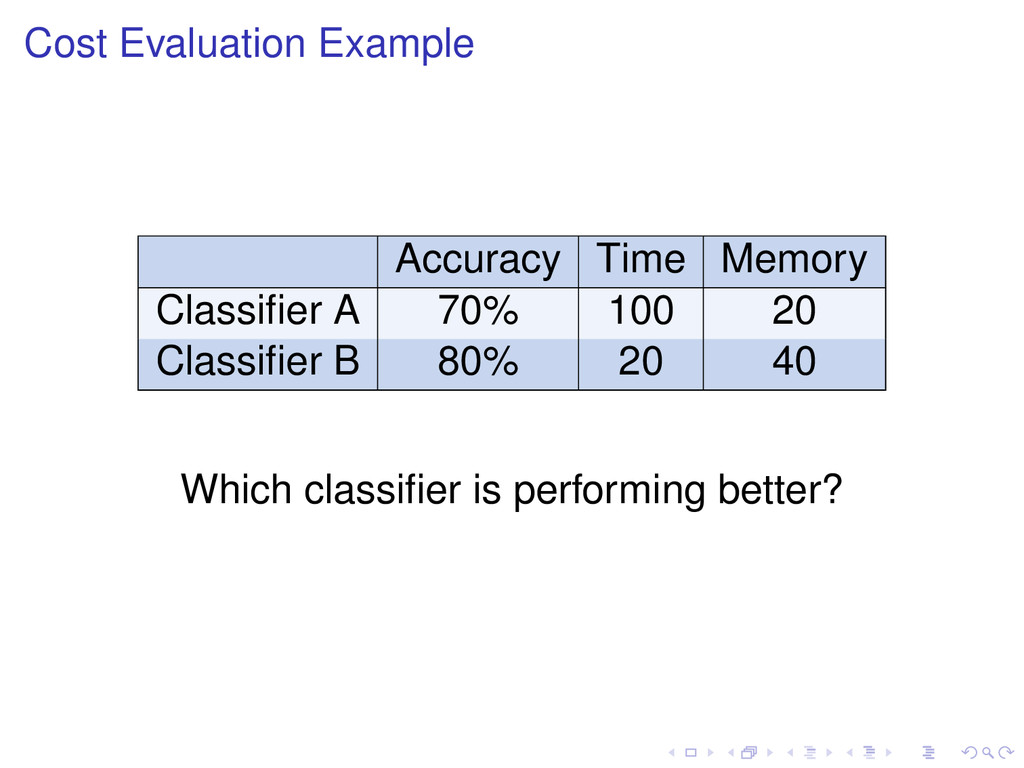
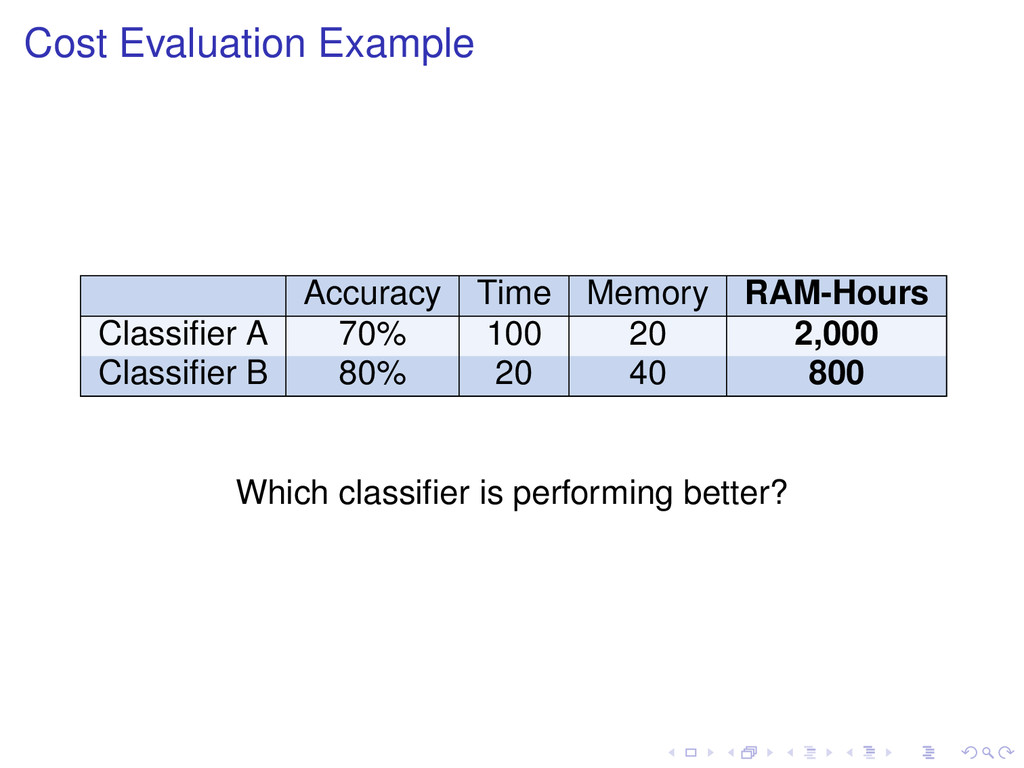
measures: Accuracy or κ-statistic 3. Statistical significance validation: MacNemar or Nemenyi test 4. Resources needed: time and memory or RAM-Hours Evaluation Framework