Upgrade to Pro — share decks privately, control downloads, hide ads and more …

Albuquerque Trends and Opportunities to 2040

Albuquerque Trends and Opportunities to 2040

Presented by Dr. Arthur C. Nelson at the Greater Albuquerque Association of REALTORS® on April 16, 2015.

More Decks by Greater Albuquerque Association of REALTORS®

Other Decks in Research

Transcript

  1. Albuquerque Trends and
    Opportunities to 2040
    Greater Albuquerque Association of Realtors
    Arthur C. Nelson, Ph.D., FAICP
    Professor of Planning &
    Real Estate Development
    University of Arizona
    April 16, 2015

    View Slide

  2. 2

    View Slide

  3. View Slide

  4. Trends & Opportunities
    Trends
    – Population
    – Households
    – Housing
    – Preferences
    Opportunities
    4

    View Slide

  5. New Housing Market Realities
    Sub-prime mortgages are history.
    20% down-payments are the new normal.
    Meaning
    – Smaller homes  maybe more people per home
    – Smaller lots
    – More attached units
    – More renters  including doubled-up renters
    5

    View Slide

  6. Population Change
    2010-2040
    Source: Woods & Poole Economics
    Figures in 
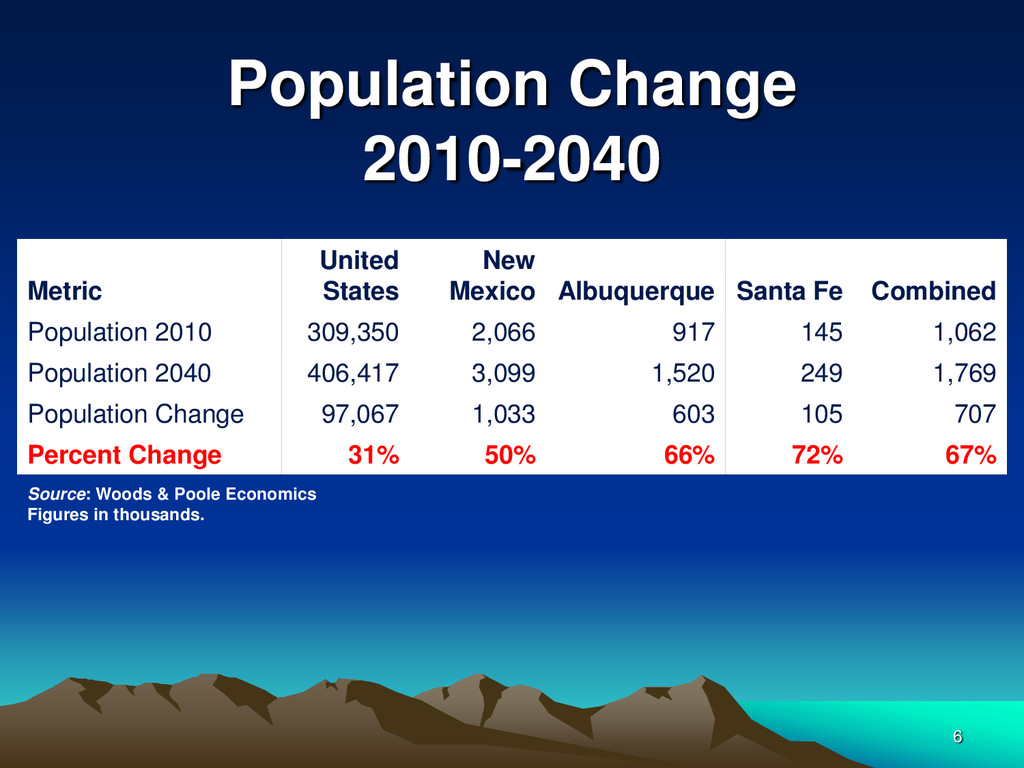
thousands.
    6
    Metric
    United
    States
    New
    Mexico Albuquerque Santa Fe Combined
    Population 2010 309,350 2,066 917 145 1,062
    Population 2040 406,417 3,099 1,520 249 1,769
    Population Change 97,067 1,033 603 105 707
    Percent Change 31% 50% 66% 72% 67%

    View Slide

  7. Population 65+ Change
    2010-2040
    Source: Woods & Poole Economics
    Figures 
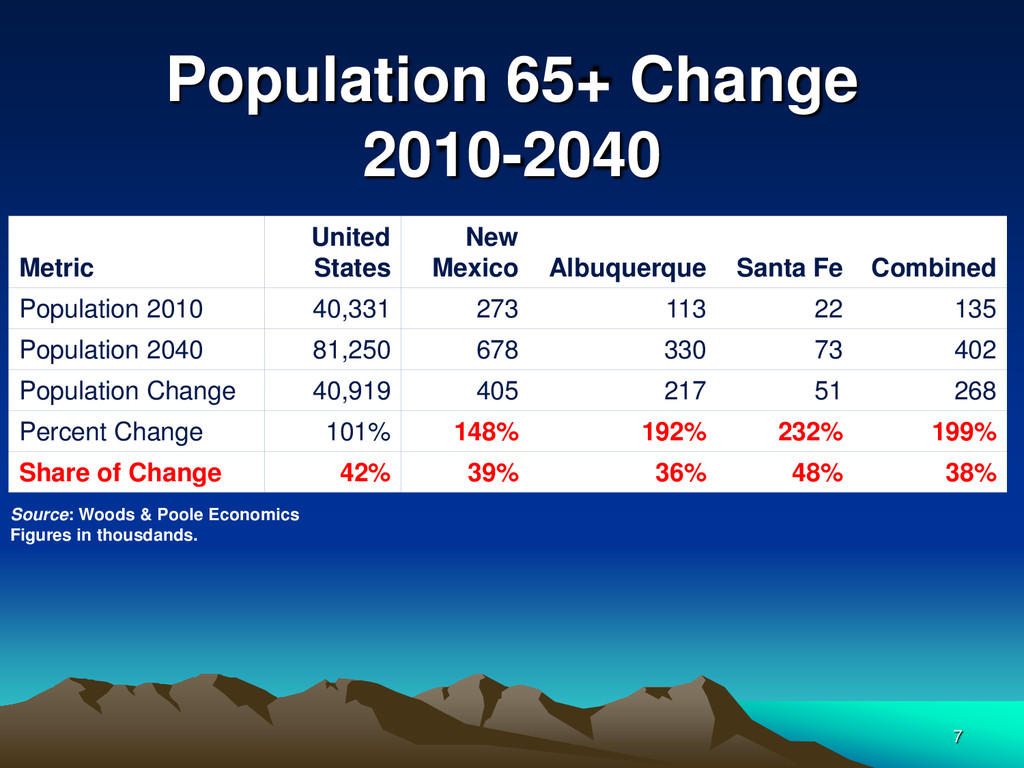
in thousdands.
    7
    Metric
    United
    States
    New
    Mexico Albuquerque Santa Fe Combined
    Population 2010 40,331 273 113 22 135
    Population 2040 81,250 678 330 73 402
    Population Change 40,919 405 217 51 268
    Percent Change 101% 148% 192% 232% 199%
    Share of Change 42% 39% 36% 48% 38%

    View Slide

  8. Population Race/Ethnicity
    Change 2010-2040
    Source: Adapted from Woods & Poole 
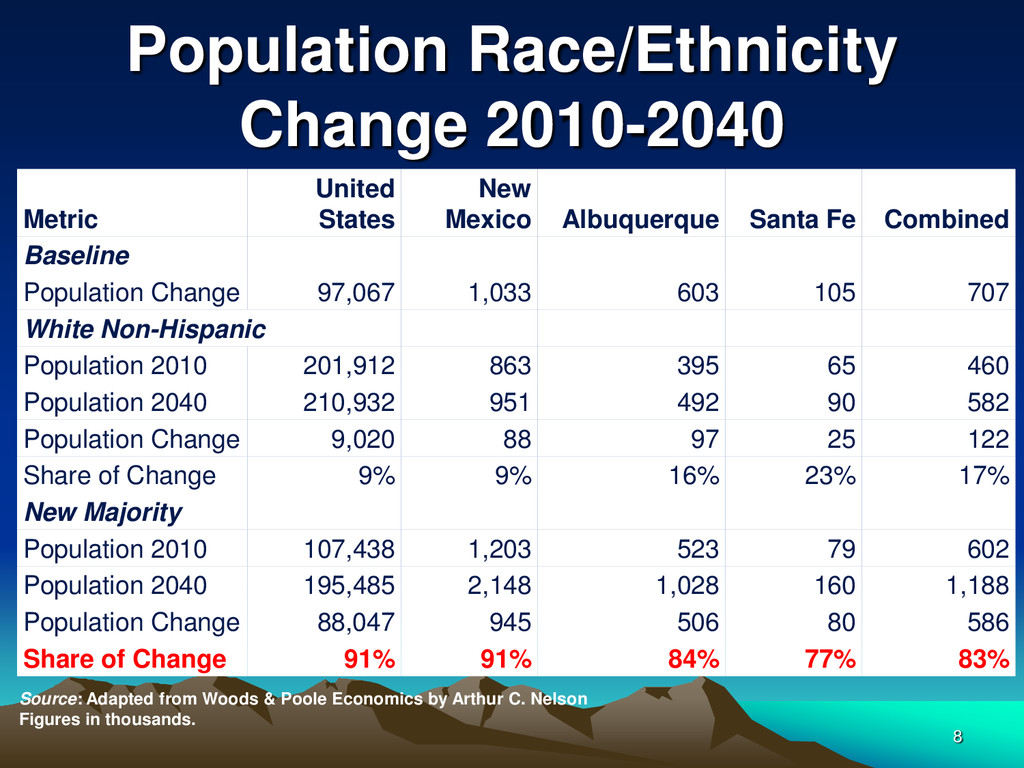
Economics by Arthur C. Nelson
    Figures in thousands.
    8
    Metric
    United
    States
    New
    Mexico Albuquerque Santa Fe Combined
    Baseline
    Population Change 97,067 1,033 603 105 707
    White Non-Hispanic
    Population 2010 201,912 863 395 65 460
    Population 2040 210,932 951 492 90 582
    Population Change 9,020 88 97 25 122
    Share of Change 9% 9% 16% 23% 17%
    New Majority
    Population 2010 107,438 1,203 523 79 602
    Population 2040 195,485 2,148 1,028 160 1,188
    Population Change 88,047 945 506 80 586
    Share of Change 91% 91% 84% 77% 83%

    View Slide

  9. Change in Households
    by Type, 2010-2040
    Source: Arthur C. Nelson
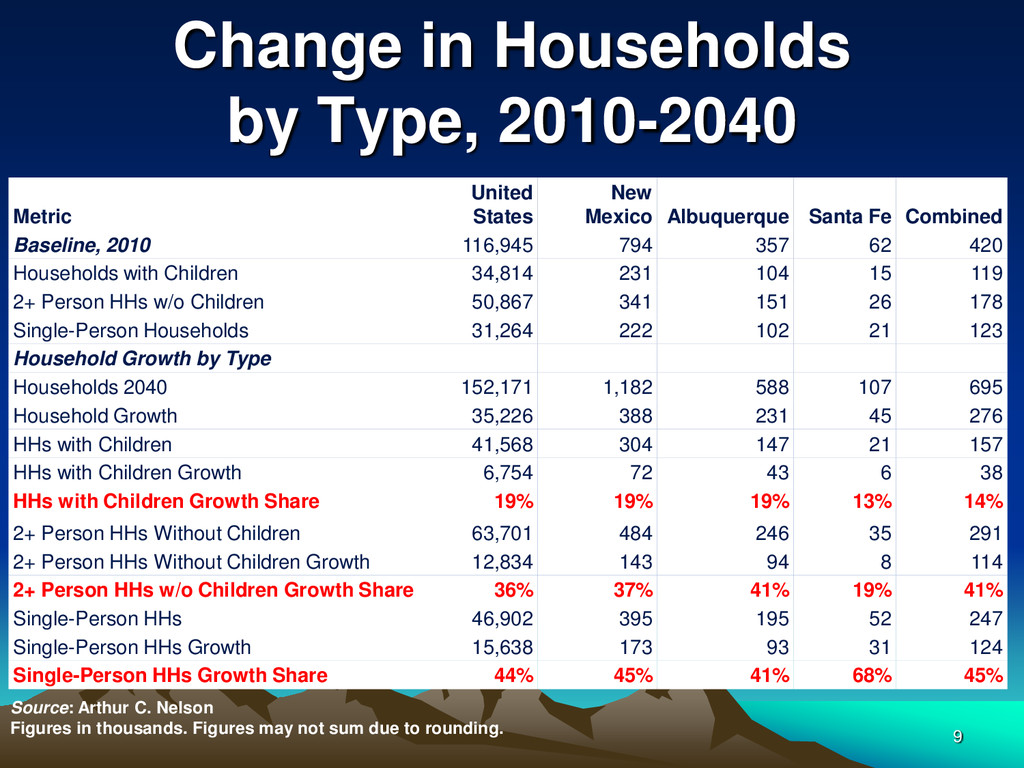
    Figures in thousands. Figures may not sum due to rounding. 9
    Metric
    United
    States
    New
    Mexico Albuquerque Santa Fe Combined
    Baseline, 2010 116,945 794 357 62 420
    Households with Children 34,814 231 104 15 119
    2+ Person HHs w/o Children 50,867 341 151 26 178
    Single-Person Households 31,264 222 102 21 123
    Household Growth by Type
    Households 2040 152,171 1,182 588 107 695
    Household Growth 35,226 388 231 45 276
    HHs with Children 41,568 304 147 21 157
    HHs with Children Growth 6,754 72 43 6 38
    HHs with Children Growth Share 19% 19% 19% 13% 14%
    2+ Person HHs Without Children 63,701 484 246 35 291
    2+ Person HHs Without Children Growth 12,834 143 94 8 114
    2+ Person HHs w/o Children Growth Share 36% 37% 41% 19% 41%
    Single-Person HHs 46,902 395 195 52 247
    Single-Person HHs Growth 15,638 173 93 31 124
    Single-Person HHs Growth Share 44% 45% 41% 68% 45%

    View Slide

  10. Change in Households
    by Age, 2010-2040
    Source: Arthur C. Nelson
    Figures in thousands. Figures may not sum due to rounding. 10
    Metric
    United
    States New Mexico Albuquerque Santa Fe Combined
    Change in Households by Age, 1990-2010
    Household Change 24,951 250 125 24 149
    Change in Households <35 (1,285) 11 11 1 12
    Change in Households 35-64 20,457 166 83 15 98
    Change in Households 65+ 5,779 73 31 8 40
    Households <35 Share -5% 4% 9% 3% 8%
    Households 35-64 Share 82% 66% 66% 63% 66%
    Households 65+ Share 23% 29% 25% 34% 26%
    Change in Households by Age, 2010-2040
    Household Change 35,226 388 231 45 276
    Change in Households <35 5,885 63 41 6 47
    Change in Households 35-64 10,041 119 83 9 92
    Change in Households 65+ 19,300 206 107 30 137
    Households <35 Share 17% 16% 18% 13% 17%
    Households 35-64 Share 29% 31% 36% 21% 33%
    Households 65+ Share 55% 53% 46% 66% 50%

    View Slide

  11. Distribution of Residential Units Built, United States,1989-2009
    Type Volume Total 
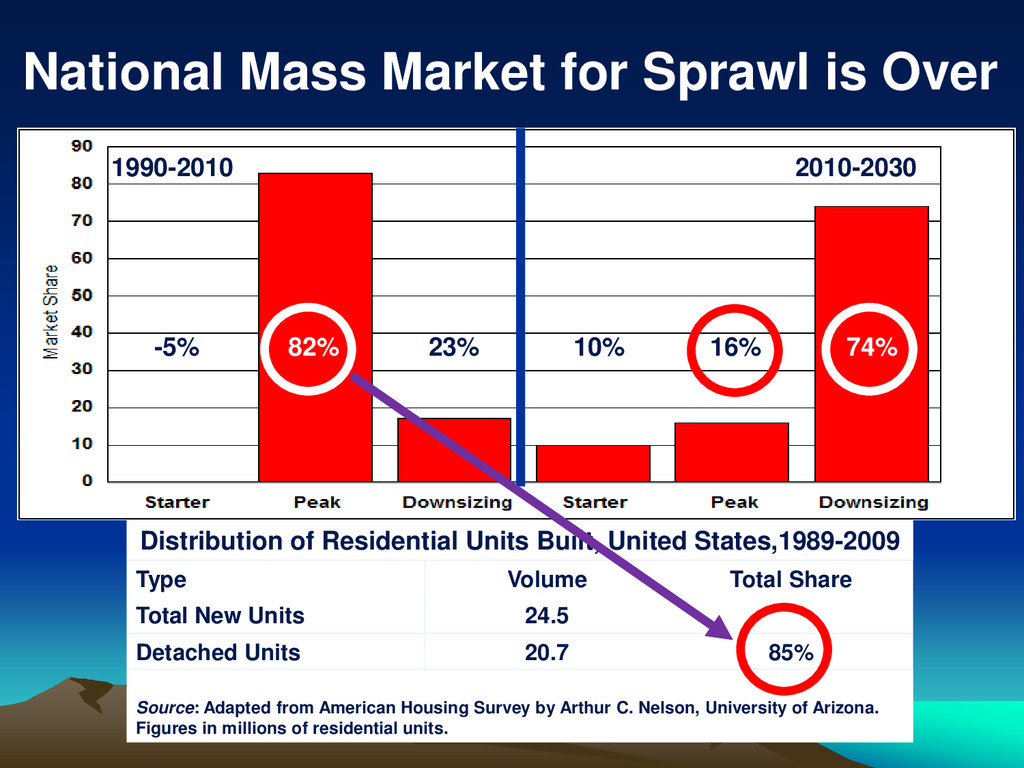
Share
    Total New Units 24.5
    Detached Units 20.7 85%
    Source: Adapted from American Housing Survey by Arthur C. Nelson, University of Arizona.
    Figures in millions of residential units.
    82% 23%
    -5% 10% 16% 74%
    1990-2010 2010-2030
    National Mass Market for Sprawl is Over

    View Slide

  12. Home Ownership Rates
    Nation 1965-2014, 4th Quarter
    Source: Adapted from Census by Arthur C. Nelson, University of Arizona.
    12

    View Slide

  13. US Owner/Renter Change
    2005-2014
    Tenure 2nd Q 2005 2nd Q 
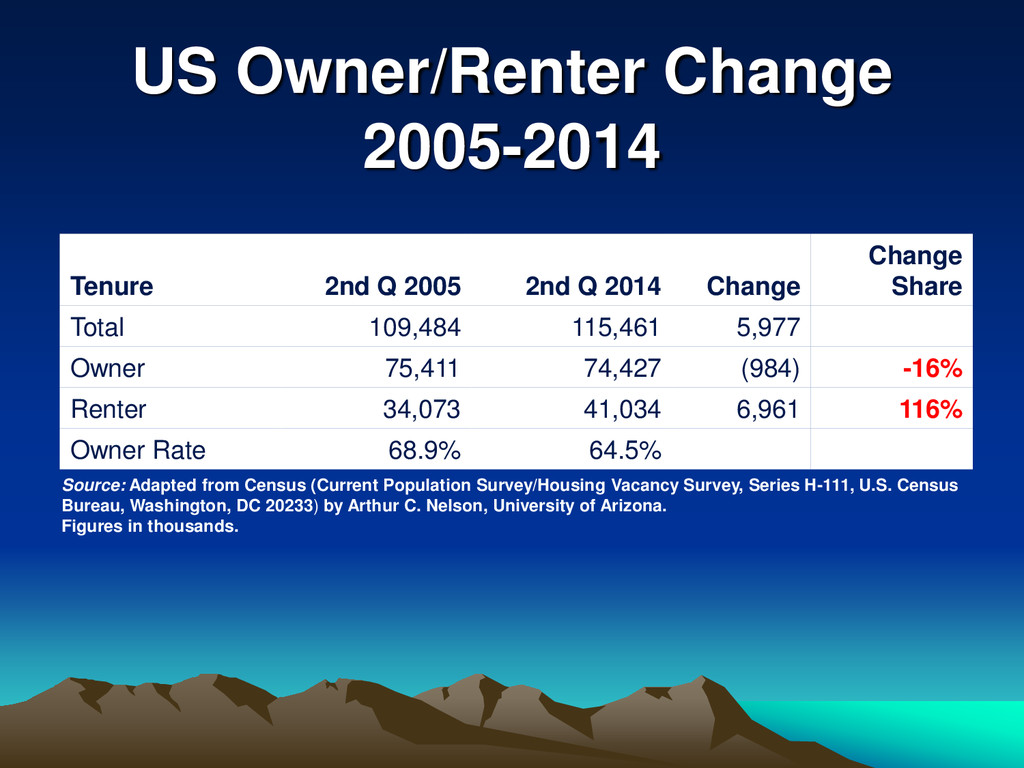
2014 Change
    Change
    Share
    Total 109,484 115,461 5,977
    Owner 75,411 74,427 (984) -16%
    Renter 34,073 41,034 6,961 116%
    Owner Rate 68.9% 64.5%
    Source: Adapted from Census (Current Population Survey/Housing Vacancy Survey, Series H-111, U.S. Census
    Bureau, Washington, DC 20233) by Arthur C. Nelson, University of Arizona.
    Figures in thousands.

    View Slide

  14. Albuquerque is Different
    Metropolitan Area
    2005
    4th Q
    2014
    4th Q
    Point
    Change
    Percent
    Change
    United States 69.0 64.0 -5.0 -7%
    Albuquerque 68.2 68.3 0.1 0%
    Atlanta 70.7 62.9 -7.8 -11%
    Austin 67.0 62.3 -4.7 -7%
    Dallas-Ft. Worth 62.7 56.3 -6.4 -10%
    Denver 69.0 61.3 -7.7 -11%
    El Paso, TX 64.9 66.2 1.3 2%
    Houston 63.2 62.3 -0.9 -1%
    Los Angeles 54.4 47.6 -6.8 -13%
    Phoenix 71.2 61.9 -9.3 -13%
    Portland 68.9 62.3 -6.6 -10%
    Sacramento 61.3 58.2 -3.1 -5%
    Salt Lake City 71.2 68.3 -2.9 -4%
    San Antonio 67.1 66.9 -0.2 -0%
    Seattle 64.8 58.0 -6.8 -10%
    Tucson 65.5 57.6 -7.9 -12%
    Source: Adapted from US Census by Arthur C. Nelson (https://www.census.gov/housing/hvs/data/rates.html)
    Figures are percentages.

    View Slide

  15. Conservative Ownership
    Change, 2010-2040
    Source: Arthur C. Nelson, University of Arizona
    Figures in thousands.
    15
    Metric
    United
    States New Mexico Albuquerque Santa Fe Combined
    Baseline, 2010
    Owners 76,133 544 240 43 283
    Renters 40,812 250 117 19 136
    Ownership Rate 65.1% 68.5% 67.2% 69.2% 67.5%
    Renter Rate 34.9% 31.5% 32.8% 30.8% 32.5%
    Tenure Analysis 2010-2040
    Homeowners 94,013 798 388 73 461
    Renters 58,158 384 200 34 234
    Ownership Rate 61.8% 67.5% 65.9% 68.6% 66.4%
    Renter Rate 38.2% 32.5% 34.1% 31.4% 33.6%
    Change in Owners 17,880 254 148 30 178
    Change in Renters 17,346 134 83 14 98
    Owner Change Share 51% 65% 64% 68% 65%
    Renter Change Share 49% 35% 36% 32% 35%

    View Slide

  16. Value-Planning for the Future
    Attribute Market
    “New urbanism” community +
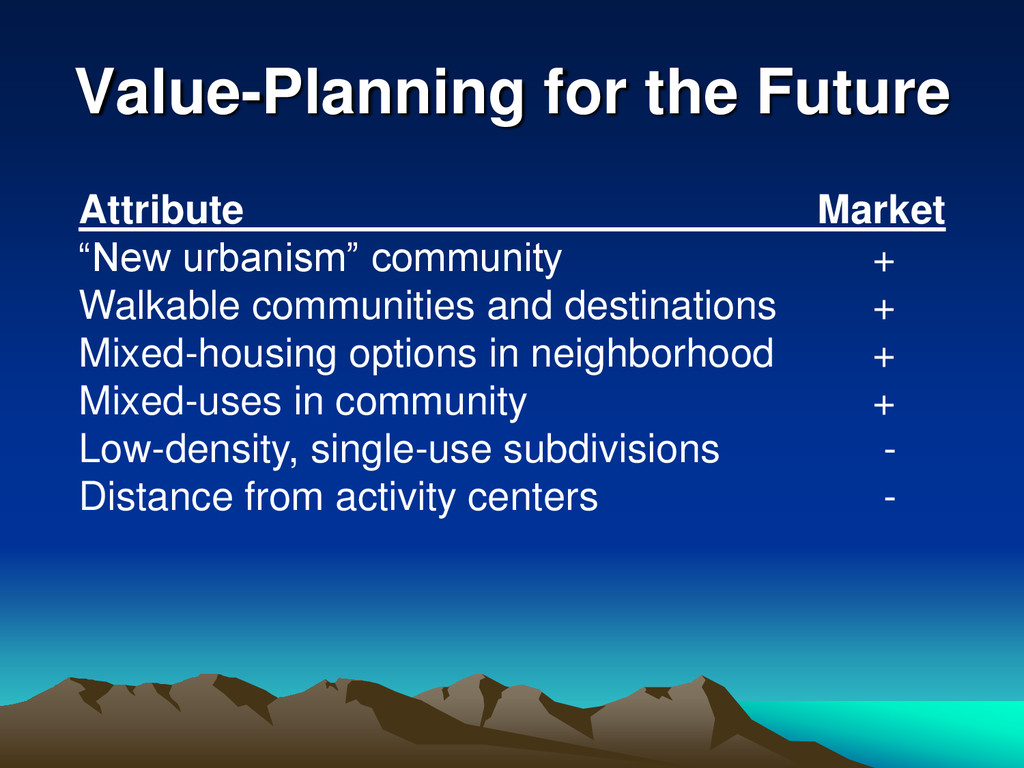
    Walkable communities and destinations +
    Mixed-housing options in neighborhood +
    Mixed-uses in community +
    Low-density, single-use subdivisions -
    Distance from activity centers -

    View Slide

  17. Ewing Land-Use Integration
    Index Elements (14 total)
    • DENSITY (6 elements)
    • MIXED USE (3 elements)
    • CENTERING (3 elements)
    • STREET ACCESSIBILITY (2 elements)

    View Slide

  18. Land-Use Integration
    Index Comparisons
    Metropolitan Area
    Integration
    Index Rank
    New York 203 1
    Denver 107 92
    Colorado Springs 106 98
    Albuquerque 98 126
    Tucson 79 171
    Phoenix 78 173
    Atlanta 41 220

    View Slide

  19. Underwater Mortgages
    Denver

    View Slide

  20. 100% 50% 0%
    Source: http://www.zillow.com/visuals/negative-equity/#13/35.0810/-106.6434
    Underwater Mortgages
    Atlanta

    View Slide

  21. Underwater Mortgages
    Colorado Springs

    View Slide

  22. Underwater Mortgages
    Tucson

    View Slide

  23. 100% 50% 0%
    Source: http://www.zillow.com/visuals/negative-equity/#13/35.0810/-106.6434
    Underwater Mortgages
    Albuquerque

    View Slide

  24. Support for/Want to Live in
    Mixed-Use/Mixed-Housing Walkable Community
    Demographic Group
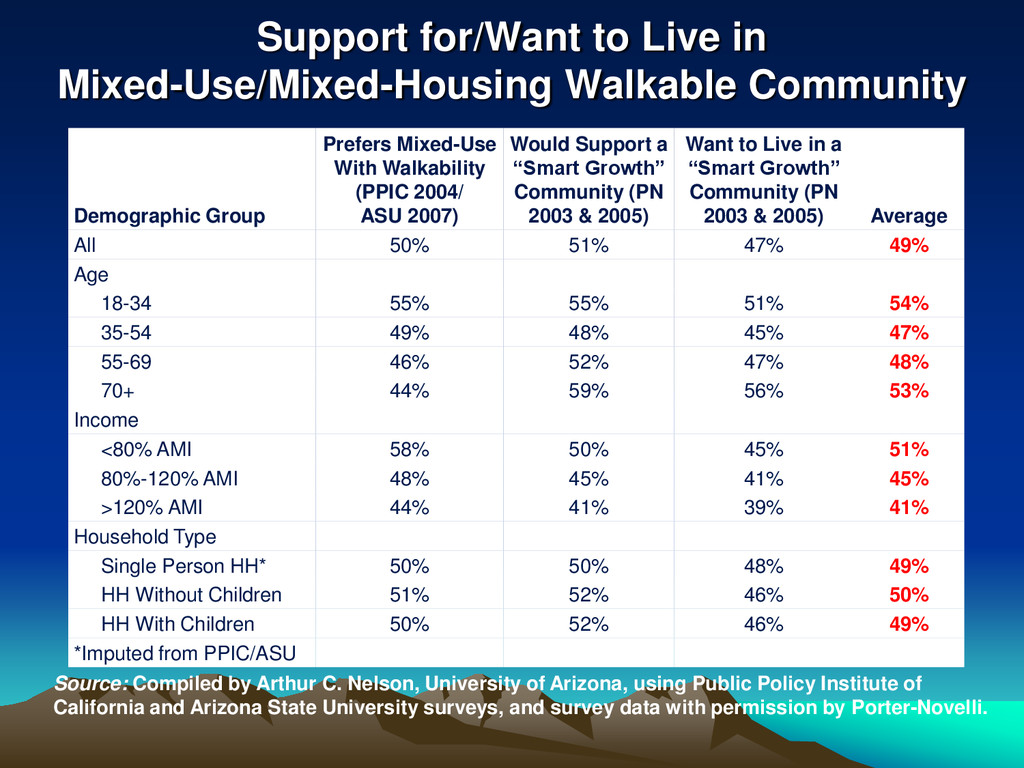
    Prefers Mixed-Use
    With Walkability
    (PPIC 2004/
    ASU 2007)
    Would Support a
    “Smart Growth”
    Community (PN
    2003 & 2005)
    Want to Live in a
    “Smart Growth”
    Community (PN
    2003 & 2005) Average
    All 50% 51% 47% 49%
    Age
    18-34 55% 55% 51% 54%
    35-54 49% 48% 45% 47%
    55-69 46% 52% 47% 48%
    70+ 44% 59% 56% 53%
    Income
    <80% AMI 58% 50% 45% 51%
    80%-120% AMI 48% 45% 41% 45%
    >120% AMI 44% 41% 39% 41%
    Household Type
    Single Person HH* 50% 50% 48% 49%
    HH Without Children 51% 52% 46% 50%
    HH With Children 50% 52% 46% 49%
    *Imputed from PPIC/ASU
    Source: Compiled by Arthur C. Nelson, University of Arizona, using Public Policy Institute of
    California and Arizona State University surveys, and survey data with permission by Porter-Novelli.

    View Slide

  25. The Unmet Demand for Walking
    and Biking to Work and Errands
    How important is it for you to … Demand Observed
    be able To Walk or Bike to Work? 23% 4%
    be able To Walk or Bike to Errands? 22% 10%
    Source: Compiled by permission from Porter-Novelli and reported in Arthur C. Nelson et al. “The
    Tragedy of the Unmet Demand for Walking and Biking,” The Urban Lawyer (2013).

    View Slide

  26. Walk/Bike Trends within
    1 mile, 1995-2009
    Year
    Walk/Bike to
    Work 
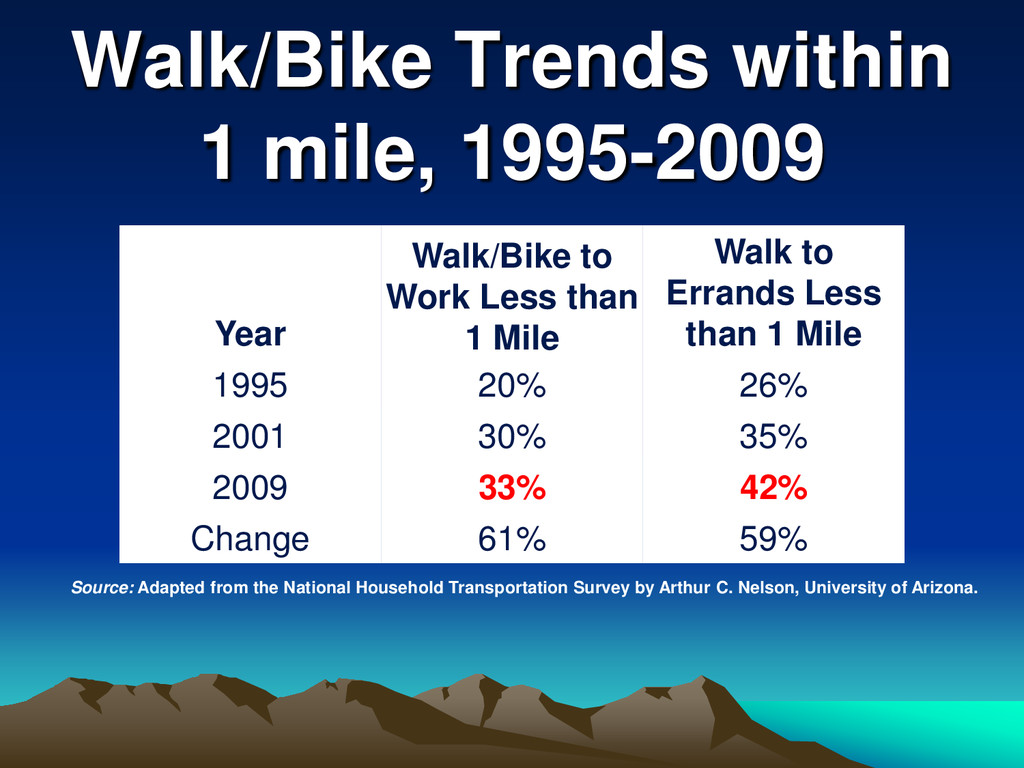
Less than
    1 Mile
    Walk to
    Errands Less
    than 1 Mile
    1995 20% 26%
    2001 30% 35%
    2009 33% 42%
    Change 61% 59%
    Source: Adapted from the National Household Transportation Survey by Arthur C. Nelson, University of Arizona.

    View Slide

  27. Unmet Demand?
    Up to a quarter of people want to 
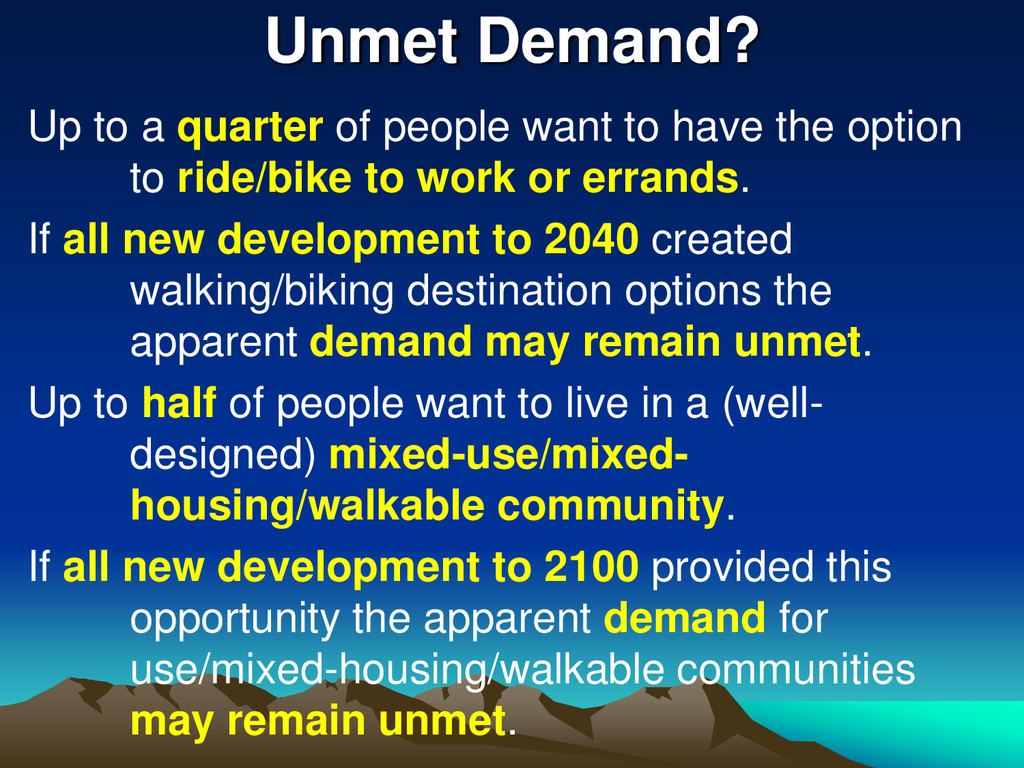
have the option
    to ride/bike to work or errands.
    If all new development to 2040 created
    walking/biking destination options the
    apparent demand may remain unmet.
    Up to half of people want to live in a (well-
    designed) mixed-use/mixed-
    housing/walkable community.
    If all new development to 2100 provided this
    opportunity the apparent demand for
    use/mixed-housing/walkable communities
    may remain unmet.

    View Slide

  28. Albuquerque Job Growth
    2010-2040
    Source: Adapted from Woods & Poole Economics by Arthur C. Nelson, University of Arizona.
    Figures in thousands.
    28
    Sector 2010 2040
    Change
    2010-2040
    Percent
    Change
    2010-2040
    Share of
    Change
    2010-2040
    Industrial 48 66 18 37% 5%
    Office/Services 242 415 172 71% 50%
    Retail/Lodging/Food 89 152 63 70% 18%
    Institutional 76 171 95 125% 27%
    Total 456 804 348 76%

    View Slide

  29. The New Promised Land?
    29

    View Slide

  30. Tear Up a Parking Lot,
    Rebuild Paradise
    Large, flat and 
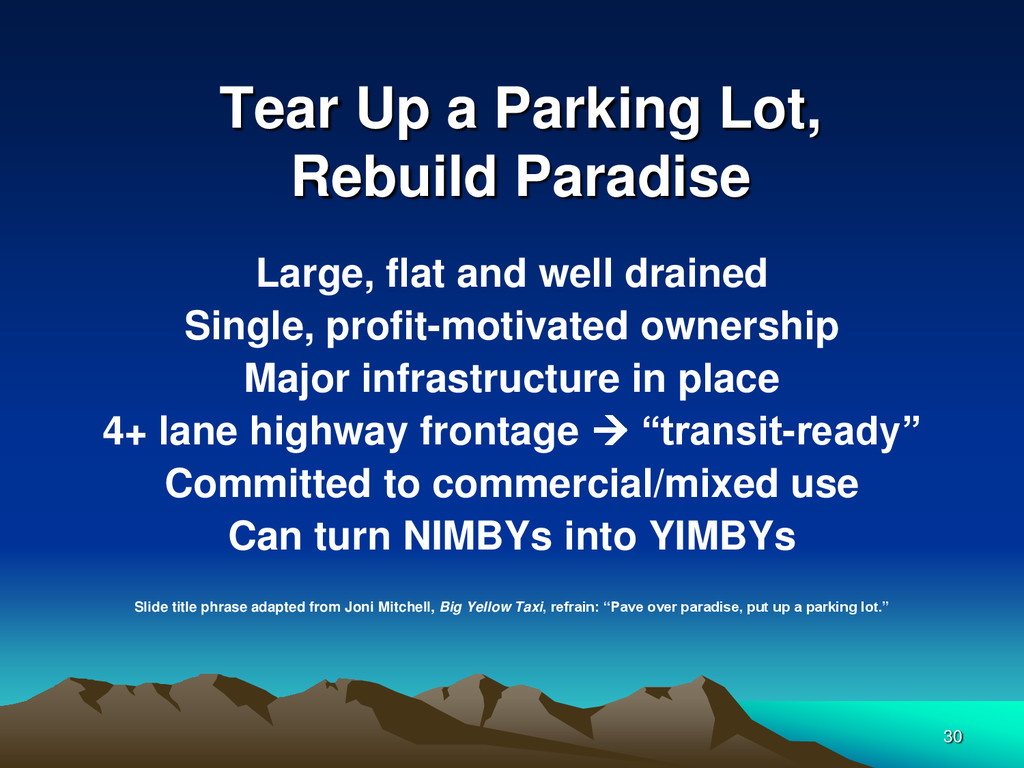
well drained
    Single, profit-motivated ownership
    Major infrastructure in place
    4+ lane highway frontage  “transit-ready”
    Committed to commercial/mixed use
    Can turn NIMBYs into YIMBYs
    Slide title phrase adapted from Joni Mitchell, Big Yellow Taxi, refrain: “Pave over paradise, put up a parking lot.”
    30

    View Slide

  31. Life-Span of Building Function
    Retail
    Office
    Warehouse
    Education
    Nonres.
    Homes
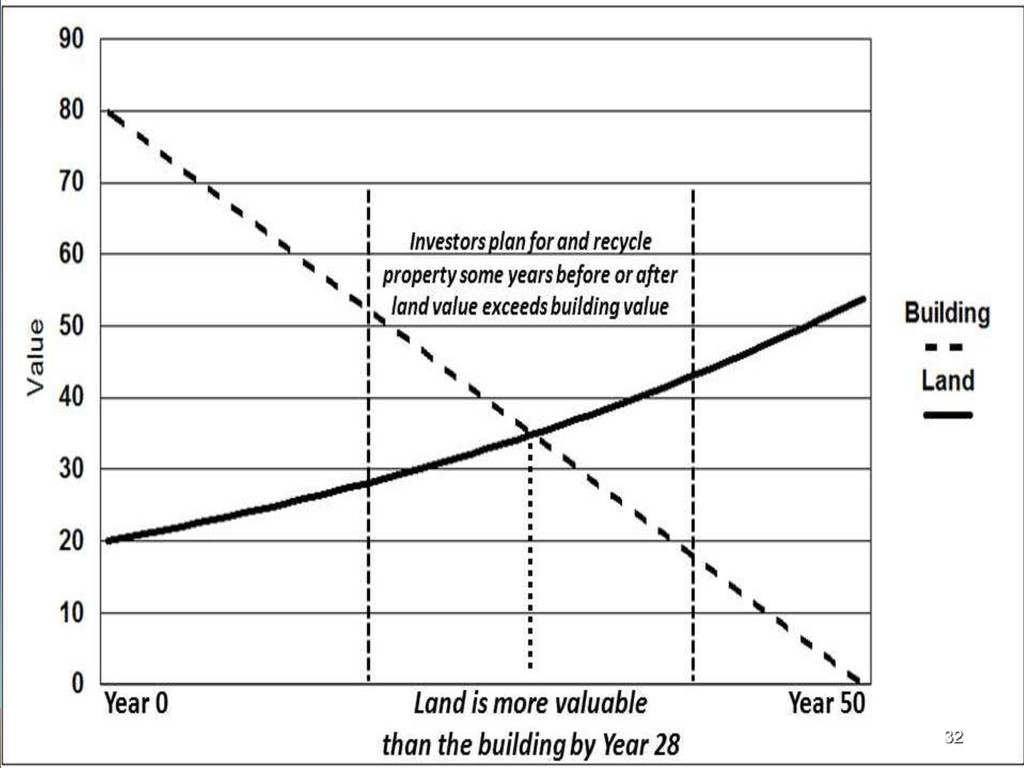
    0
    50
    100
    150
    200
    Years
    Life-Span of Building
    Source: Arthur C. Nelson, Presidential Professor & Director of
    Metropolitan Research, University of Utah, based on DoE Commercial
    Buildings Energy Consumption Survey.
    31

    View Slide

  32. 32

    View Slide

  33. 33

    View Slide

  34. Commercial Space per Capita
    2003-2012
    Metric 2003 2012 Change Income
    Population (thousands) 290,108 314,659 8%
    Total Square Feet per Capita 287.6 315.5 10%
    Education 34.0 38.9 14%
    Food Sales (restaurants) 4.3 4.0 -8% -7%
    Food Service 5.7 5.8 1%
    Health Care 10.9 13.2 21%
    Inpatient 6.6 7.5 15%
    Outpatient 4.3 5.7 31%
    Lodging 17.6 18.5 5%
    Mercantile 38.6 36.0 -7% -7%
    Retail (Other Than Mall) 14.9 17.3 16%
    Enclosed and Strip Malls 23.7 18.7 -21%
    Office 42.1 50.7 20%
    Public Assembly 13.6 17.7 30%
    Public Order and Safety 3.8 4.6 22%
    Religious Worship 12.9 14.5 12%
    Service 14.0 14.7 5%
    Warehouse and Storage 34.7 41.4 19%
    Other 6.0 6.4 6%
    Sources: Population from Census; space derived from CBECS, income change in 2012$ derived from BEA

    View Slide

  35. Albuquerque Nonresidential
    Development 2010-2040
    Source: Arthur C. Nelson
    Figures in 
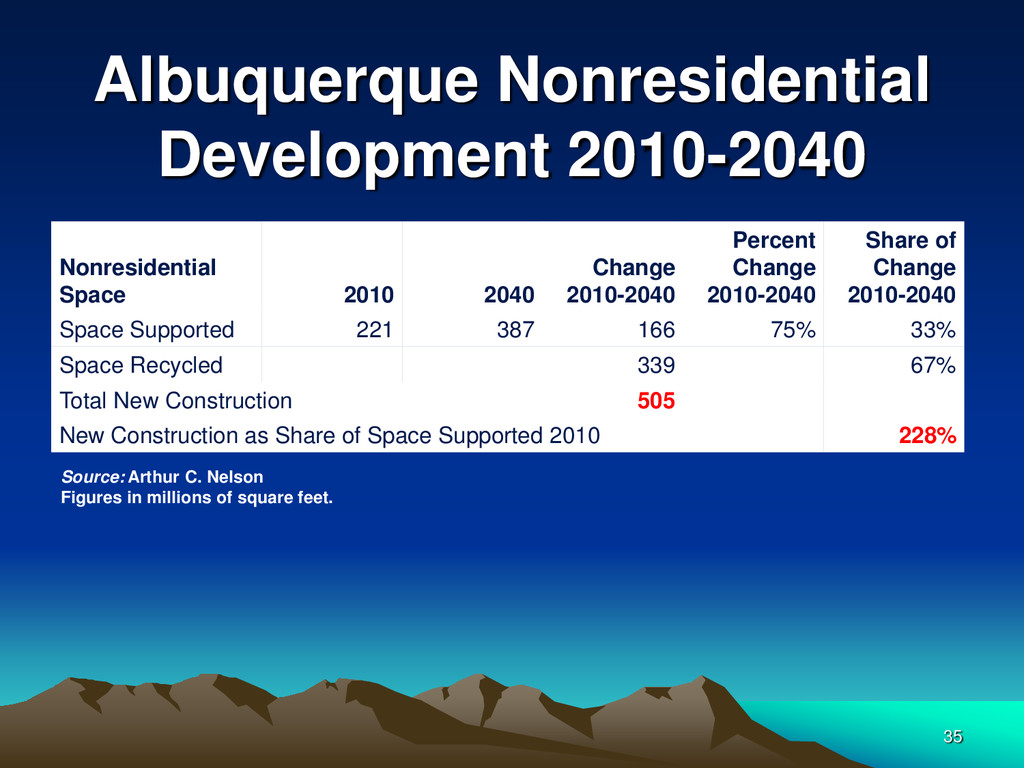
millions of square feet.
    35
    Nonresidential
    Space 2010 2040
    Change
    2010-2040
    Percent
    Change
    2010-2040
    Share of
    Change
    2010-2040
    Space Supported 221 387 166 75% 33%
    Space Recycled 339 67%
    Total New Construction 505
    New Construction as Share of Space Supported 2010 228%

    View Slide

  36. Ewing Land-Use Integration
    Index Elements (14 total)
    • DENSITY (6 elements)
    • MIXED USE (3 elements)
    • CENTERING (3 elements)
    • STREET ACCESSIBILITY (2 elements)

    View Slide

  37. Land Use Integration
    Improves Employment
    A 10% increase in Land-Use 
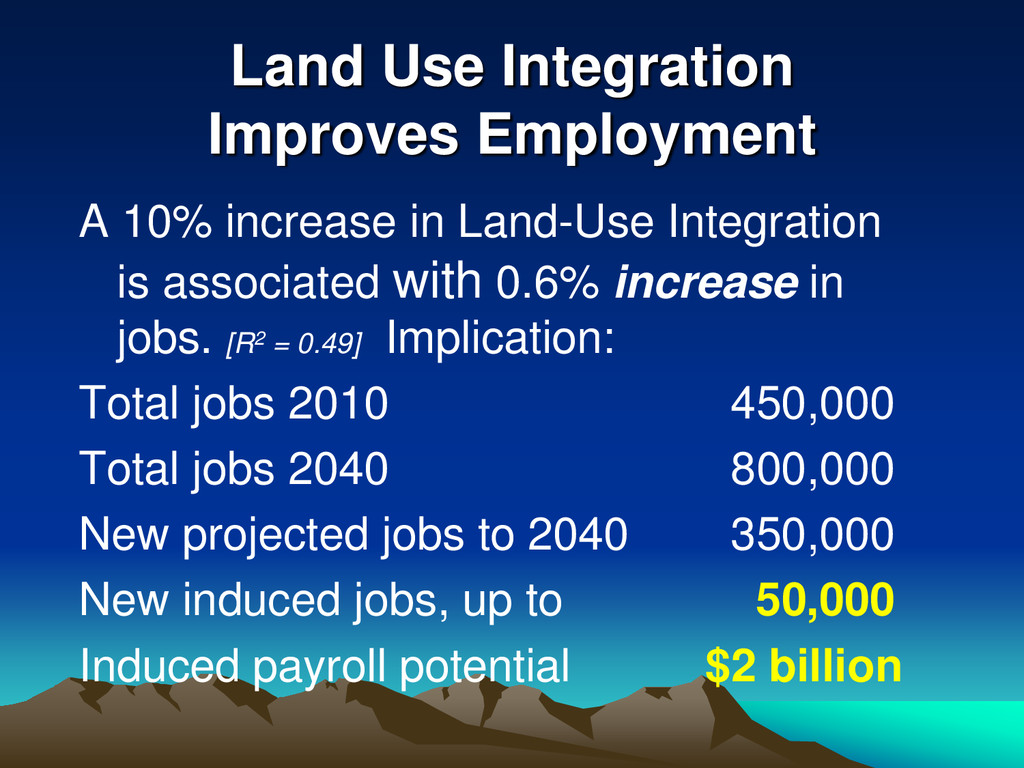
Integration
    is associated with 0.6% increase in
    jobs. [R2 = 0.49] Implication:
    Total jobs 2010 450,000
    Total jobs 2040 800,000
    New projected jobs to 2040 350,000
    New induced jobs, up to 50,000
    Induced payroll potential $2 billion

    View Slide

  38. Observations to 2040
    More than 80% of growth will be New Majority.
    About the equivalent of 40% of growth will be 65+.
    More than 80% of HH growth will be without children.
    More than 40% of HH growth will be single persons.
    About a 1/3rd of HH growth will be peak housing demand (35-64)
    down from 2/3rd during 1990-2010.
    It may be difficult to meet the market demand for mixed-use/mixed-
    housing/walkable communities to 2040 or even 2100.
    About 500M nonresidential square feet built or more than double all
    space existing in 2010.
    2/3rd of nonresidential development will be redevelopment.
    With 2010 FAR @ ~0.20, all new nonresidential demand can be
    met on existing parking lots and FAR would be ~0.40. Add
    half of all new attached and FAR would rise to ~0.60.
    $150 billion in total development, redevelopment and facilities.
    38

    View Slide

  39. Albuquerque/Bernalillo
    County Plan Update
    Comp Plan Update Goals
    • Update 
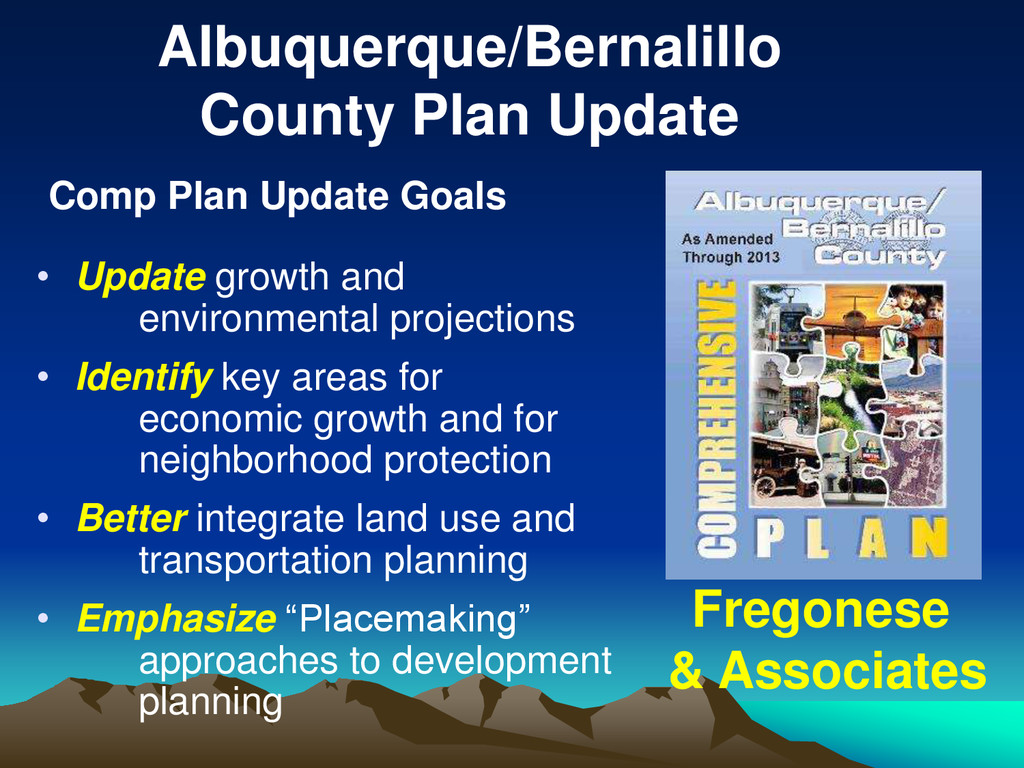
growth and
    environmental projections
    • Identify key areas for
    economic growth and for
    neighborhood protection
    • Better integrate land use and
    transportation planning
    • Emphasize “Placemaking”
    approaches to development
    planning
    Fregonese
    & Associates

    View Slide

  40. Do What You Do Best
    Engage in the process
    To shape the future

    View Slide

  41. `
    http://i.huffpost.com/gen/1470163/images/o-ALBUQUERQUE-SKYLINE-facebook.jpg
    THANK YOU

    View Slide