Upgrade to Pro — share decks privately, control downloads, hide ads and more …

Design Thinking and the End of Competitive Advantage

Ron Kersic
September 20, 2016

Design Thinking and the End of Competitive Advantage

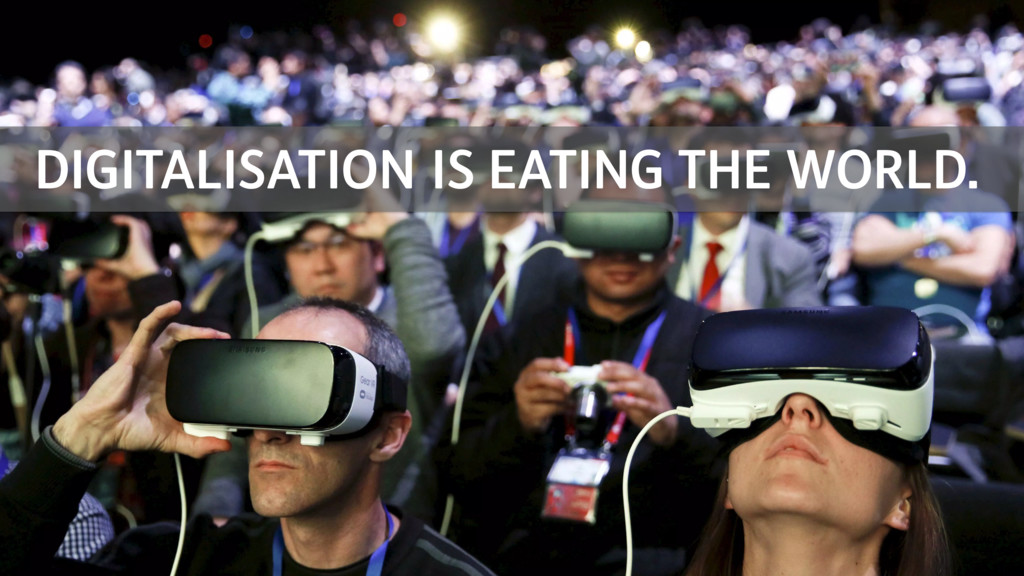
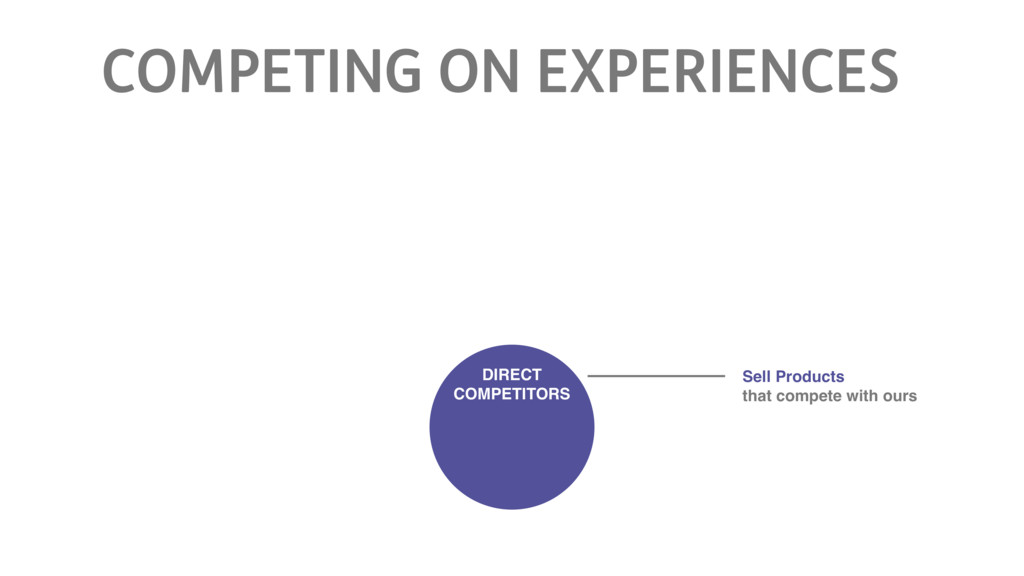
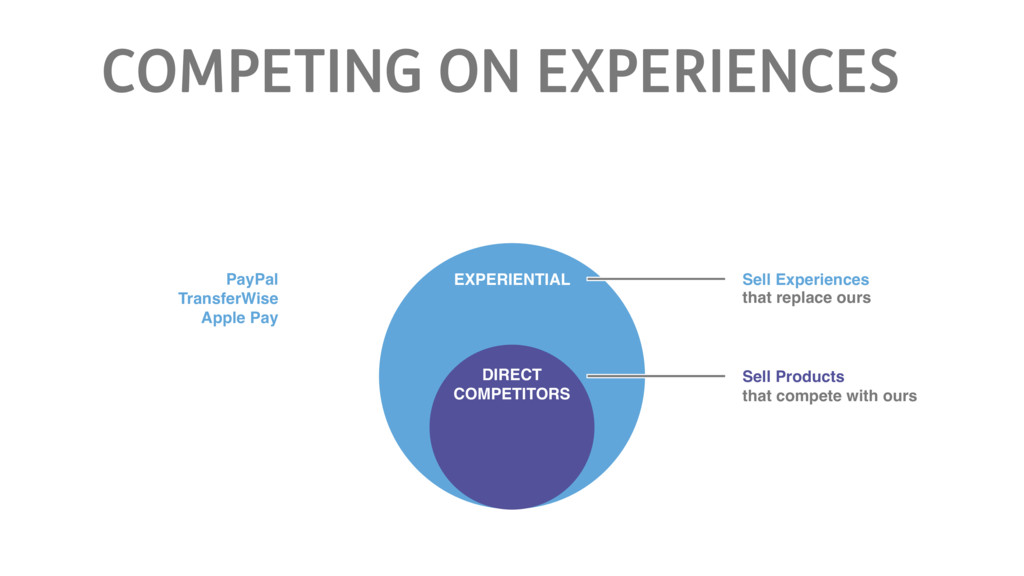
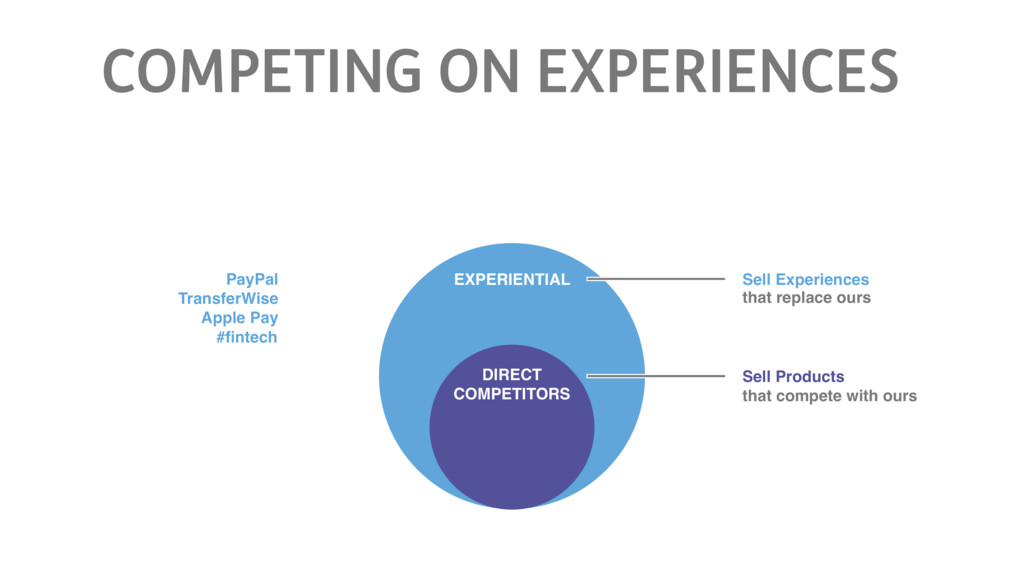
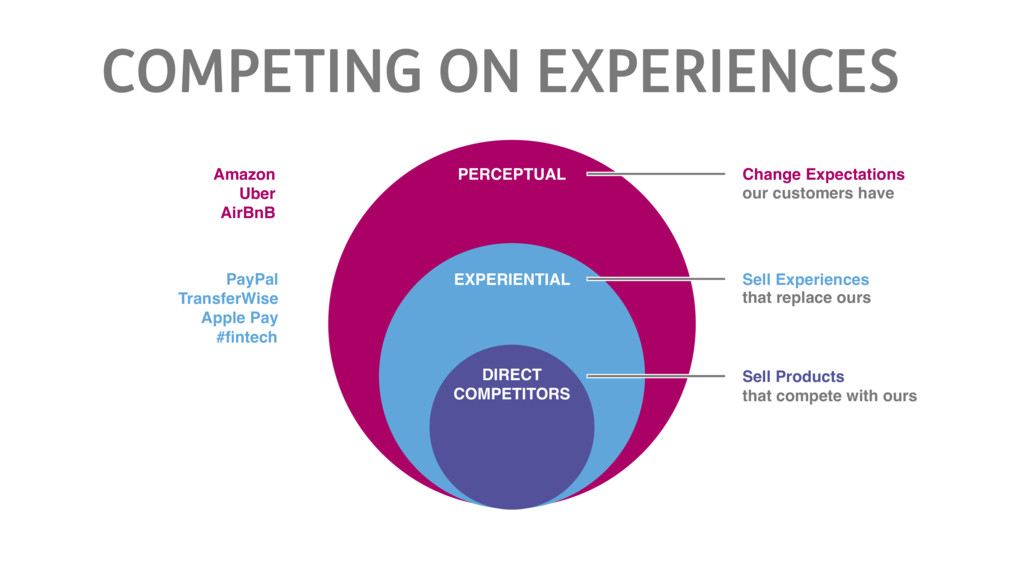
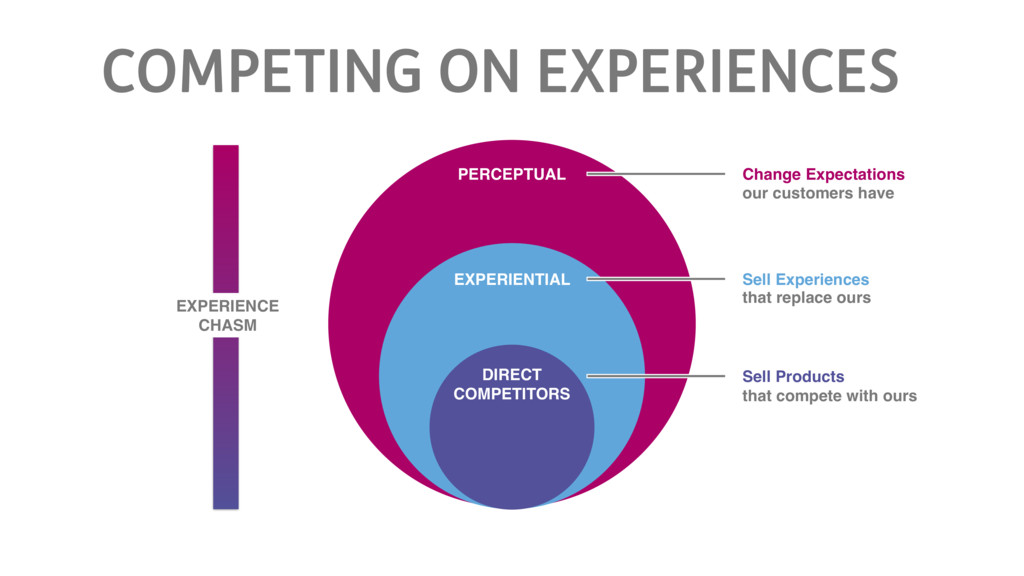
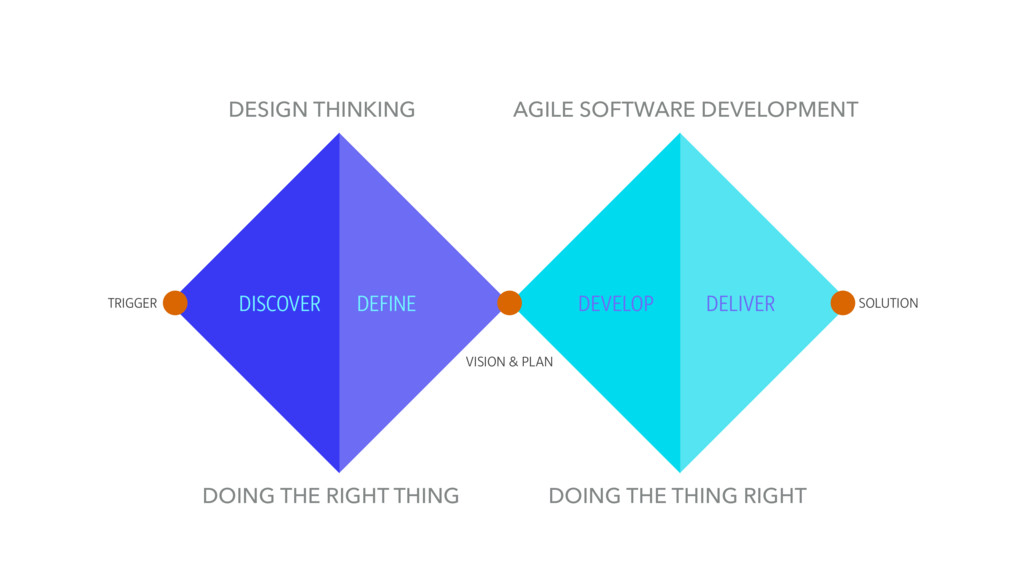
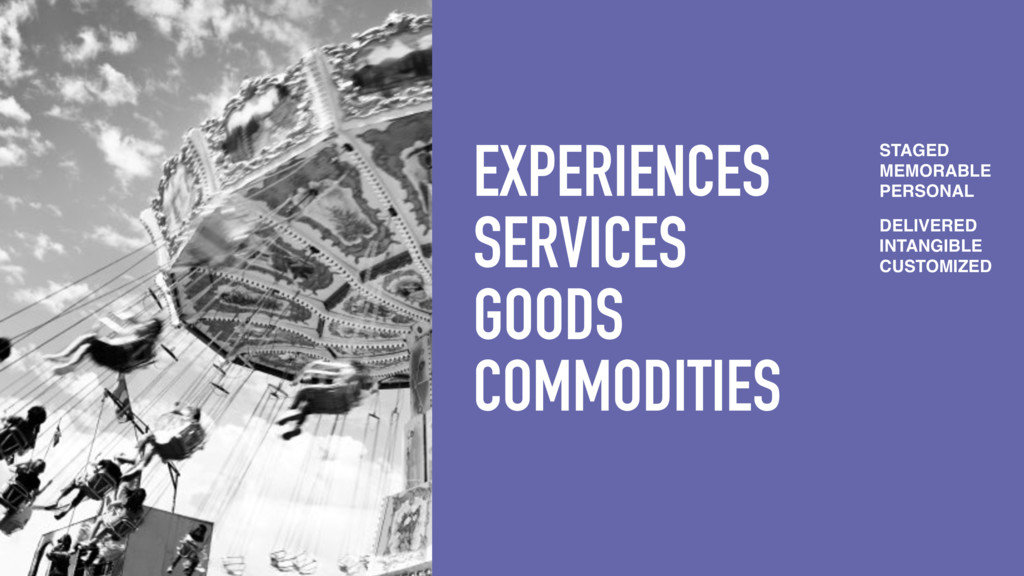
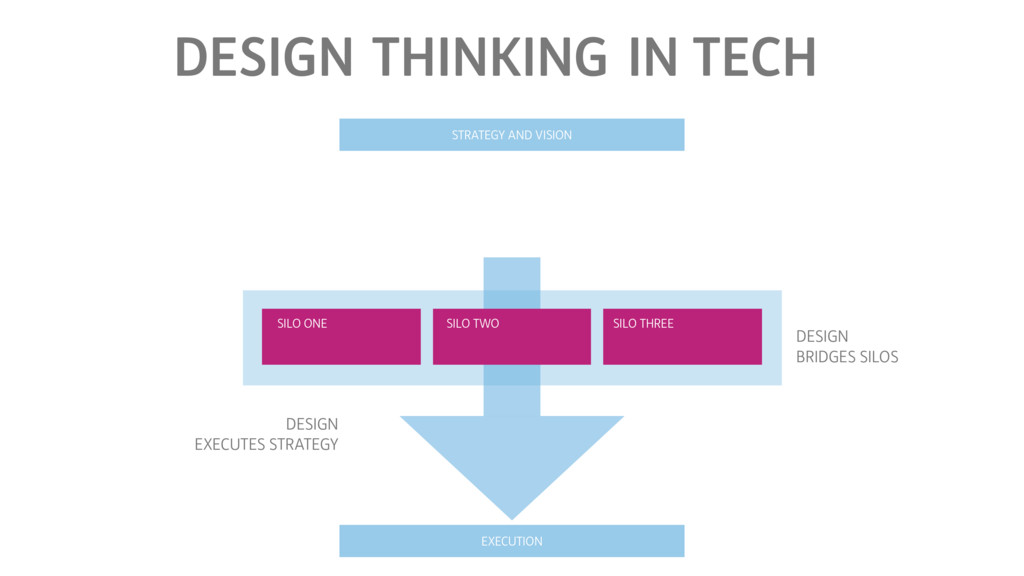
Even the most technology corporations are no longer in the business of just building software. We are increasingly moving into a world of enabling efficient social and business interactions, merely mediated by software. Building superior technology will not determine future business success. Instead, leveraging often commoditized technology to orchestrate connected customers toward new and efficient value-creating interactions will hold the key to the business models of the future. We already use many practices, tools and principles that balance human, commercial and technical realities in solving problems. Design thinking will help bridging the differences in scope, motivation and application of these design and development practices. This will provide for a shared context for human-centered design and technology professionals alike. In the end, holistic experiences can only be staged by a holistic organizations.

Ron Kersic

September 20, 2016
Tweet

More Decks by Ron Kersic

Other Decks in Design

Transcript

  1. Published 2016 by 0xD in Amsterdam. Brand Category Brand Value

    2015 $M Brand Contribution Brand Value % change 2015 vs 2014 Rank change 1 Technology 246,992 4 67% 1 2 Technology 173,652 4 9% -1 3 Technology 115,500 4 28% 1 4 Technology 93,987 4 -13% -1 5 Payments 91,962 4 16% 2 6 Telecom Providers 89,492 3 15% 2 7 Telecom Providers 86,009 3 36% 4 8 Soft Drinks 83,841 5 4% -2 9 Fast Food 81,162 4 -5% -4 10 Tobacco 80,352 3 19% -1 11 Technology 76,572 5 43% 3 12 Technology 71,121 4 99% 9 13 Retail 66,375 2 NEW ENTRY 14 Retail 62,292 4 -3% -4 15 Telecom Providers 59,895 4 20% 0 16 Regional Banks 59,310 3 9% -3 TOP 100 MOST VALUABLE GLOBAL BRANDS 2015
  2. Published 2016 by 0xD in Amsterdam. Brand Category Brand Value

    2015 $M Brand Contribution Brand Value % change 2015 vs 2014 Rank change 1 Technology 246,992 4 67% 1 2 Technology 173,652 4 9% -1 3 Technology 115,500 4 28% 1 4 Technology 93,987 4 -13% -1 5 Payments 91,962 4 16% 2 6 Telecom Providers 89,492 3 15% 2 7 Telecom Providers 86,009 3 36% 4 8 Soft Drinks 83,841 5 4% -2 9 Fast Food 81,162 4 -5% -4 10 Tobacco 80,352 3 19% -1 11 Technology 76,572 5 43% 3 12 Technology 71,121 4 99% 9 13 Retail 66,375 2 NEW ENTRY 14 Retail 62,292 4 -3% -4 15 Telecom Providers 59,895 4 20% 0 16 Regional Banks 59,310 3 9% -3 TOP 100 MOST VALUABLE GLOBAL BRANDS 2015
  3. Published 2016 by 0xD in Amsterdam. Brand Category Brand Value

    2015 $M Brand Contribution Brand Value % change 2015 vs 2014 Rank change 1 Technology 246,992 4 67% 1 2 Technology 173,652 4 9% -1 3 Technology 115,500 4 28% 1 4 Technology 93,987 4 -13% -1 5 Payments 91,962 4 16% 2 6 Telecom Providers 89,492 3 15% 2 7 Telecom Providers 86,009 3 36% 4 8 Soft Drinks 83,841 5 4% -2 9 Fast Food 81,162 4 -5% -4 10 Tobacco 80,352 3 19% -1 11 Technology 76,572 5 43% 3 12 Technology 71,121 4 99% 9 13 Retail 66,375 2 NEW ENTRY 14 Retail 62,292 4 -3% -4 15 Telecom Providers 59,895 4 20% 0 16 Regional Banks 59,310 3 9% -3 TOP 100 MOST VALUABLE GLOBAL BRANDS 2015
  4. Published 2016 by 0xD in Amsterdam. Brand Category Brand Value

    2015 $M Brand Contribution Brand Value % change 2015 vs 2014 Rank change 1 Technology 246,992 4 67% 1 2 Technology 173,652 4 9% -1 3 Technology 115,500 4 28% 1 4 Technology 93,987 4 -13% -1 5 Payments 91,962 4 16% 2 6 Telecom Providers 89,492 3 15% 2 7 Telecom Providers 86,009 3 36% 4 8 Soft Drinks 83,841 5 4% -2 9 Fast Food 81,162 4 -5% -4 10 Tobacco 80,352 3 19% -1 11 Technology 76,572 5 43% 3 12 Technology 71,121 4 99% 9 13 Retail 66,375 2 NEW ENTRY 14 Retail 62,292 4 -3% -4 15 Telecom Providers 59,895 4 20% 0 16 Regional Banks 59,310 3 9% -3 TOP 100 MOST VALUABLE GLOBAL BRANDS 2015 Technology Technology Technology
  5. Published 2016 by 0xD in Amsterdam. MARCH 10, 2000 AUG.

    1, 2006 Microsoft $507B Cisco $452 Intel $402 Vodafone $371 GE $432 Exxon $413B GE $336 Gazprom $244 Citigroup $240 Microsoft $245 Exxon $392B Apple $368 ICBC $240 Shell $229 PetroChina $290 Apple $571B Alphabet $540 Amazon $364 Facebook $357 Microsoft $441 AUG. 1, 2011 AUG. 1, 2016 1 2 3 4 5 March 10 was the Nasdaq peak during the dot-com bubble. Market caps are not adjusted for inflation.
  6. EXPERIENTIAL DIRECT COMPETITORS Sell Products that compete with ours Sell

    Experiences that replace ours PayPal TransferWise Apple Pay COMPETING ON EXPERIENCES
  7. EXPERIENTIAL DIRECT COMPETITORS Sell Products that compete with ours Sell

    Experiences that replace ours PayPal TransferWise Apple Pay #fintech COMPETING ON EXPERIENCES
  8. EXPERIENTIAL DIRECT COMPETITORS Sell Products that compete with ours Sell

    Experiences that replace ours PayPal TransferWise Apple Pay #fintech COMPETING ON EXPERIENCES
  9. PERCEPTUAL EXPERIENTIAL DIRECT COMPETITORS Sell Products that compete with ours

    Sell Experiences that replace ours Change Expectations our customers have PayPal TransferWise Apple Pay Amazon Uber AirBnB #fintech COMPETING ON EXPERIENCES
  10. PERCEPTUAL EXPERIENTIAL DIRECT COMPETITORS Sell Products that compete with ours

    Sell Experiences that replace ours Change Expectations our customers have EXPERIENCE CHASM COMPETING ON EXPERIENCES
  11. EXPERIENCE CHASM A cultural shift of everything competing with everything

    and expectations transcending traditional boundaries. COMPETING ON EXPERIENCES
  12. A B C 1.Shape the definition of ‘value’ 2.Deliver on

    that promise at a global scale 3.Raise the bar on the expectation of ‘value’ 4.Repeat ARENAS. NOT INDUSTRIES
  13. A B C 1.Shape the definition of ‘value’ 2.Deliver on

    that promise at a global scale 3.Raise the bar on the expectation of ‘value’ 4.Repeat ARENAS. NOT INDUSTRIES
  14. A B C 1.Shape the definition of ‘value’ 2.Deliver on

    that promise at a global scale 3.Raise the bar on the expectation of ‘value’ 4.Repeat 43M
  15. A B C 1.Shape the definition of ‘value’ 2.Deliver on

    that promise at a global scale 3.Raise the bar on the expectation of ‘value’ ARENAS. NOT INDUSTRIES
  16. A B C Platform at Scale Standardised, commoditised Low variety,

    high reusability https://content.ing.io/ ARENAS. NOT INDUSTRIES
  17. A B C 1.Shape the definition of ‘value’ 2.Deliver on

    that promise at a global scale 3.Raise the bar on the expectation of ‘value’ 4.Repeat B ARENAS. NOT INDUSTRIES Business ‘R&D’ High variety, low reusability
  18. DISCOVER DEFINE DEVELOP DELIVER DOING THE RIGHT THING DOING THE

    THING RIGHT DESIGN THINKING AGILE SOFTWARE DEVELOPMENT SOLUTION TRIGGER VISION & PLAN
  19. DOING THE RIGHT THING DOING THE THING RIGHT DESIGN THINKING

    AGILE SOFTWARE DEVELOPMENT SOLUTION DISCOVER DEFINE DEVELOP DELIVER TRIGGER VISION & PLAN
  20. STAKEHOLDER MAPS, SERVICE SAFARIS, SHADOWING, CUSTOMER JOURNEYS, CONTEXTUAL INTERVIEWS, THE

    FIVE WHYS, CULTURAL PROBES, MOBILE ETHNOGRAPHY, SERVICE BLUEPRINTS, A DAY IN THE LIFE, EXPECTATION MAPS, PERSONAS, IDEA GENERATION, WHAT IF…, DESIGN SCENARIOS, STORYBOARDS, DESKTOP WALKTHROUGH, SERVICE PROTOTYPES, SERVICE STAGING, CO-CREATION, STORYTELLING, SERVICE ROLE-PLAY, CUSTOMER LIFECYCLE MAPS, BUSINESS MODEL CANVAS, HOW- MIGHT WE QUESTIONS, WHY-HOW LADDER, POWERS OF TEN
  21. STAKEHOLDER MAPS, SERVICE SAFARIS, SHADOWING, CUSTOMER JOURNEYS, CONTEXTUAL INTERVIEWS, THE

    FIVE WHYS, CULTURAL PROBES, MOBILE ETHNOGRAPHY, SERVICE BLUEPRINTS, A DAY IN THE LIFE, EXPECTATION MAPS, PERSONAS, IDEA GENERATION, WHAT IF…, DESIGN SCENARIOS, STORYBOARDS, DESKTOP WALKTHROUGH, SERVICE PROTOTYPES, SERVICE STAGING, CO-CREATION, STORYTELLING, SERVICE ROLE-PLAY, CUSTOMER LIFECYCLE MAPS, BUSINESS MODEL CANVAS, HOW- MIGHT WE QUESTIONS, WHY-HOW LADDER, POWERS OF TEN
  22. Published 2016 by 0xD in Amsterdam. Brand Category Brand Value

    2015 $M Brand Contribution Brand Value % change 2015 vs 2014 Rank change 1 Technology 246,992 4 67% 1 2 Technology 173,652 4 9% -1 3 Technology 115,500 4 28% 1 4 Technology 93,987 4 -13% -1 5 Payments 91,962 4 16% 2 6 Telecom Providers 89,492 3 15% 2 7 Telecom Providers 86,009 3 36% 4 8 Soft Drinks 83,841 5 4% -2 9 Fast Food 81,162 4 -5% -4 10 Tobacco 80,352 3 19% -1 11 Technology 76,572 5 43% 3 12 Technology 71,121 4 99% 9 13 Retail 66,375 2 NEW ENTRY 14 Retail 62,292 4 -3% -4 15 Telecom Providers 59,895 4 20% 0 16 Regional Banks 59,310 3 9% -3 TOP 100 MOST VALUABLE GLOBAL BRANDS 2015 Technology Technology Technology
  23. Published 2016 by 0xD in Amsterdam. Brand Category Brand Value

    2015 $M Brand Contribution Brand Value % change 2015 vs 2014 Rank change 1 Technology 246,992 4 67% 1 2 Technology 173,652 4 9% -1 3 Technology 115,500 4 28% 1 4 Technology 93,987 4 -13% -1 5 Payments 91,962 4 16% 2 6 Telecom Providers 89,492 3 15% 2 7 Telecom Providers 86,009 3 36% 4 8 Soft Drinks 83,841 5 4% -2 9 Fast Food 81,162 4 -5% -4 10 Tobacco 80,352 3 19% -1 11 Technology 76,572 5 43% 3 12 Technology 71,121 4 99% 9 13 Retail 66,375 2 NEW ENTRY 14 Retail 62,292 4 -3% -4 15 Telecom Providers 59,895 4 20% 0 16 Regional Banks 59,310 3 9% -3 TOP 100 MOST VALUABLE GLOBAL BRANDS 2015 Ecosystem Ecosystem Ecosystem Ecosystem Ecosystem Ecosystem Ecosystem Ecosystem Ecosystem
  24. DESIGN THINKING IN TECH DESIGN EXECUTES STRATEGY SILO ONE SILO

    TWO SILO THREE STRATEGY AND VISION EXECUTION DESIGN BRIDGES SILOS
  25. DESIGN THINKING IN TECH DESIGN EXECUTES STRATEGY SILO ONE SILO

    TWO SILO THREE STRATEGY AND VISION EXECUTION DESIGN SHAPES STRATEGY ERIC ROSCAM ABBING