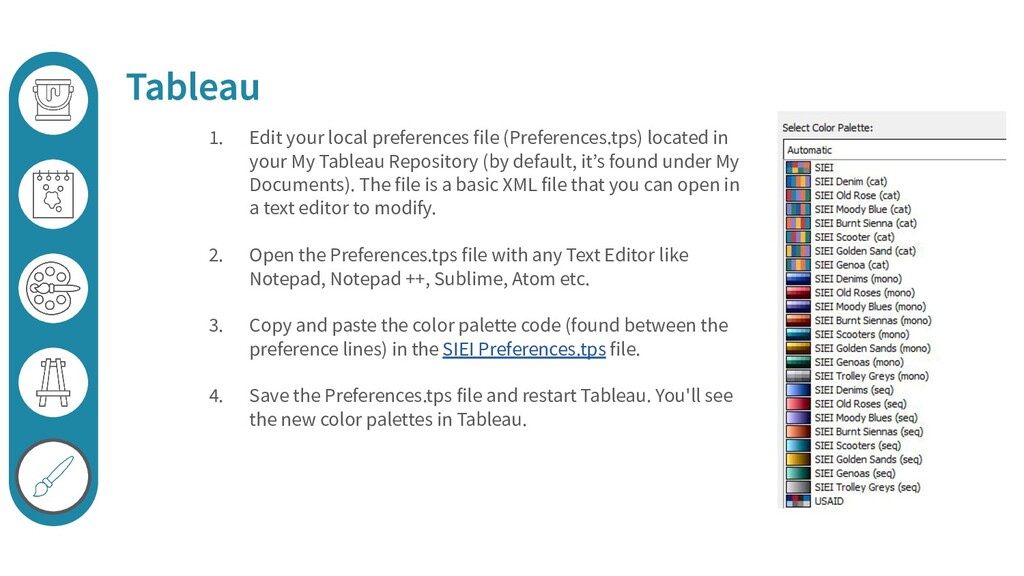
My Tableau Repository (by default, it’s found under My Documents). The file is a basic XML file that you can open in a text editor to modify. 2. Open the Preferences.tps file with any Text Editor like Notepad, Notepad ++, Sublime, Atom etc. 3. Copy and paste the color palette code (found between the preference lines) in the SIEI Preferences.tps file. 4. Save the Preferences.tps file and restart Tableau. You'll see the new color palettes in Tableau.
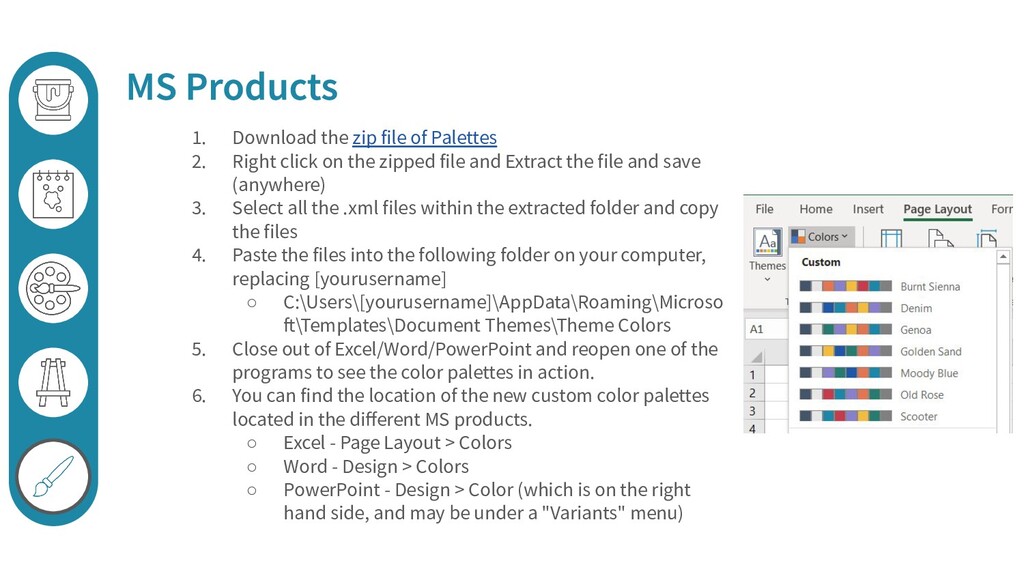
on the zipped file and Extract the file and save (anywhere) 3. Select all the .xml files within the extracted folder and copy the files 4. Paste the files into the following folder on your computer, replacing [yourusername] ◦ C:\Users\[yourusername]\AppData\Roaming\Microso ft\Templates\Document Themes\Theme Colors 5. Close out of Excel/Word/PowerPoint and reopen one of the programs to see the color palettes in action. 6. You can find the location of the new custom color palettes located in the different MS products. ◦ Excel - Page Layout > Colors ◦ Word - Design > Colors ◦ PowerPoint - Design > Color (which is on the right hand side, and may be under a "Variants" menu)
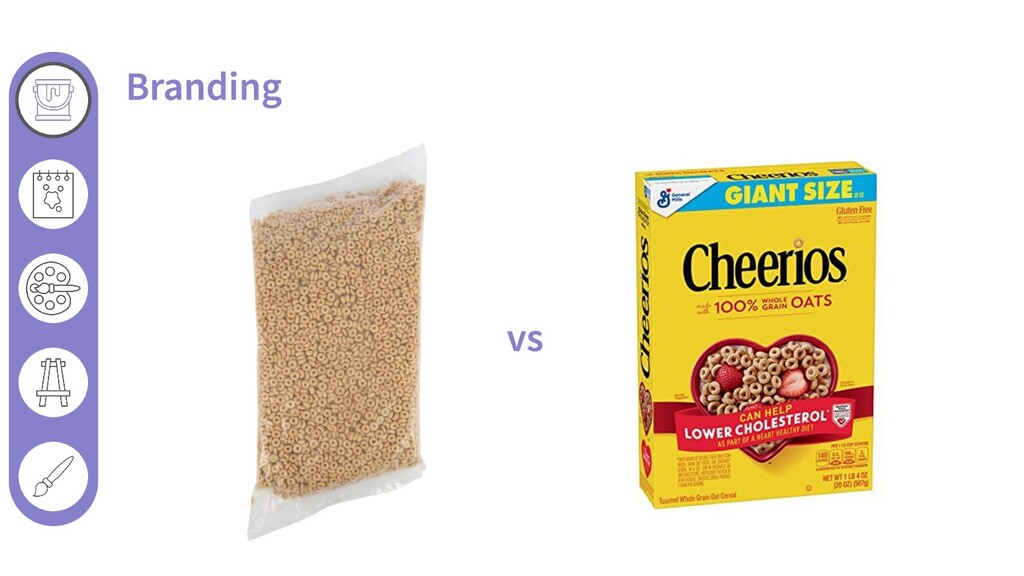
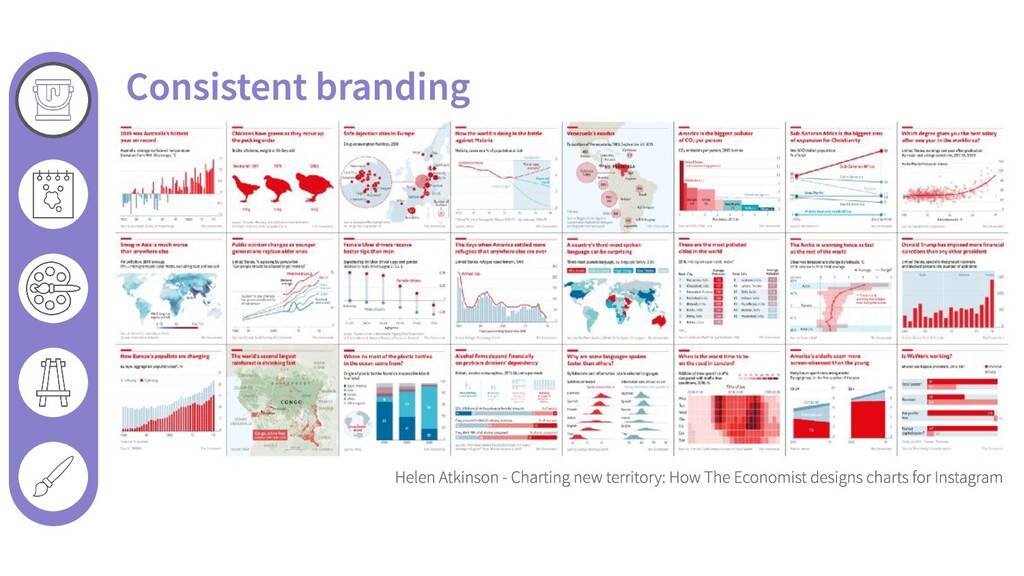
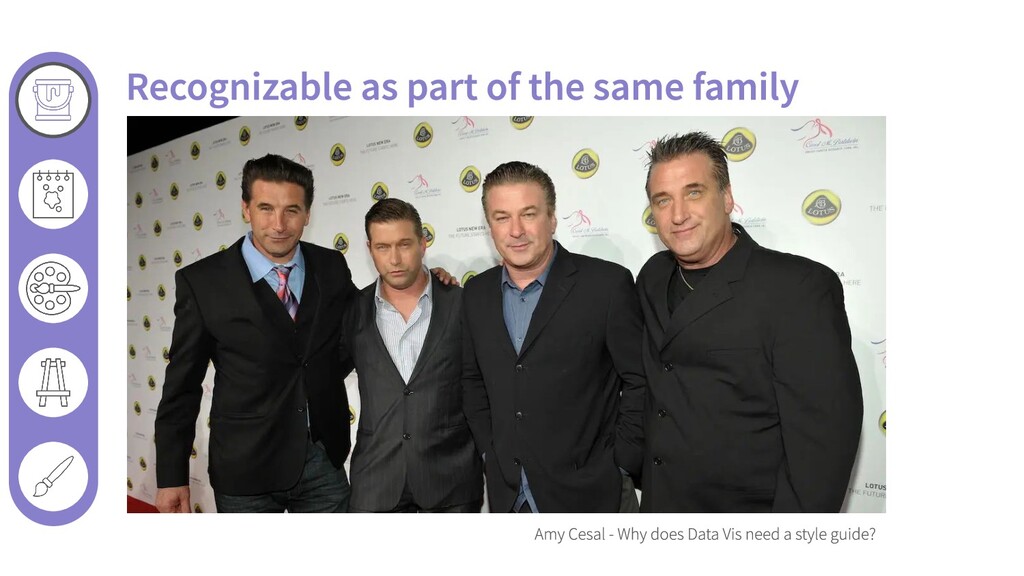
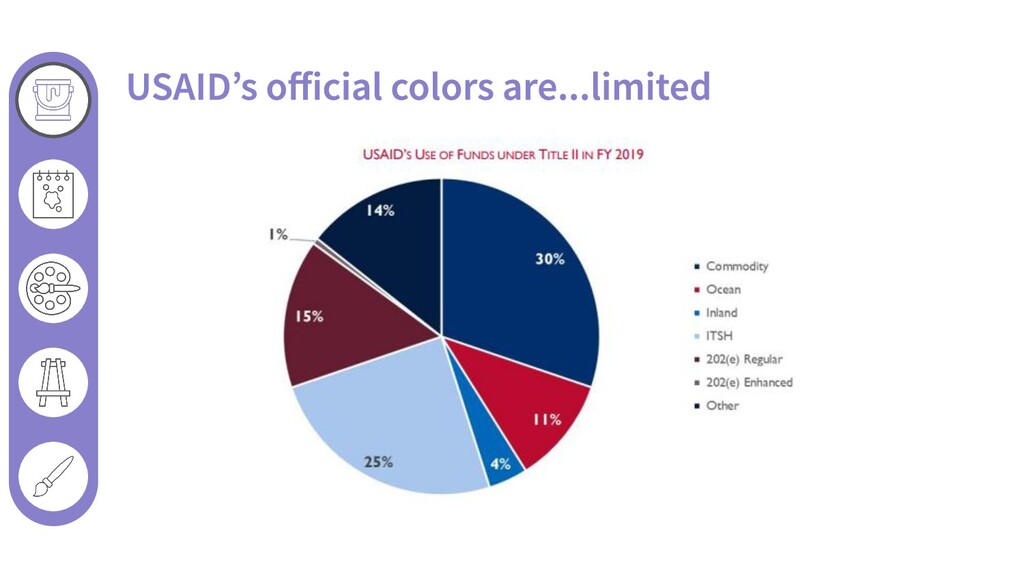
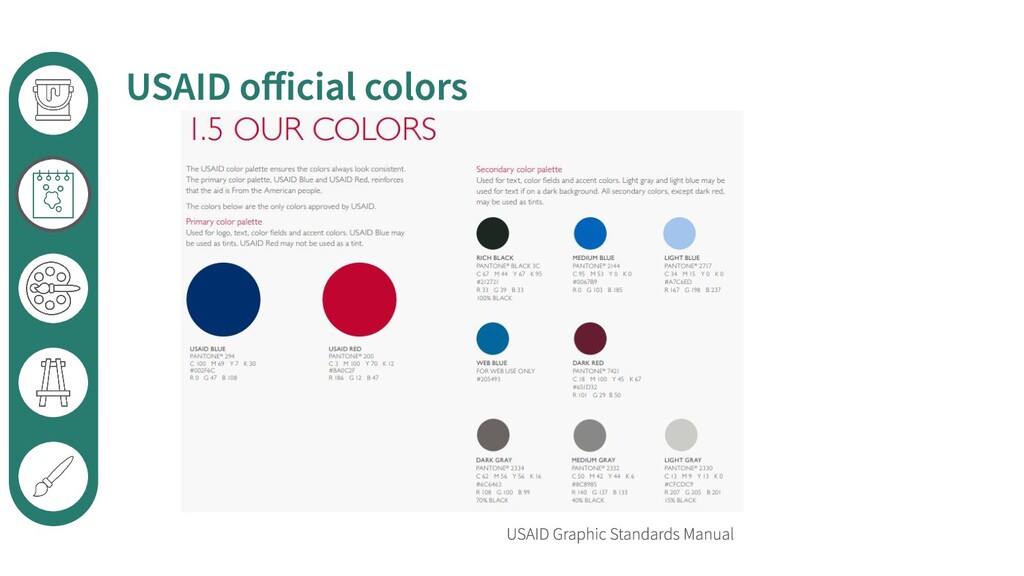
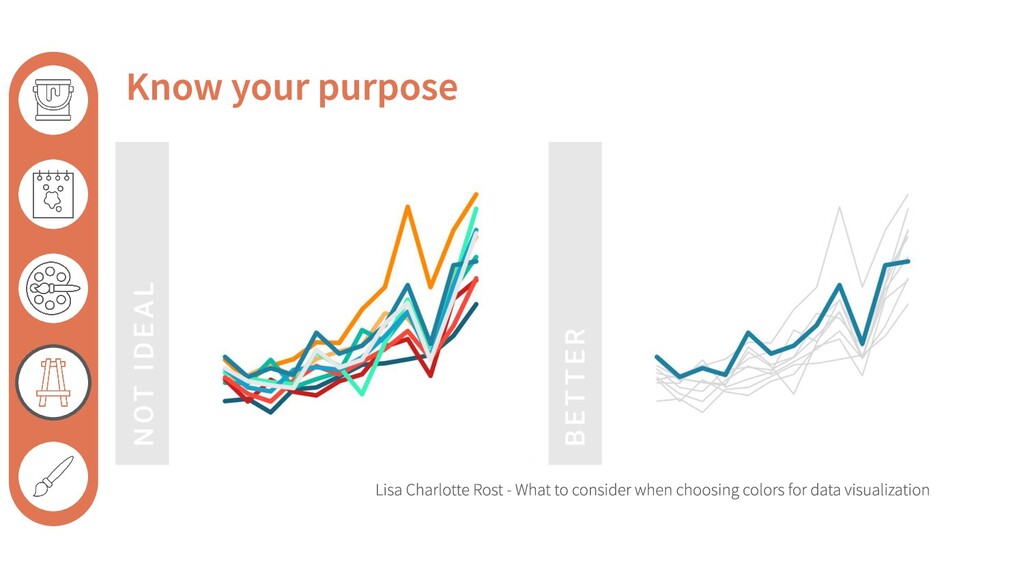
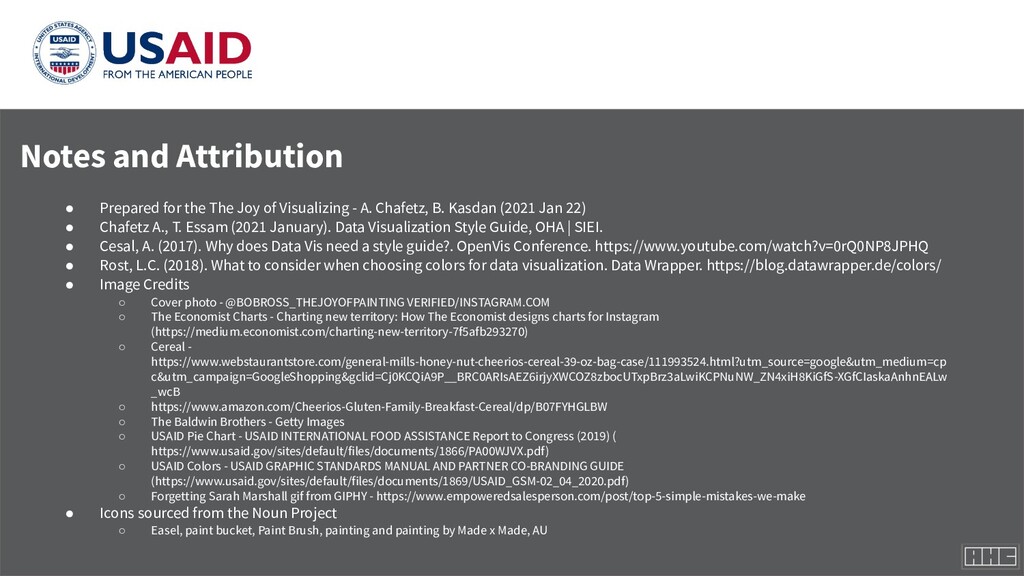
Visualizing - A. Chafetz, B. Kasdan (2021 Jan 22) • Chafetz A., T. Essam (2021 January). Data Visualization Style Guide, OHA | SIEI. • Cesal, A. (2017). Why does Data Vis need a style guide?. OpenVis Conference. https://www.youtube.com/watch?v=0rQ0NP8JPHQ • Rost, L.C. (2018). What to consider when choosing colors for data visualization. Data Wrapper. https://blog.datawrapper.de/colors/ • Image Credits ◦ Cover photo - @BOBROSS_THEJOYOFPAINTING VERIFIED/INSTAGRAM.COM ◦ The Economist Charts - Charting new territory: How The Economist designs charts for Instagram (https://medium.economist.com/charting-new-territory-7f5afb293270) ◦ Cereal - https://www.webstaurantstore.com/general-mills-honey-nut-cheerios-cereal-39-oz-bag-case/111993524.html?utm_source=google&utm_medium=cp c&utm_campaign=GoogleShopping&gclid=Cj0KCQiA9P__BRC0ARIsAEZ6irjyXWCOZ8zbocUTxpBrz3aLwiKCPNuNW_ZN4xiH8KiGfS-XGfCIaskaAnhnEALw _wcB ◦ https://www.amazon.com/Cheerios-Gluten-Family-Breakfast-Cereal/dp/B07FYHGLBW ◦ The Baldwin Brothers - Getty Images ◦ USAID Pie Chart - USAID INTERNATIONAL FOOD ASSISTANCE Report to Congress (2019) ( https://www.usaid.gov/sites/default/files/documents/1866/PA00WJVX.pdf) ◦ USAID Colors - USAID GRAPHIC STANDARDS MANUAL AND PARTNER CO-BRANDING GUIDE (https://www.usaid.gov/sites/default/files/documents/1869/USAID_GSM-02_04_2020.pdf) ◦ Forgetting Sarah Marshall gif from GIPHY - https://www.empoweredsalesperson.com/post/top-5-simple-mistakes-we-make • Icons sourced from the Noun Project ◦ Easel, paint bucket, Paint Brush, painting and painting by Made x Made, AU