Upgrade to Pro — share decks privately, control downloads, hide ads and more …

Visualizing Data (AU)

Aaron
February 09, 2023

Visualizing Data (AU)

Data Visualization: Using Data to Tell a Story
Feb 9, 2023
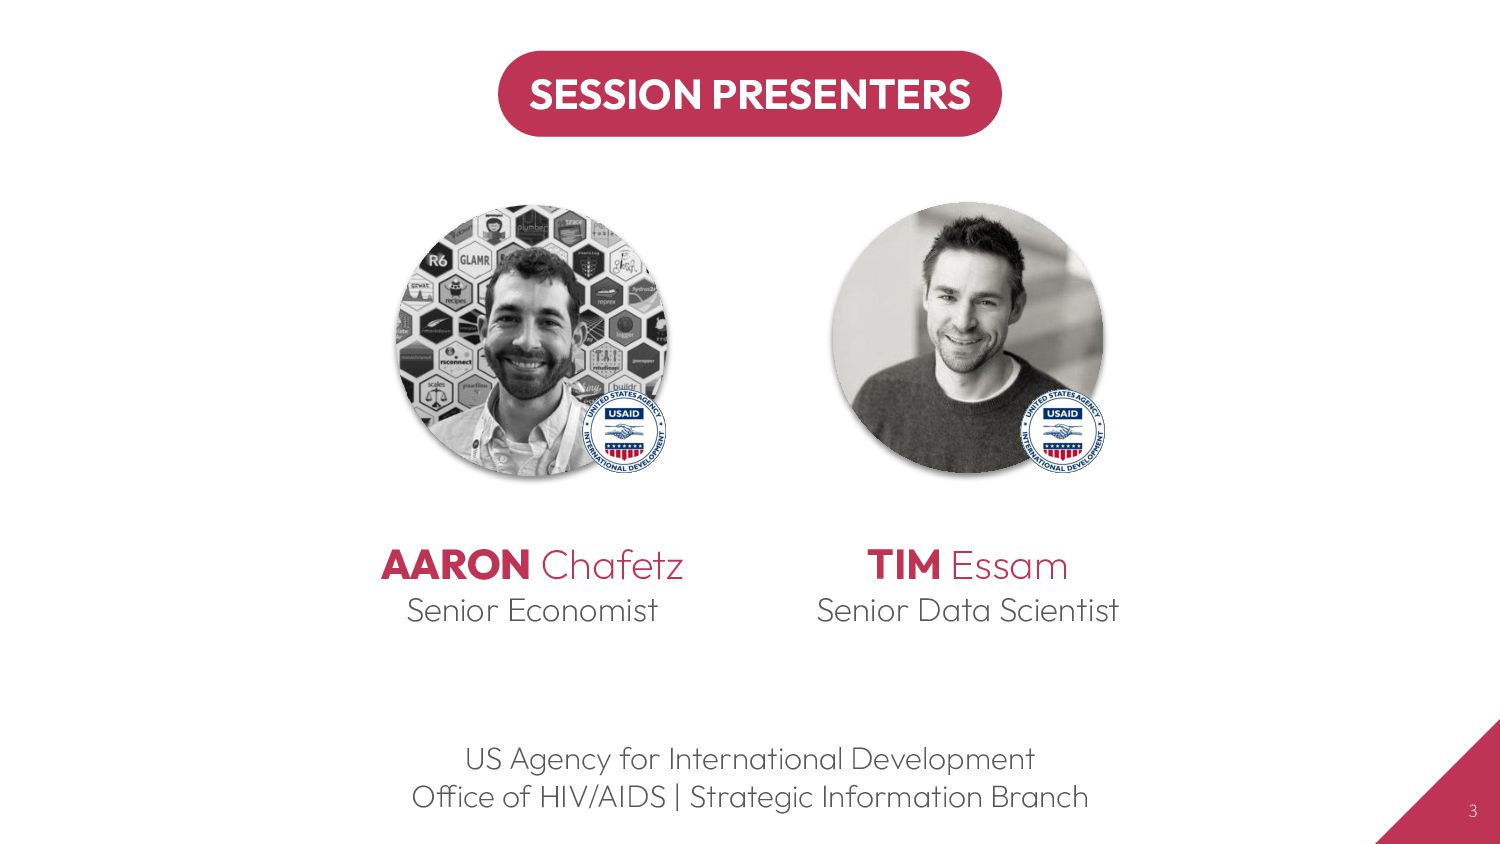
Aaron Chafetz and Tim Essam | USAID

Presented to American University's Measurement and Evaluation Program
Recording available at the following link - https://www.youtube.com/watch?v=7uJv6hmgmHQ&t=4s

Aaron

February 09, 2023
Tweet

More Decks by Aaron

Other Decks in Design

Transcript

  1. Visualizing Data Using Data to Tell a Story February 9,

    2023 | Virtual | American University Measurement and Evaluation Program
  2. 2 This presentation was made possible by the support of

    the American people through the United States Agency for International Development (USAID) under the U.S. President's Emergency Plan for AIDS Relief (PEPFAR). The contents in this presentation are the sole responsibility of the authors, and do not necessarily reflect the views of USAID, PEPFAR or the United States Government.
  3. SESSION PRESENTERS 3 AARON Chafetz Senior Economist TIM Essam Senior

    Data Scientist US Agency for International Development Office of HIV/AIDS | Strategic Information Branch
  4. Bottom Line Up Front (BLUF) • Data visualization is not

    graphic design • Less is usually better, or if using a lot of data you MUST have visual hierarchy • Good data visualization takes time, lots of it • Need to be always guided by a central question 6
  5. • Understand the benefits of visualizing and exploring data •

    Be able to identify problems with a visualization • Feel comfortable with data visualization principles • Apply data viz principles to work products Learning Objectives 7
  6. 10 8 8 2 7 5 4 6 1 5

    6 4 6 8 2 4 8 8 1 4 5 8 1 8 8 0 4 3 8 4 7 6 7 3 6 0 7 0 1 8 5 How many 4’s are in the visual?
  7. 11 8 8 2 7 5 4 6 1 5

    6 4 6 8 2 4 8 8 1 4 5 8 1 8 8 0 4 3 8 4 7 6 7 3 6 0 7 0 1 8 5 How many 4’s are in the visual?
  8. 12 8 8 2 7 5 4 6 1 5

    6 4 6 8 2 4 8 8 1 4 5 8 1 8 8 0 4 3 8 4 7 6 7 3 6 0 7 0 1 8 5 These are 4s. What we typically see How many 4’s are in the visual?
  9. These choices aren’t random; there are good reasons graphics teams

    do what they do 13 Covid response hampered by population data glitches - FT/Oliver Barnes & John Burn-Murdoch
  10. 15 8 8 2 7 5 4 6 1 5

    6 4 6 8 2 4 8 8 1 4 5 8 1 8 8 0 4 3 8 4 7 6 7 3 6 0 7 0 1 8 5 There are 6 fours in the visual below. How many 4’s are in the visual?
  11. 17 x1 x2 x3 x4 y1 y2 y3 y4 10

    10 10 8 8.04 9.14 7.46 6.58 8 8 8 8 6.95 8.14 6.77 5.76 13 13 13 8 7.58 8.74 12.74 7.71 9 9 9 8 8.81 8.77 7.11 8.84 11 11 11 8 8.33 9.26 7.81 8.47 14 14 14 8 9.96 8.1 8.84 7.04 6 6 6 8 7.24 6.13 6.08 5.25 4 4 4 19 4.26 3.1 5.39 12.5 12 12 12 8 10.84 9.13 8.15 5.56 7 7 7 8 4.82 7.26 6.42 7.91 5 5 5 8 5.68 4.74 5.73 6.89 Average 9.0 9.0 9.0 9.0 7.5 7.5 7.5 7.5 Variance 11.0 11.0 11.0 11.0 4.1 4.1 4.1 4.1 St. Dev. 3.3 3.3 3.3 3.3 2.0 2.0 2.0 2.0 Anscombeʼs Quartet
  12. 18 x1 x2 x3 x4 y1 y2 y3 y4 10

    10 10 8 8.04 9.14 7.46 6.58 8 8 8 8 6.95 8.14 6.77 5.76 13 13 13 8 7.58 8.74 12.74 7.71 9 9 9 8 8.81 8.77 7.11 8.84 11 11 11 8 8.33 9.26 7.81 8.47 14 14 14 8 9.96 8.1 8.84 7.04 6 6 6 8 7.24 6.13 6.08 5.25 4 4 4 19 4.26 3.1 5.39 12.5 12 12 12 8 10.84 9.13 8.15 5.56 7 7 7 8 4.82 7.26 6.42 7.91 5 5 5 8 5.68 4.74 5.73 6.89 Average 9.0 9.0 9.0 9.0 7.5 7.5 7.5 7.5 Variance 11.0 11.0 11.0 11.0 4.1 4.1 4.1 4.1 St. Dev. 3.3 3.3 3.3 3.3 2.0 2.0 2.0 2.0
  13. 19

  14. 21 Stop aggregating away the signal in your data -

    Visualization by Shan Carter, Zan Armstrong, Mike Freeman, and Ian Johnson
  15. 22 Stop aggregating away the signal in your data -

    Visualization by Shan Carter, Zan Armstrong, Mike Freeman, and Ian Johnson
  16. 23 Stop aggregating away the signal in your data -

    Visualization by Shan Carter, Zan Armstrong, Mike Freeman, and Ian Johnson
  17. 24 Stop aggregating away the signal in your data -

    Visualization by Shan Carter, Zan Armstrong, Mike Freeman, and Ian Johnson
  18. 1 2 31 1 Good data viz is iterative and

    happens behind the scenes
  19. 1 3 2 32 1 Good data viz is iterative

    and happens behind the scenes
  20. 1 4 3 2 33 1 Good data viz is

    iterative and happens behind the scenes
  21. 1 5 4 3 2 34 1 Good data viz

    is iterative and happens behind the scenes
  22. 1 6 5 4 3 2 35 1 Good data

    viz is iterative and happens behind the scenes
  23. “ 37 Do No Harm Guide - J. Schwabish and

    A. Feng | Institute • Use people-first language • Order labels and responses purposefully • Carefully consider colors, icons, and shapes ”
  24. 38 We can’t teach you everything in 90 minutes, but

    we can give you the ‘why’ and tools you need to create a solid foundation to build from.
  25. 44

  26. Data Wrapper 52 OHA Style Guide Do No Harm Guide

    Adobe Color colorbrewer viz-palette Click any box for a link to the resource Color Brewer Color Palettes
  27. 53 Click any box for a link to the resource

    MS Palettes Excel Hacks Excel Data Viz Open Source Tools R & Rstudio Tableau Tutorials
  28. You will read this first 78 And then you will

    read this Then this one And you will read this last
  29. 88 PEPFAR Annual Report to Congress 2022 Key Message? “PEPFAR

    has prioritized, and made significant progress toward, transitioning a substantial majority of our funding by agency to local partners”
  30. 96 Sorted Colors Clutter Title Labels Axes Achieved 70% goal

    Short of 70% goal Local partner share of budget 70% goal
  31. 97 “PEPFAR has prioritized, and made significant progress toward, transitioning

    a substantial majority of our funding by agency to local partners”
  32. 98 Local partner share of budget IN FY21, RWANDA, SOUTH

    AFRICA, ETHIOPIA & UKRAINE ALLOCATED OVER 70% OF BUDGET TO LOCAL PARTNERS The remaining 24 operating units fell short of the 70% goal. Achieved 70% goal Short of 70% goal 70% goal “PEPFAR has prioritized, and made significant progress toward, transitioning a substantial majority of our funding by agency to local partners”
  33. Recapping our Bottom Line • Data visualization is not graphic

    design • Less is usually better, or if using a lot of data you MUST have visual hierarchy • Good data visualization takes time, lots of it • Need to be always guided by a central question 100
  34. 101 Viva Magenta 18-1750 Color of the Year 2023 PANTONE

    COLOR Outfit abcdef ABCDEF 123456 Google Fonts TYPEFACE
  35. 102 Notes and Attributions • Gestalt Principles - https://www.interaction-design.org/literature/topics/gestalt-principles •

    1.3.3 Gestalt rules from Kieran Healy's Data Visualization - https://socviz.co/lookatdata.html • DatasauRus Package - https://cran.r-project.org/web/packages/datasauRus/vignettes/Datasaurus.html • What Questions to Ask When Creating Charts - https://blog.datawrapper.de/better-charts/ • How We’ve Learned Data Viz, and Why You May Want To Do It Differently - https://medium.com/nightingale/how-weve-learned-data-viz-and-why-you-may-want-to-do-it-differently-ec1267bd39b2 • PEPFAR Annual Report to Congress - https://www.state.gov/wp-content/uploads/2022/05/PEPFAR2022.pdf • Graphic design has rules, and they work … - https://twitter.com/MR_RO_BO_T/status/1533517961377587201 • #RotateTheDamnPlot - https://twitter.com/ikashnitsky/status/1521960898440613889?s=20&t=rxuGq6l-O8BMdYDG-zzw9A • bar charts and dot plots and line graphs, oh my! - https://www.storytellingwithdata.com/blog/bar-charts-and-dot-plots-and-line-graphs-oh-my • Examples from: Three Simple Flexible tools for Empowered Data Visualization - https://www.youtube.com/watch?v=W02ZlvulHSY • OHA Style Guide - https://issuu.com/achafetz/docs/oha_styleguide • Better Visualizations - Jon Schwabish • Covid response hampered by population data glitches - Oliver Barnes & John Burn-Murdoch - https://www.ft.com/content/125fbaf8-175a-4e2e-852a-9995ca5176b2