is usually better, or if using a lot of data you MUST have visual hierarchy • Good data visualization takes time, lots of it • Need to be always guided by a central question 4
exploring data • Be able to identify problems with a visualization • Feel comfortable with data visualization principles • Apply data viz principles to work products
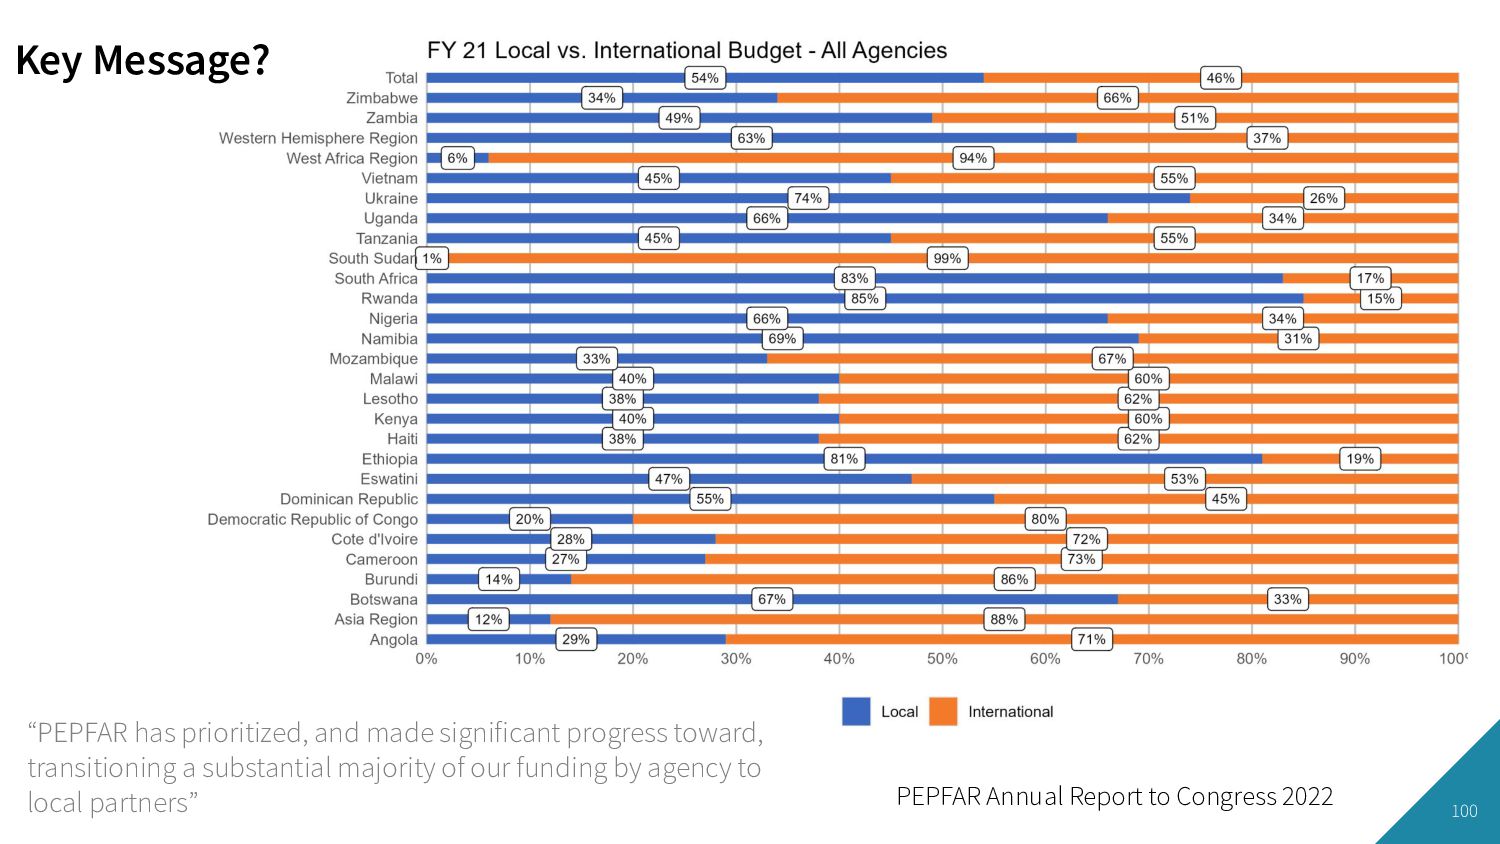
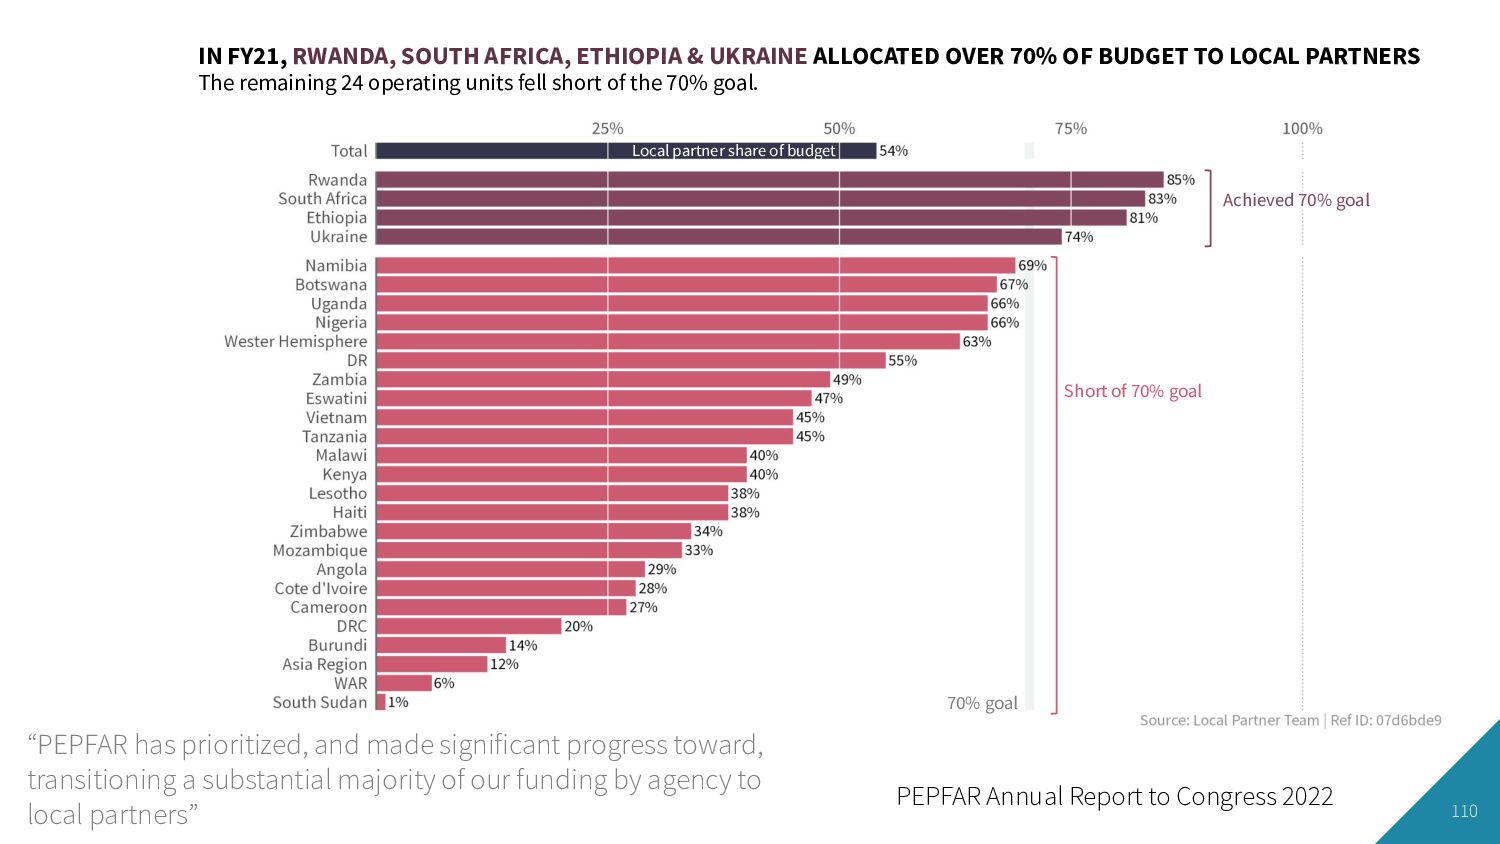
of budget IN FY21, RWANDA, SOUTH AFRICA, ETHIOPIA & UKRAINE ALLOCATED OVER 70% OF BUDGET TO LOCAL PARTNERS The remaining 24 operating units fell short of the 70% goal. Achieved 70% goal Short of 70% goal 70% goal “PEPFAR has prioritized, and made significant progress toward, transitioning a substantial majority of our funding by agency to local partners”
design • Less is usually better, or if using a lot of data you MUST have visual hierarchy • Good data visualization takes time, lots of it • Need to be always guided by a central question 113
1.3.3 Gestalt rules from Kieran Healy's Data Visualization - https://socviz.co/lookatdata.html • DatasauRus Package - https://cran.r-project.org/web/packages/datasauRus/vignettes/Datasaurus.html • What Questions to Ask When Creating Charts - https://blog.datawrapper.de/better-charts/ • How Weʼve Learned Data Viz, and Why You May Want To Do It Differently - https://medium.com/nightingale/how-weve-learned-data-viz-and-why-you-may-want-to-do-it-differently-ec1267bd39b2 • PEPFAR Annual Report to Congress - https://www.state.gov/wp-content/uploads/2022/05/PEPFAR2022.pdf • Graphic design has rules, and they work … - https://twitter.com/MR_RO_BO_T/status/1533517961377587201 • #RotateTheDamnPlot - https://twitter.com/ikashnitsky/status/1521960898440613889?s=20&t=rxuGq6l-O8BMdYDG-zzw9A • bar charts and dot plots and line graphs, oh my! - https://www.storytellingwithdata.com/blog/bar-charts-and-dot-plots-and-line-graphs-oh-my • Examples from: Three Simple Flexible tools for Empowered Data Visualization - https://www.youtube.com/watch?v=W02ZlvulHSY • OHA Style Guide - https://issuu.com/achafetz/docs/oha_styleguide • Better Visualiztions - Jon Schwabish • Covid response hampered by population data glitches - Oliver Barnes & John Burn-Murdoch - https://www.ft.com/content/125fbaf8-175a-4e2e-852a-9995ca5176b2
![28 Truth Truth Truth @visualizevalue [2022-05-09]](https://files.speakerdeck.com/presentations/37759ad965384fc6933d7577937193b0/slide_27.jpg)
![96 @ikashnitsky [2022-05-04]](https://files.speakerdeck.com/presentations/37759ad965384fc6933d7577937193b0/slide_79.jpg)