Upgrade to Pro — share decks privately, control downloads, hide ads and more …

Dane są piękne: D3JS

Dane są piękne: D3JS

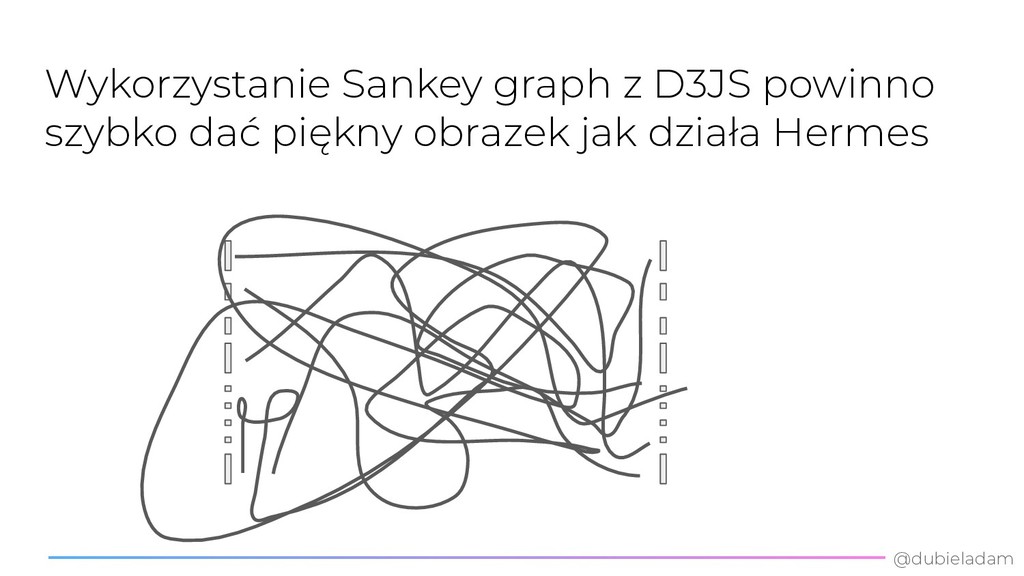
Podobno jeden obraz wart jest tysiąca słów. Tylko skąd wziąć taki obraz? Lubimy liczby i dane, ale kiedy przychodzi nam o nich mówić, to głównie.. no właśnie, mówimy, zamiast zaprezentować dane tak, żeby już żadne słowa nie były potrzebne. A gdyby tak jeszcze to nie były tylko jednorazowe piękne rysunku, gdyby dało się to jak każdy porządny projekt wrzucić do repo i aktualizować..

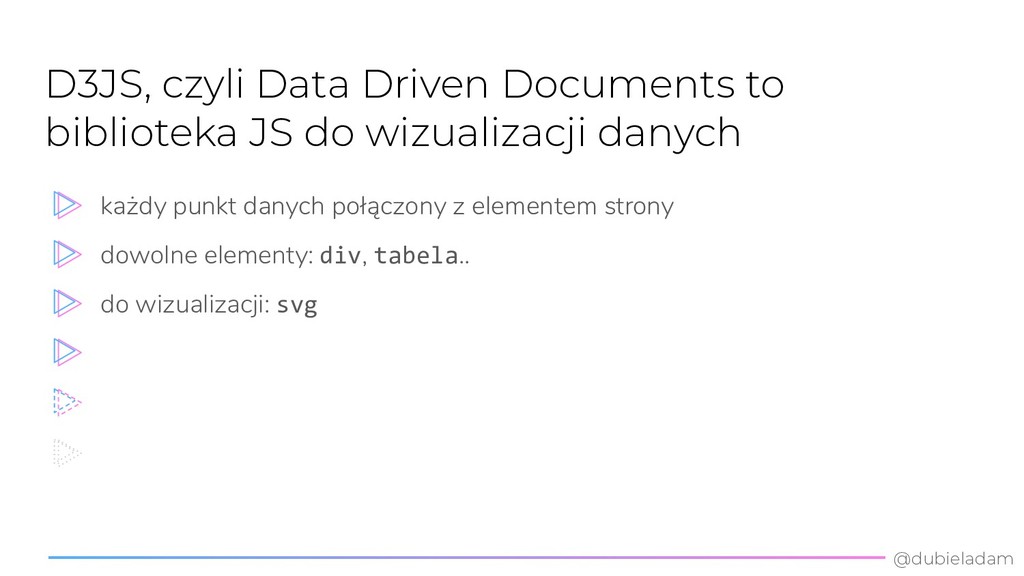
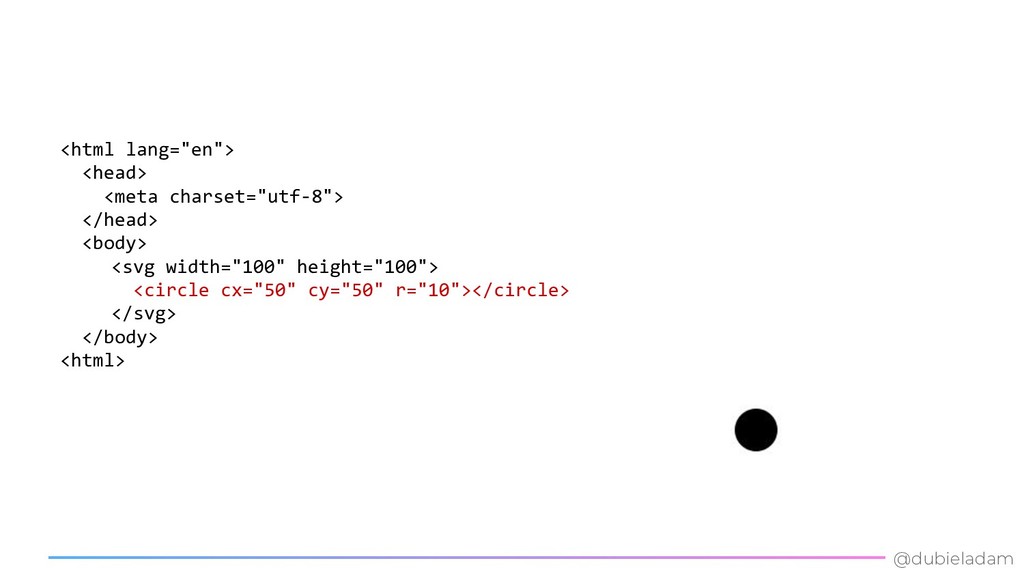
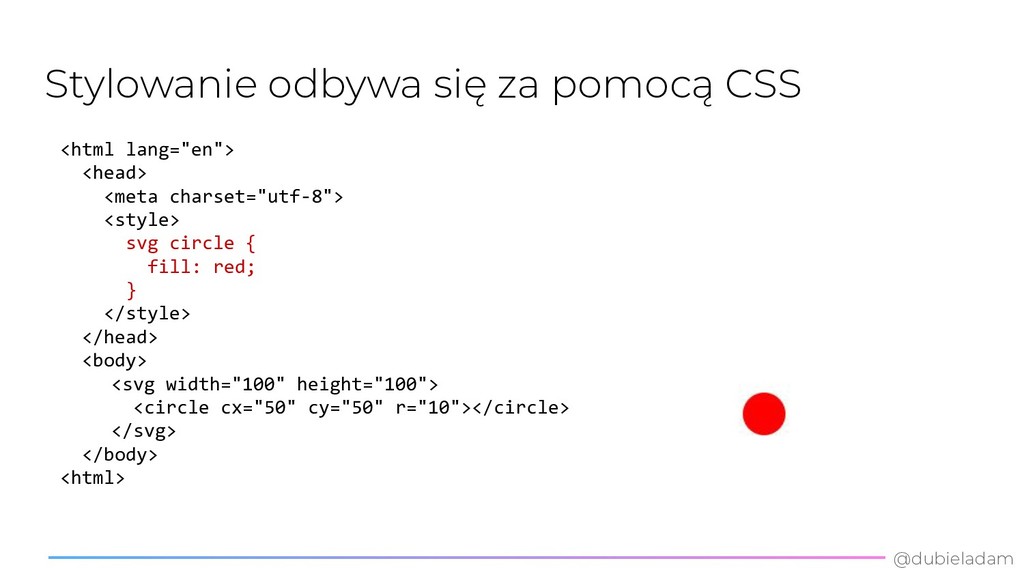
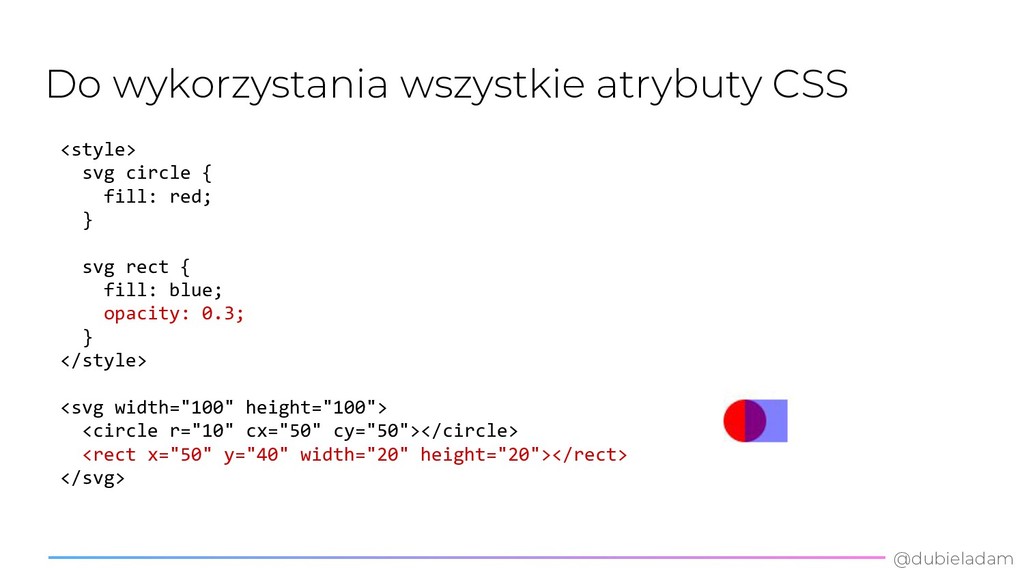
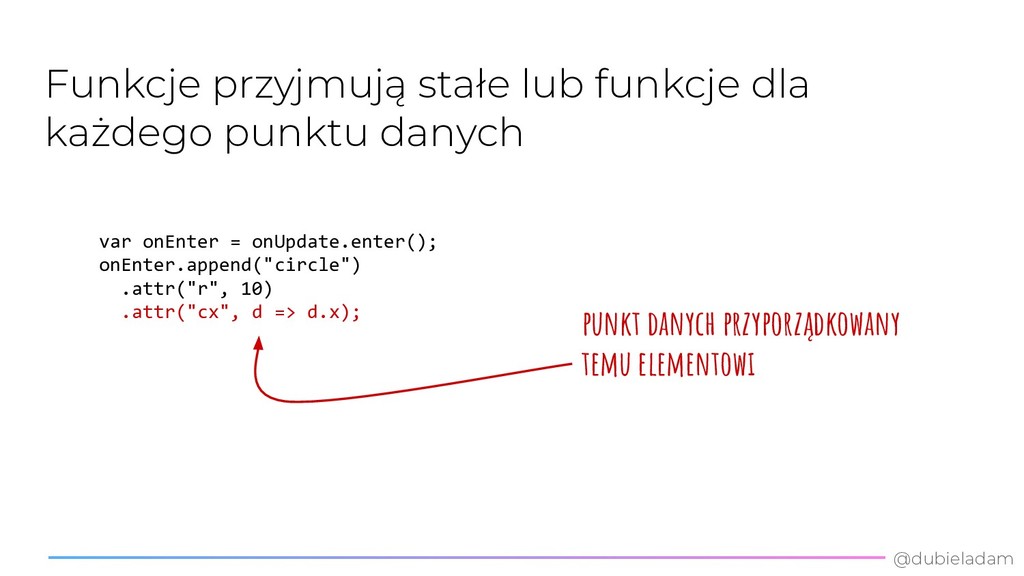
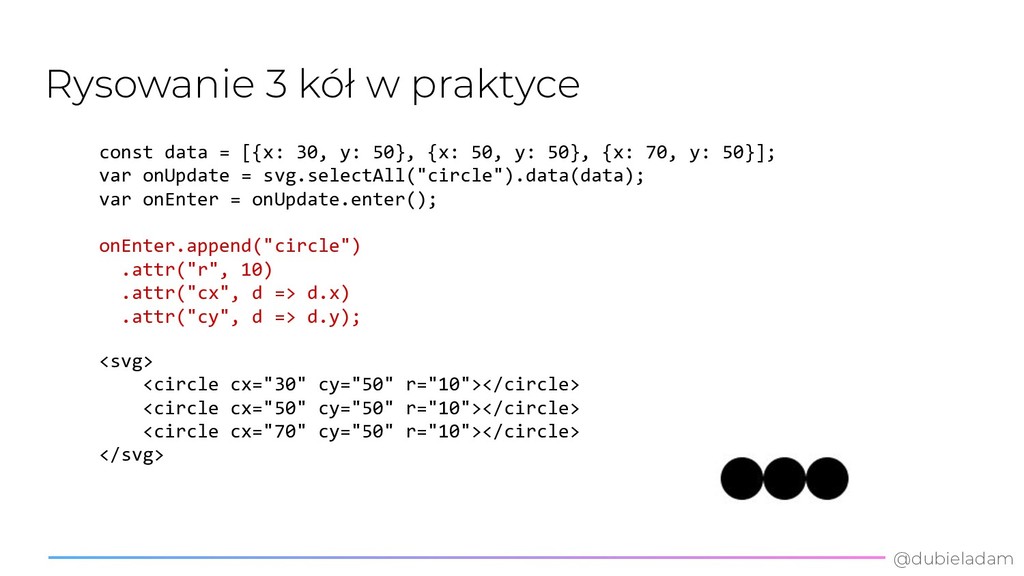
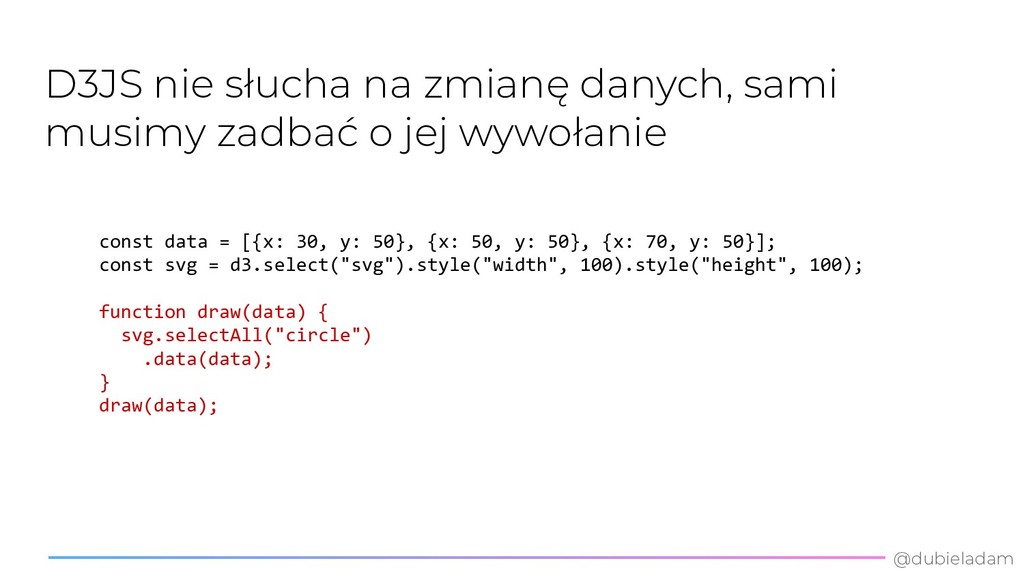
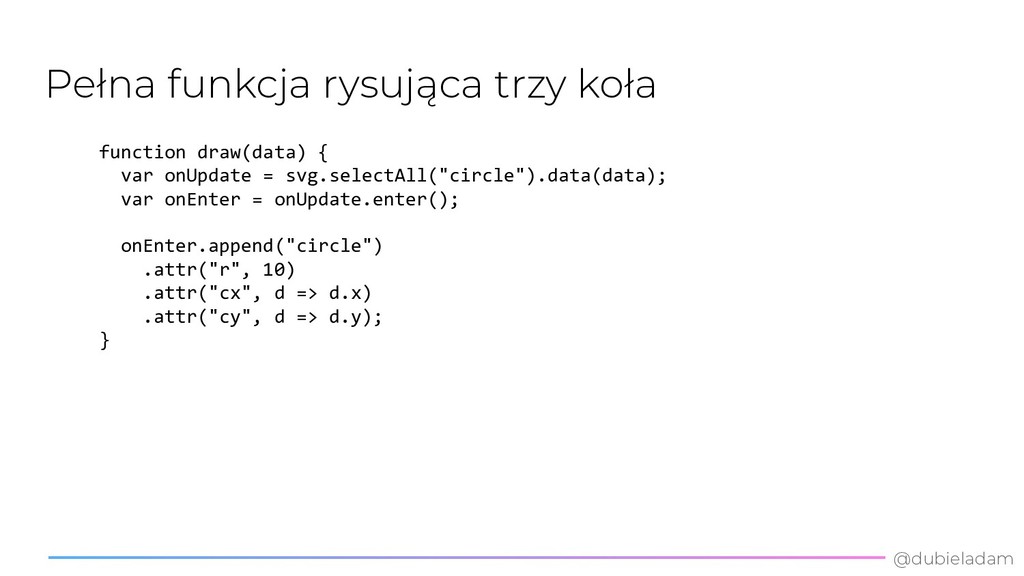
Poznaj D3JS, czyli Data Driven Documents. Biblioteka do wizualizacji danych, w której za pomocą kilku linijek kodu w JS i CSS da się pokazać dowolne dane w piękny sposób. W czasie prezentacji pokażę podstawowe koncepcje, które pozwolą Ci zrozumieć działanie D3JS i zacząć tworzyć własne obrazy z danych.

Adam Dubiel

June 18, 2019
Tweet

More Decks by Adam Dubiel

Other Decks in Technology

Transcript

  1. @dubieladam praktyczne zastosowanie umiem w animacje! Kilka godzin nad 10cioma

    linijkami kodu Podstawowe przejścia w D3JS jak poznałem moc SVG jak nie uczyć się nowej technologii bardzo chciałem zrobić coś ładnego
  2. @dubieladam D3JS, czyli Data Driven Documents to biblioteka JS do

    wizualizacji danych każdy punkt danych połączony z elementem strony dowolne elementy: div, tabela.. do wizualizacji: svg
  3. @dubieladam SVG, czyli ustrukturyzowany format zapisu grafiki rysowanie za pomocą

    elementów / obiektów zwykłe tagi html poddaje się stylowaniu (CSS) jak zwykłe elementy <svg id="graph"></svg>
  4. @dubieladam <html lang="en"> <head> <meta charset="utf-8"> </head> <body> <svg width="100"

    height="100"> <circle cx="50" cy="50" r="10"></circle> </svg> </body> <html>
  5. @dubieladam Stylowanie odbywa się za pomocą CSS <html lang="en"> <head>

    <meta charset="utf-8"> <style> svg circle { fill: red; } </style> </head> <body> <svg width="100" height="100"> <circle cx="50" cy="50" r="10"></circle> </svg> </body> <html>
  6. @dubieladam Do wykorzystania wszystkie atrybuty CSS <style> svg circle {

    fill: red; } svg rect { fill: blue; opacity: 0.3; } </style> <svg width="100" height="100"> <circle r="10" cx="50" cy="50"></circle> <rect x="50" y="40" width="20" height="20"></rect> </svg>
  7. @dubieladam Kolejność elementów ma znaczenie <style> svg circle { fill:

    red; } svg rect { fill: blue; opacity: 0.3; } </style> <svg width="100" height="100"> <rect x="50" y="40" width="20" height="20"></rect> <circle r="10" cx="50" cy="50"></circle> </svg>
  8. @dubieladam <style> svg circle { fill: red; } svg rect

    { fill: blue; opacity: 0.3; } svg circle#other { fill: green; } </style> <svg width="100" height="100"> <circle r="10" cx="50" cy="50"></circle> <circle id="other" r="10" cx="70" cy="50"></circle> <rect x="50" y="40" width="20" height="20"></rect> </svg> Można używać atrybutów id i class
  9. @dubieladam Elementy można grupować <style> svg circle { fill: red;

    } svg rect { fill: blue; opacity: 0.3; } svg circle#other { fill: green; } </style> <g transform="translate(40, 40)"> <circle r="10" cx="10" cy="10"></circle> <circle id="other" r="10" cx="30" cy="10"></circle> <rect x="10" y="0" width="20" height="20"></rect> </g> dla elementów wewnątrz współrzędne są relatywne do pozycji grupy
  10. @dubieladam <style> svg circle { fill: red; } svg rect

    { fill: blue; opacity: 0.3; } svg circle#other { fill: green; } </style> <g transform="translate(40, 40)"> <circle r="10" cx="10" cy="10"> <title>To jest labelka</title> </circle> <circle id="other" r="10" cx="30" cy="10"></circle> <rect x="10" y="0" width="20" height="20"></rect> </g> Najprostszy sposób na podpisy: label
  11. @dubieladam <html lang="en"> <head> <meta charset="utf-8"> <script src="https://d3js.org/d3.v5.min.js"></script> <style> /*

    TUTAJ WSZYSTKIE STYLE */ </style> </head> <body> <svg></svg> <!-- TU RYSUNEK --> <script> // TUTAJ CALY JAVASCRIPT </script> </body> <html>
  12. @dubieladam Łączenie danych i dokumentu przez funkcję data const data

    = [{x: 30, y: 50}, {x: 50, y: 50}, {x: 70, y: 50}]; const svg = d3.select("svg") .style("width", 100).style("height", 100); svg.selectAll("circle") .data(data);
  13. @dubieladam Rysowanie 3 kół: stan początkowy <svg> </svg> const data

    = [{x: 30, y: 50}, {x: 50, y: 50}, {x: 70, y: 50}]; svg.selectAll("circle") .data(data); brak elementów circle zdefiniowane punkty danych połączone z elementami circle
  14. @dubieladam Stan update jest domyślnym zwracanym przez API const data

    = [{x: 30, y: 50}, {x: 50, y: 50}, {x: 70, y: 50}]; const svg = d3.select("svg") .style("width", 100).style("height", 100); var onUpdate = svg.selectAll("circle") .data(data);
  15. @dubieladam Stan enter - akcje wykonywane dla nowych elementów var

    onUpdate = svg.selectAll("circle") .data(data); var onEnter = onUpdate.enter();
  16. @dubieladam Funkcje przyjmują stałe lub funkcje dla każdego punktu danych

    var onEnter = onUpdate.enter(); onEnter.append("circle") .attr("r", 10) .attr("cx", d => d.x); punkt danych przyporządkowany temu elementowi
  17. @dubieladam Rysowanie 3 kół w praktyce <svg> <circle cx="30" cy="50"

    r="10"></circle> <circle cx="50" cy="50" r="10"></circle> <circle cx="70" cy="50" r="10"></circle> </svg> const data = [{x: 30, y: 50}, {x: 50, y: 50}, {x: 70, y: 50}]; var onUpdate = svg.selectAll("circle").data(data); var onEnter = onUpdate.enter(); onEnter.append("circle") .attr("r", 10) .attr("cx", d => d.x) .attr("cy", d => d.y);
  18. @dubieladam D3JS nie słucha na zmianę danych, sami musimy zadbać

    o jej wywołanie const data = [{x: 30, y: 50}, {x: 50, y: 50}, {x: 70, y: 50}]; const svg = d3.select("svg").style("width", 100).style("height", 100); function draw(data) { svg.selectAll("circle") .data(data); } draw(data);
  19. @dubieladam Pełna funkcja rysująca trzy koła function draw(data) { var

    onUpdate = svg.selectAll("circle").data(data); var onEnter = onUpdate.enter(); onEnter.append("circle") .attr("r", 10) .attr("cx", d => d.x) .attr("cy", d => d.y); }
  20. @dubieladam Co się zmieni, jeśli przekażemy inne dane? <svg> <circle

    cx="30" cy="50" r="10"></circle> <circle cx="50" cy="50" r="10"></circle> <circle cx="70" cy="50" r="10"></circle> </svg> const data0 = [{x: 30, y: 50}, {x: 50, y: 50}, {x: 70, y: 50}]; const data1 = [{x: 30, y: 70}, {x: 50, y: 70}, {x: 70, y: 70}]; draw(data0); draw(data1); nic się nie zmieniło :(
  21. @dubieladam Istnieje zachowanie onEnter, brak on Update function draw(data) {

    var onUpdate = svg.selectAll("circle").data(data); var onEnter = onUpdate.enter(); onEnter.append("circle") .attr("r", 10) .attr("cx", d => d.x) .attr("cy", d => d.y); }
  22. @dubieladam D3JS umie wyliczyć różnice w zbiorze elementów i danych

    by default diff polega na porównaniu rozmiaru zbioru danych zawartość nie ma znaczenia (?) tablica data0 i data1 mają ten sam rozmiar nie ma elementów do enter ani exit, tylko update id elementu == index w tablicy danych
  23. @dubieladam Wymagane wskazanie akcji w onUpdate function drawWithUpdate(data) { var

    onUpdate = svg.selectAll("circle").data(data); var onEnter = onUpdate.enter(); onEnter.append("circle") .attr("r", 10) .attr("cx", d => d.x) .attr("cy", d => d.y); onUpdate .attr("cx", d => d.x) .attr("cy", d => d.y); } tylko dla nowych dla wszystkich istniejących
  24. @dubieladam Po poprawnym zaimplementowaniu zmiany są widoczne <svg> <circle cx="30"

    cy="70" r="10"></circle> <circle cx="50" cy="70" r="10"></circle> <circle cx="70" cy="70" r="10"></circle> </svg> const data0 = [{x: 30, y: 50}, {x: 50, y: 50}, {x: 70, y: 50}]; const data1 = [{x: 30, y: 70}, {x: 50, y: 70}, {x: 70, y: 70}]; drawWithUpdate(data0); drawWithUpdate(data1); zmiana w onUpdate
  25. @dubieladam Elementom można przypisać klucz, żeby nadpisać domyślne zachowanie const

    data = [{id: "1", x: 30, y: 50}, {id: "2", x: 50, y: 50}, {id: "3", x: 70, y: 50}]; svg.selectAll("circle") .data(data, d => d.id);
  26. @dubieladam Pełna funkcja przypisująca klucz do elementów function drawWithId(data) {

    var onUpdate = svg.selectAll("circle") .data(data, d => d.id); var onEnter = onUpdate.enter(); onEnter.append("circle") .attr("r", 10) .attr("cx", d => d.x) .attr("cy", d => d.y); onUpdate .attr("cx", d => d.x) .attr("cy", d => d.y); }
  27. @dubieladam onEnter i onUpdate nie wystarczą przy zmianach <svg> <circle

    cx="30" cy="50" r="10"></circle> <circle cx="30" cy="50" r="10"></circle> <circle cx="30" cy="70" r="10"></circle> <circle cx="50" cy="70" r="10"></circle> </svg> const data0 = [{id: "0-1", x: 30, y: 50}, {id: "0-2", x: 50, y: 50}]; const data1 = [{id: "1-1", x: 30, y: 70}, {id: "1-2", x: 50, y: 70}]; drawWithId(data0); drawWithId(data1); Enter wykrył nowe elementy brak exit..
  28. @dubieladam Najprostsza akcja w momencie wykrycia braku elementu to usunięcie

    var onUpdate = svg.selectAll("circle") .data(data); var onExit = onUpdate.exit().remove();
  29. @dubieladam Pełna funkcja z obsługą trzech stanów function drawWithExit(data) {

    var onUpdate = svg.selectAll("circle") .data(data, d => d.id); var onEnter = onUpdate.enter(); var onExit = onUpdate.exit(); onEnter.append("circle") .attr("r", 10) .attr("cx", d => d.x) .attr("cy", d => d.y); onUpdate .attr("cx", d => d.x) .attr("cy", d => d.y); onExit.remove(); }
  30. @dubieladam ...i efekt jej działania <svg> <circle cx="30" cy="70" r="10"></circle>

    <circle cx="50" cy="70" r="10"></circle> </svg> const data0 = [{id: "0-1", x: 30, y: 50}, {id: "0-2", x: 50, y: 50}]; const data1 = [{id: "1-1", x: 30, y: 70}, {id: "1-2", x: 50, y: 70}]; drawWithExit(data0); drawWithExit(data1); exit usunął stare elementy niepasujące do zbioru
  31. @dubieladam Transition to animacja przy zmianie stanu obiektu var onUpdate

    = svg.selectAll("circle") .data(data, d => d.id); onUpdate .transition(d3.transition().duration(500)) .attr('cx', d => d.x) .attr('cy', d => d.y);
  32. @dubieladam Pełna funkcja z animacją przy aktualizacji function drawWithTransition(data) {

    var onUpdate = svg.selectAll("circle") .data(data, d => d.id); var onEnter = onUpdate.enter(); var onExit = onUpdate.exit(); onEnter.append("circle") .attr("r", 10) .attr("cx", d => d.x) .attr("cy", d => d.y); onUpdate .transition(d3.transition().duration(500)) .attr("cx", d => d.x) .attr("cy", d => d.y); onExit.remove(); }
  33. @dubieladam … i efekt jej działania const data0 = [{id:

    "1", x: 30, y: 50}, {id: "2", x: 50, y: 50}]; const data1 = [{id: "1", x: 30, y: 70}, {id: "2", x: 50, y: 70}]; drawWithTransition(data0); setTimeout(() => drawWithTransition(data1), 1000);
  34. @dubieladam Można łączyć wiele efektów, ale wykonywane są sekwencyjnie onUpdate

    .transition(d3.transition().duration(500)) .attr('cx', d => d.x) .attr('cy', d => d.y) .transition(d3.transition().duration(500)) .attr("r", d => d.r);
  35. @dubieladam Pełna funckja z wieloma animacjami function drawWithTransition(data) { var

    onUpdate = svg.selectAll("circle") .data(data, d => d.id); var onEnter = onUpdate.enter(); var onExit = onUpdate.exit(); onEnter.append("circle") .attr("r", d => d.r) .attr("cx", d => d.x) .attr("cy", d => d.y); onUpdate .transition(d3.transition().duration(500)) .attr("cx", d => d.x) .attr("cy", d => d.y) .transition(d3.transition().duration(500)) .attr("r", d => d.r); onExit.remove(); }
  36. @dubieladam ...i efekty jej działania const data0 = [{id: "1",

    x: 30, y: 50, r: 10}]; const data1 = [{id: "1", x: 30, y: 70, r: 40}]; drawWithTransition(data0); setTimeout(() => drawWithTransition(data1), 1000);
  37. @dubieladam d3.json() zaczytuje JSONa (raw do samodzielnej obróbki) d3.csv() zaczytuje

    CSV jako tablice wpisów https://github.com/d3/d3/blob/master/API.md#fetches-d3-fetch Moduł d3-fetch daje możliwość zaczytania danych z zewnątrz <script src="https://d3js.org/d3-fetch.v1.min.js"></script> d3.json("data.json", data => { drawWithTransition(data); });
  38. @dubieladam Cała trudność polega na rozmieszczeniu danych w przestrzeni d3

    posiada wbudowane algorytmy do wyliczenia rozmieszczeń dla każdego trzeba przygotować odpowiednio dane https://github.com/d3/d3/blob/master/API.md
  39. @dubieladam d3-array operacje na danych funkcje matematyczne dla zbiorów (min,

    max, łączenie…) funkcje statystyczne (histogram)
  40. @dubieladam Materiały strona projektu: https://d3js.org github wiki: https://github.com/d3/d3/wiki wizualizacje: https://github.com/d3/d3/wiki/Gallery

    wizualizacje z kodem: https://observablehq.com API: https://github.com/d3/d3/blob/master/API.md wszystkie tutoriale: https://github.com/d3/d3/wiki/Tutorials
  41. @dubieladam Materiały prosty tutorial: https://bost.ocks.org/mike/circles/ filozofia: https://bost.ocks.org/mike/joins/ najprostszy bar chart:

    https://bost.ocks.org/mike/bar/ selections: https://bost.ocks.org/mike/selection/ zagnieżdżone selections: https://bost.ocks.org/mike/nest/ podstawy zmiany stanu: https://bl.ocks.org/mbostock/3808218