by: Agustina Sri Wardani [email protected] https://www.linkedin.com/in/agustinaswd/ Hi, nice to meet you. In this 4th mini project from Data Science Bootcamp at Rakamin Academy. In this project, I'm a Data Analyst in a company. I'm responsible for seeking insights regarding user behavior from this data by visualizing it, creating machine learning relevant to company needs, and making recommendations based on the findings obtained.
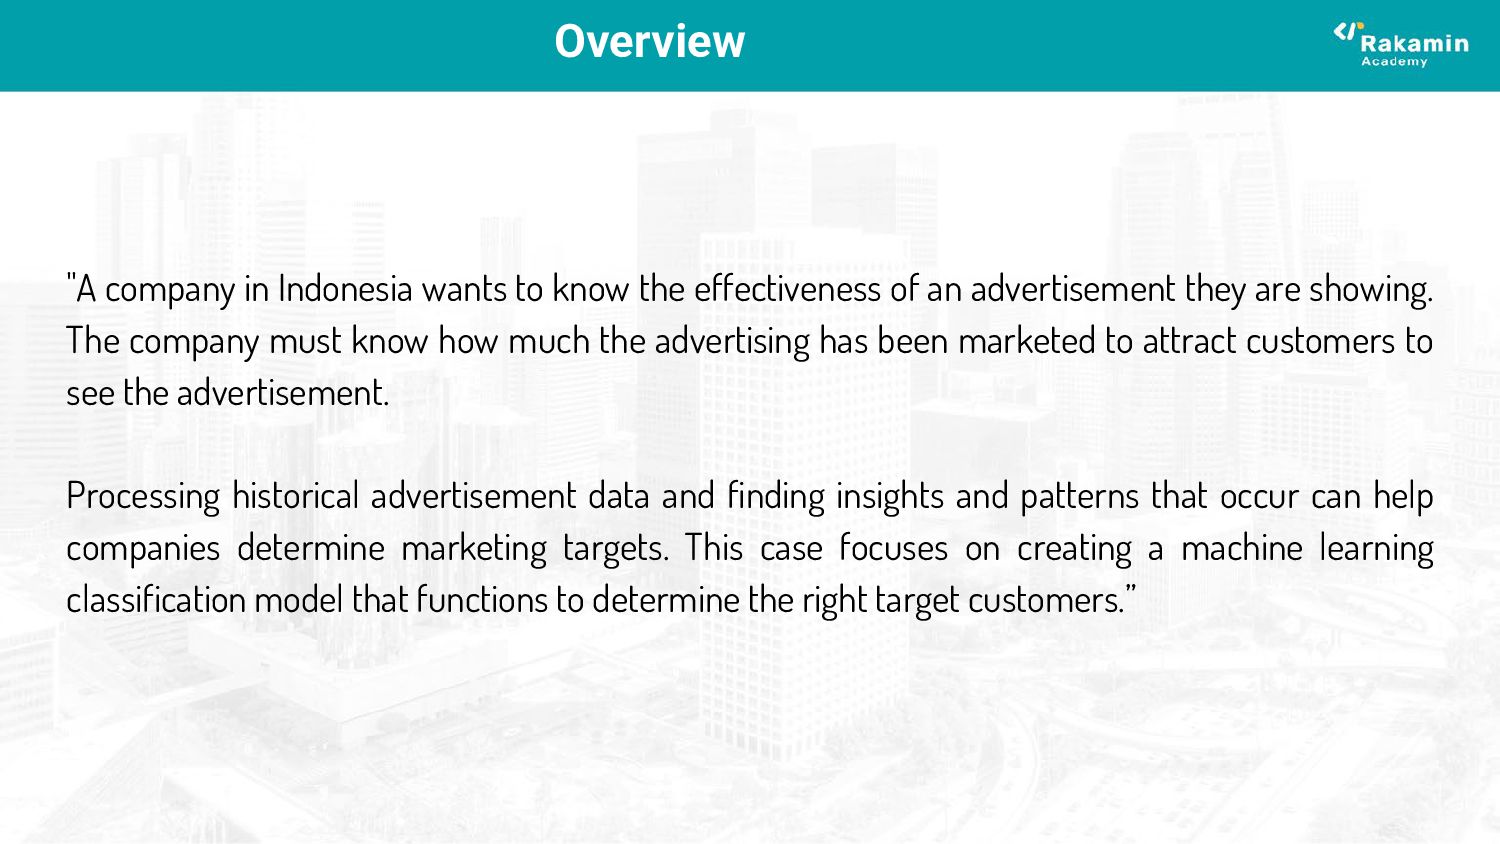
of an advertisement they are showing. The company must know how much the advertising has been marketed to attract customers to see the advertisement. Processing historical advertisement data and finding insights and patterns that occur can help companies determine marketing targets. This case focuses on creating a machine learning classification model that functions to determine the right target customers.”
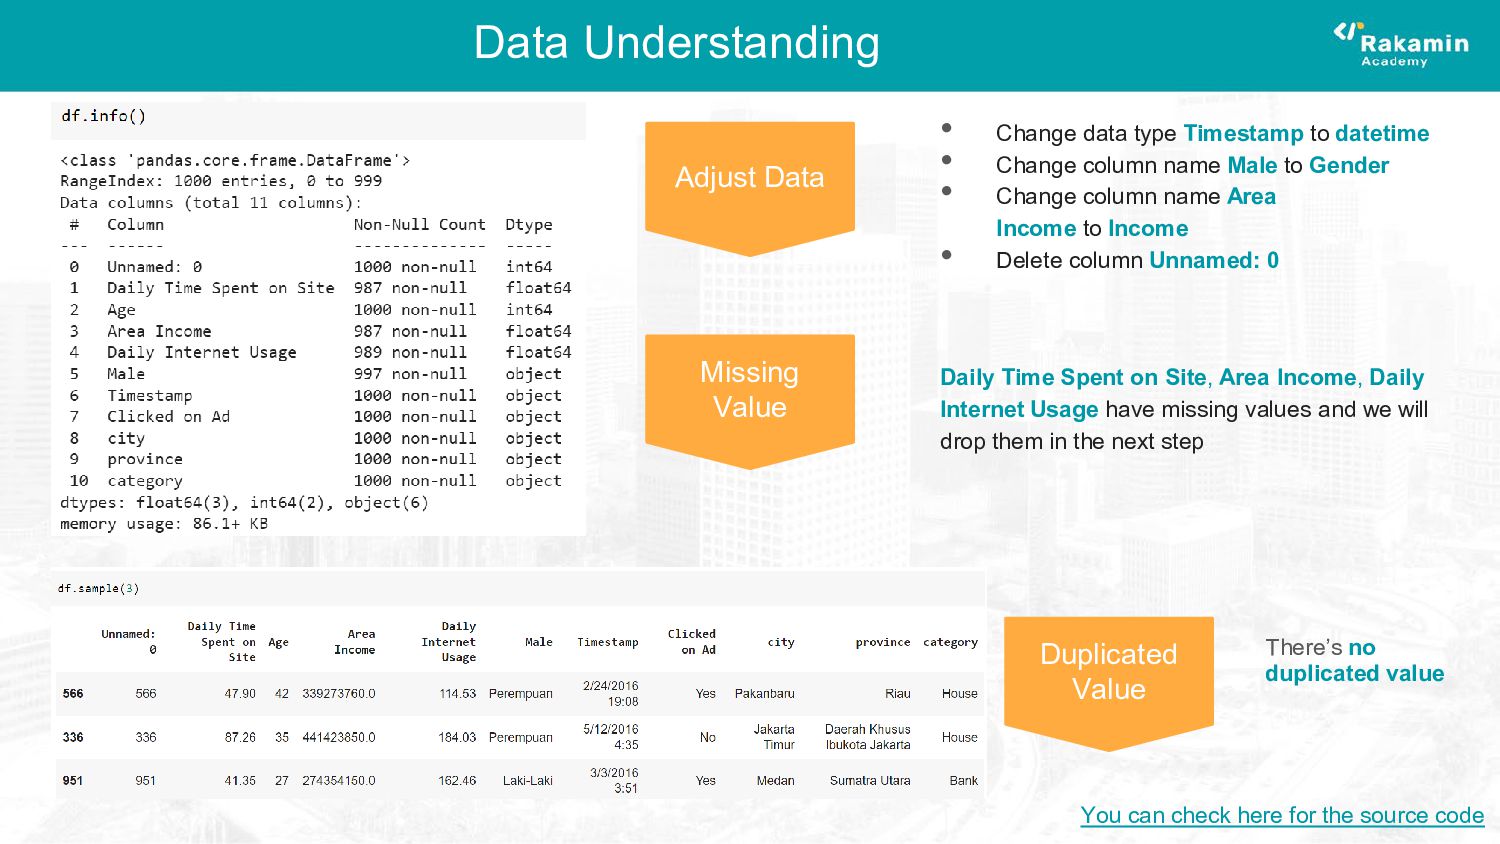
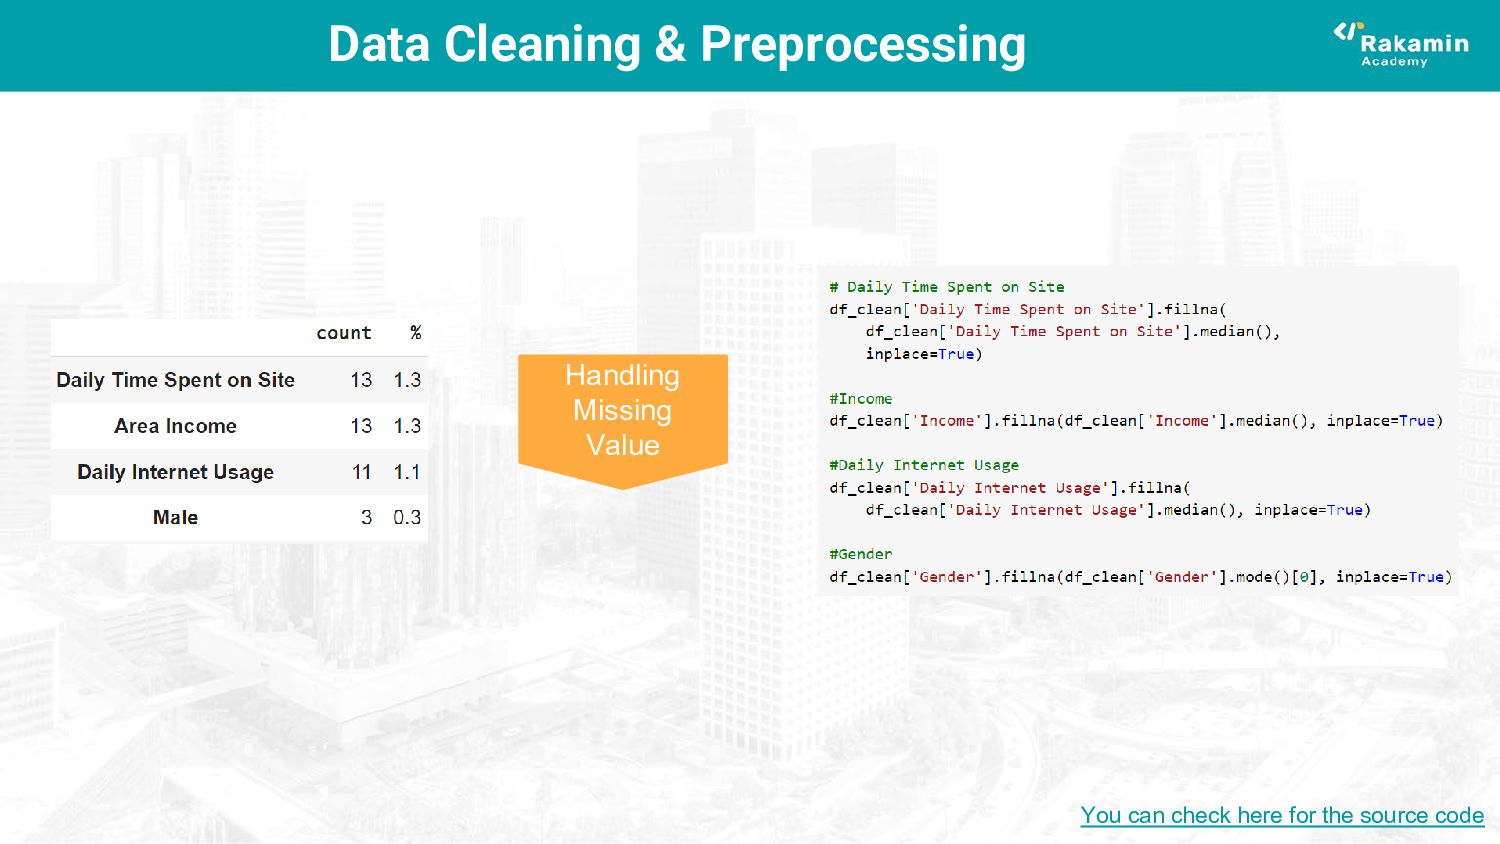
Change column name Male to Gender • Change column name Area Income to Income • Delete column Unnamed: 0 Adjust Data Daily Time Spent on Site, Area Income, Daily Internet Usage have missing values and we will drop them in the next step Missing Value There’s no duplicated value Duplicated Value You can check here for the source code
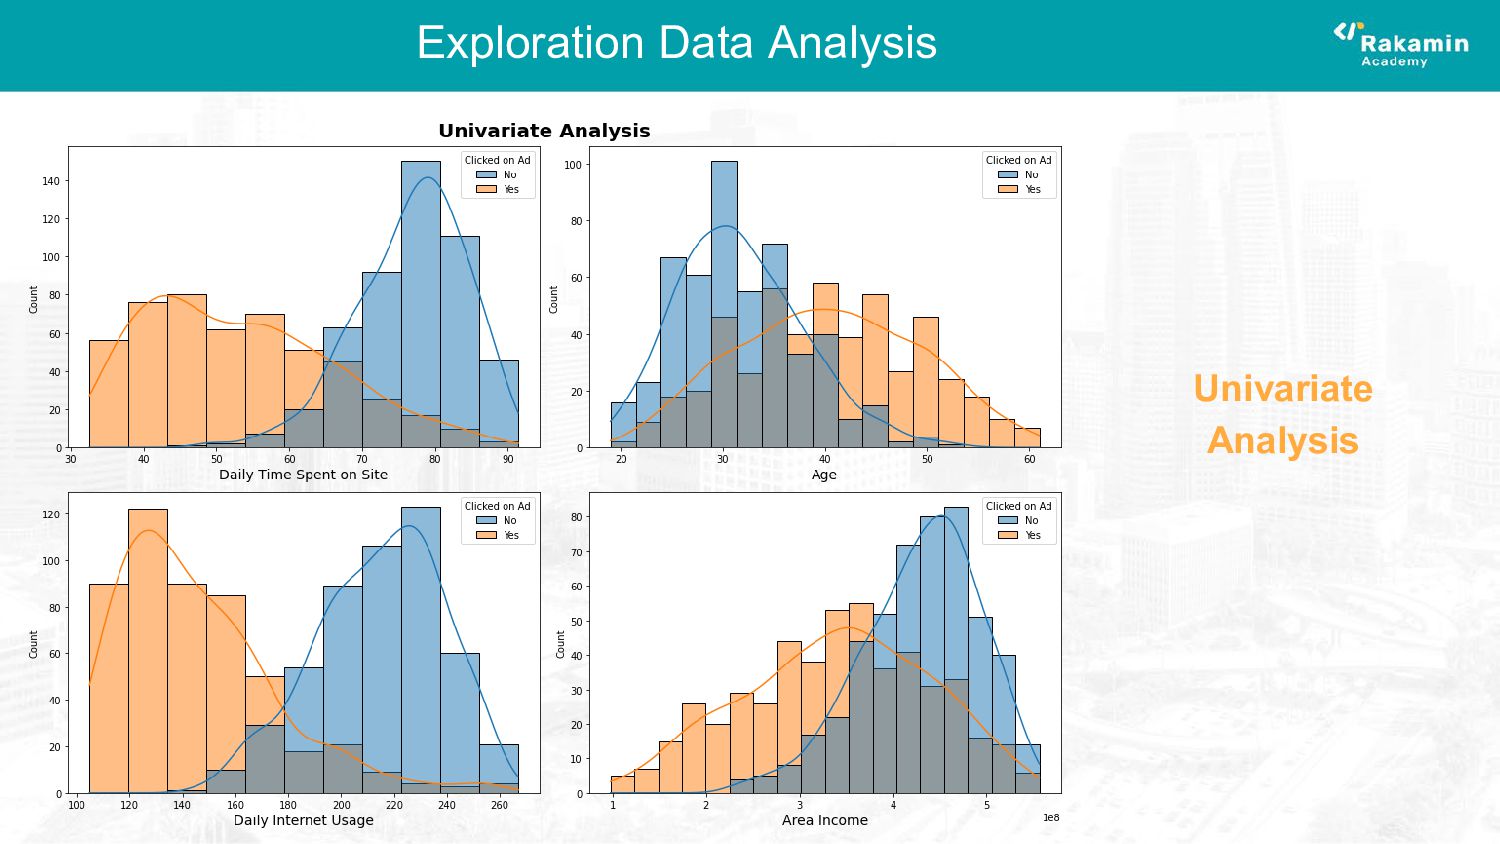
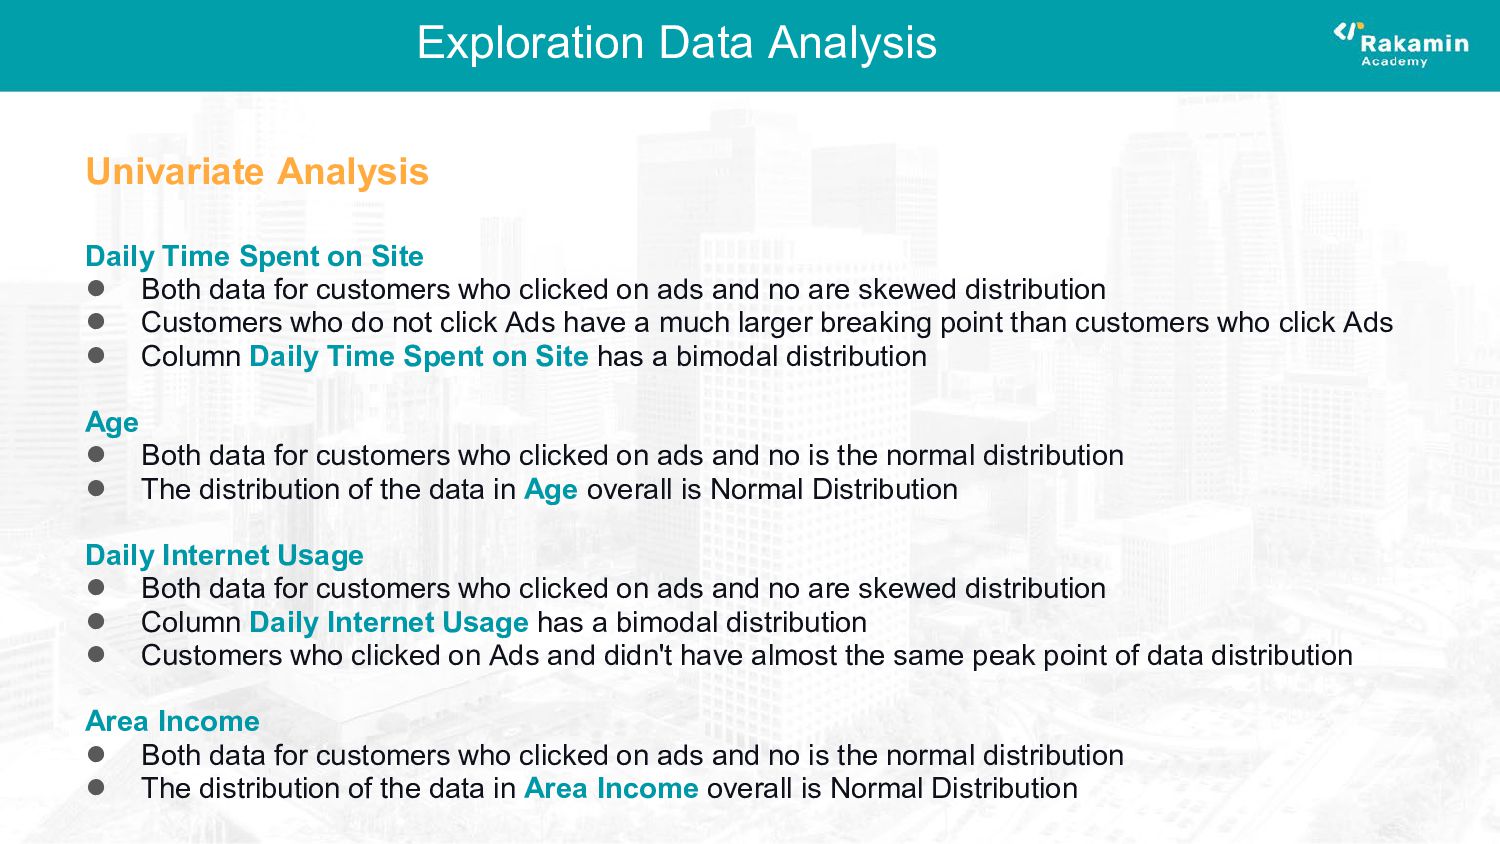
data for customers who clicked on ads and no are skewed distribution • Customers who do not click Ads have a much larger breaking point than customers who click Ads • Column Daily Time Spent on Site has a bimodal distribution Age • Both data for customers who clicked on ads and no is the normal distribution • The distribution of the data in Age overall is Normal Distribution Daily Internet Usage • Both data for customers who clicked on ads and no are skewed distribution • Column Daily Internet Usage has a bimodal distribution • Customers who clicked on Ads and didn't have almost the same peak point of data distribution Area Income • Both data for customers who clicked on ads and no is the normal distribution • The distribution of the data in Area Income overall is Normal Distribution Univariate Analysis
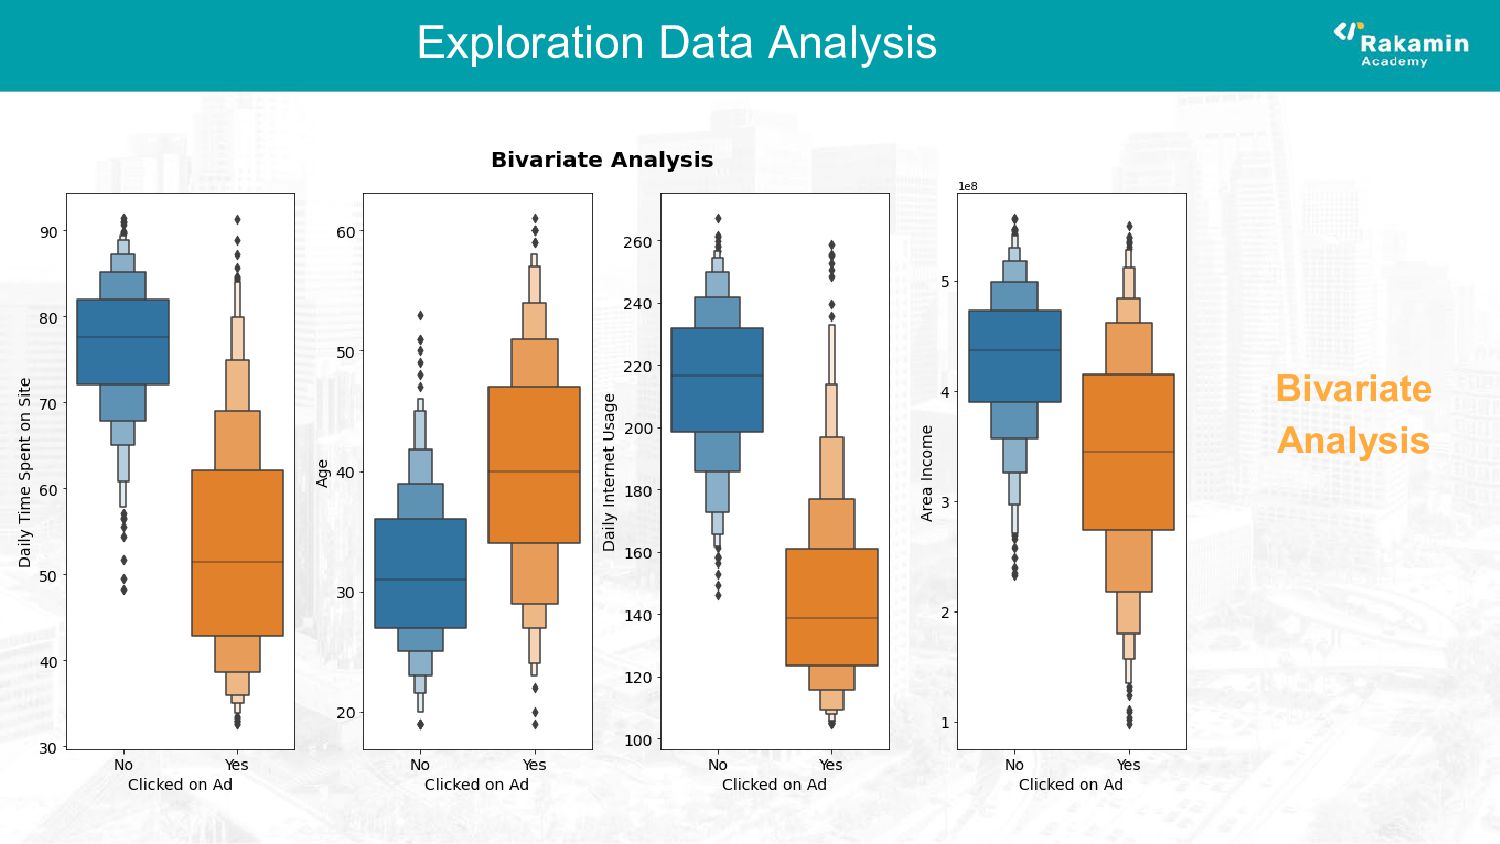
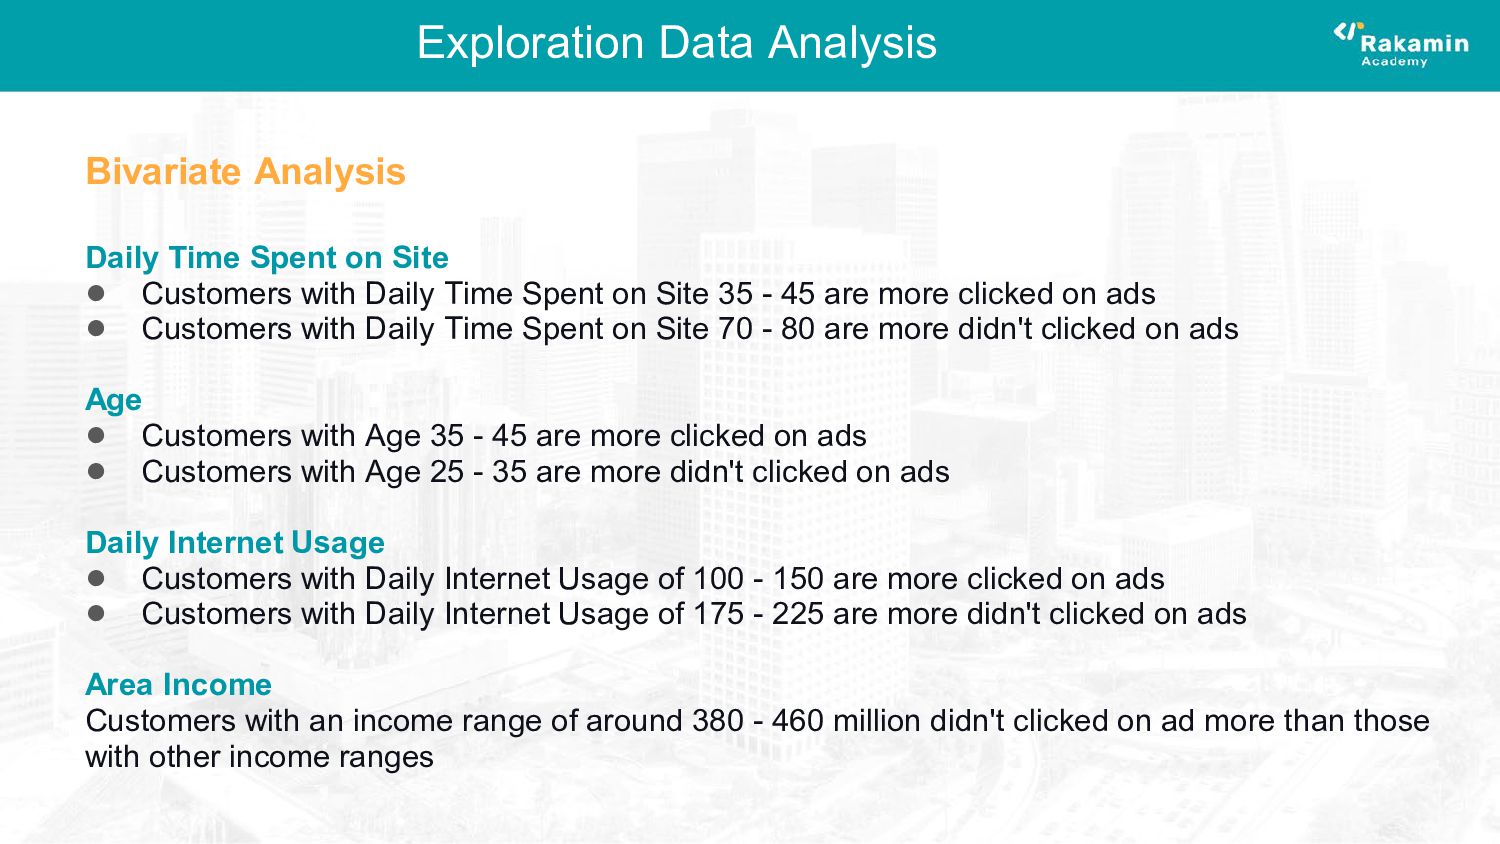
with Daily Time Spent on Site 35 - 45 are more clicked on ads • Customers with Daily Time Spent on Site 70 - 80 are more didn't clicked on ads Age • Customers with Age 35 - 45 are more clicked on ads • Customers with Age 25 - 35 are more didn't clicked on ads Daily Internet Usage • Customers with Daily Internet Usage of 100 - 150 are more clicked on ads • Customers with Daily Internet Usage of 175 - 225 are more didn't clicked on ads Area Income Customers with an income range of around 380 - 460 million didn't clicked on ad more than those with other income ranges Bivariate Analysis
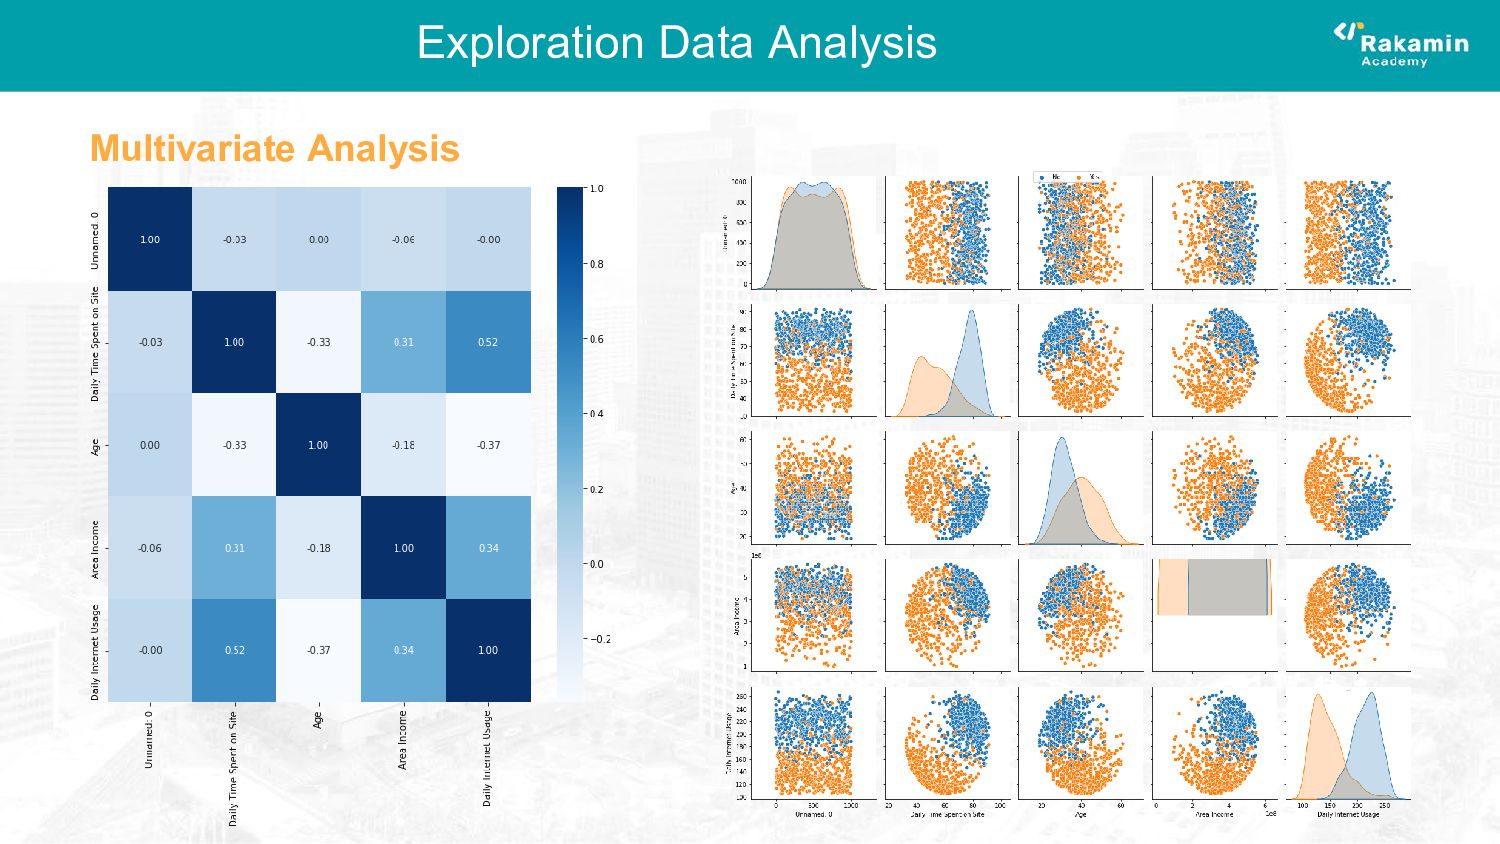
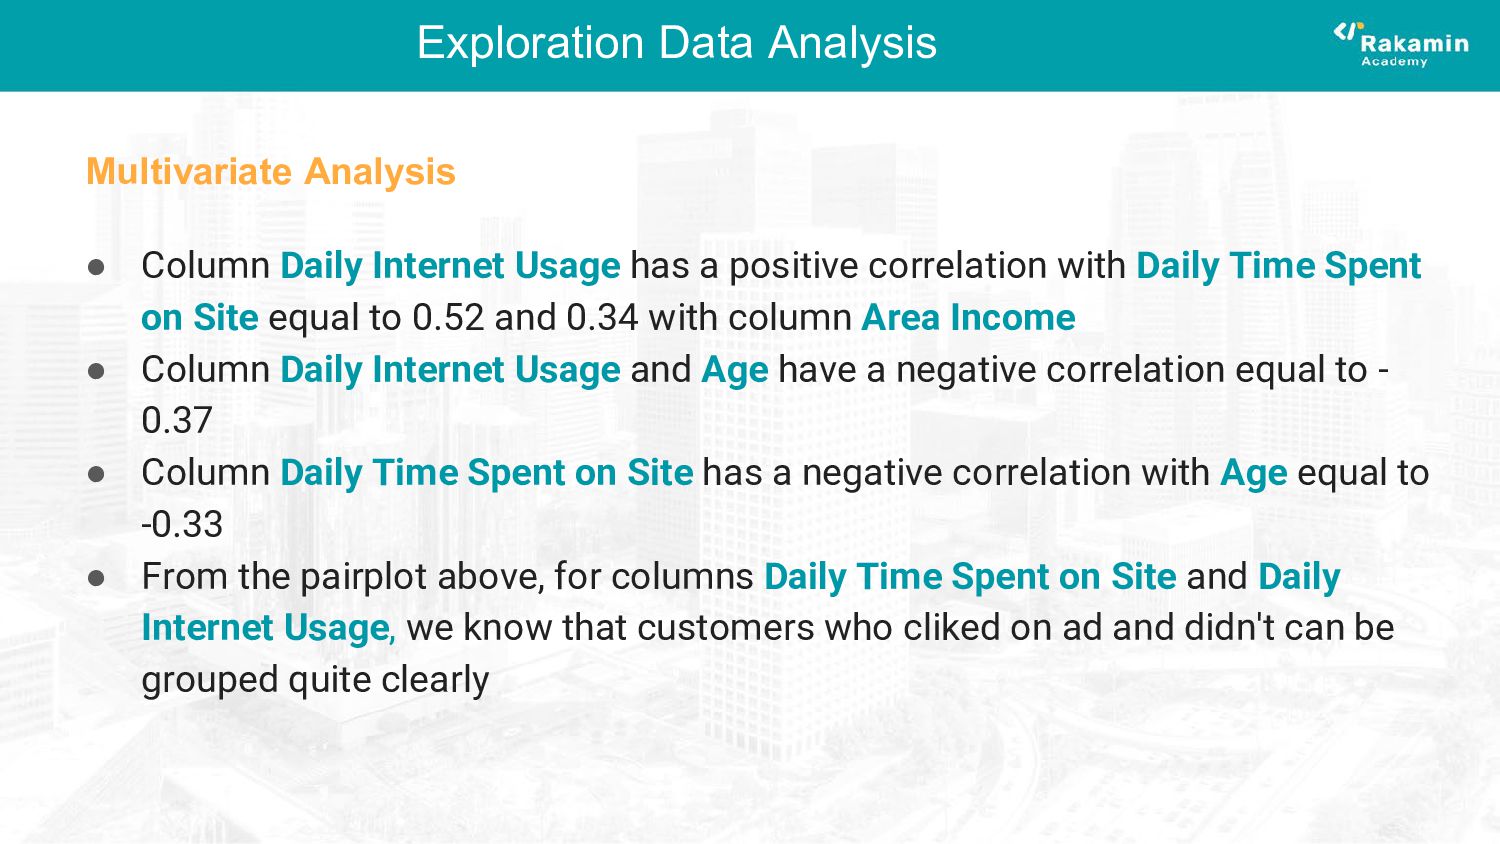
positive correlation with Daily Time Spent on Site equal to 0.52 and 0.34 with column Area Income • Column Daily Internet Usage and Age have a negative correlation equal to - 0.37 • Column Daily Time Spent on Site has a negative correlation with Age equal to -0.33 • From the pairplot above, for columns Daily Time Spent on Site and Daily Internet Usage, we know that customers who cliked on ad and didn't can be grouped quite clearly Multivariate Analysis
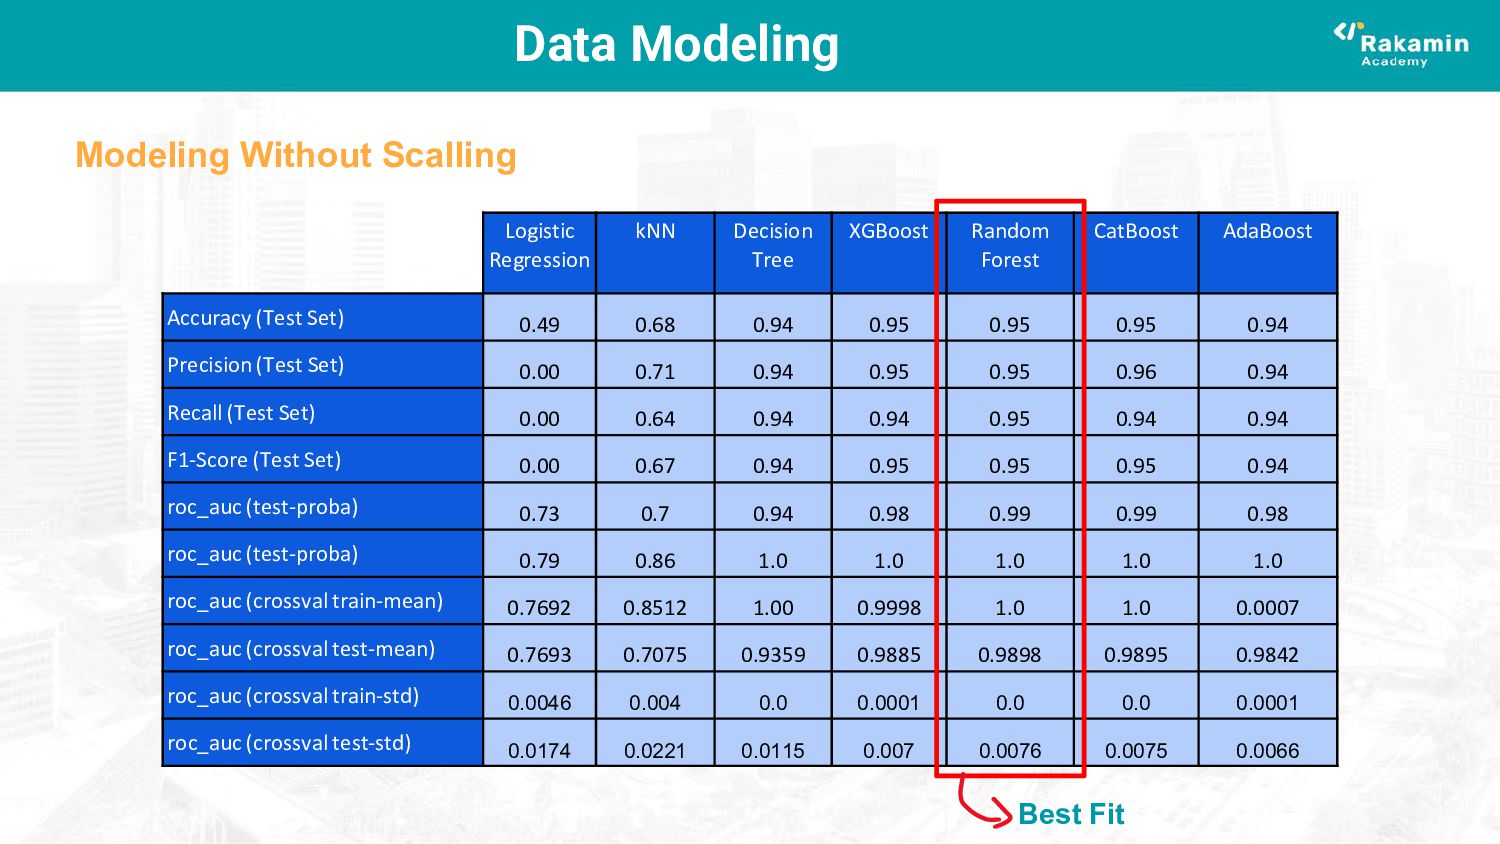
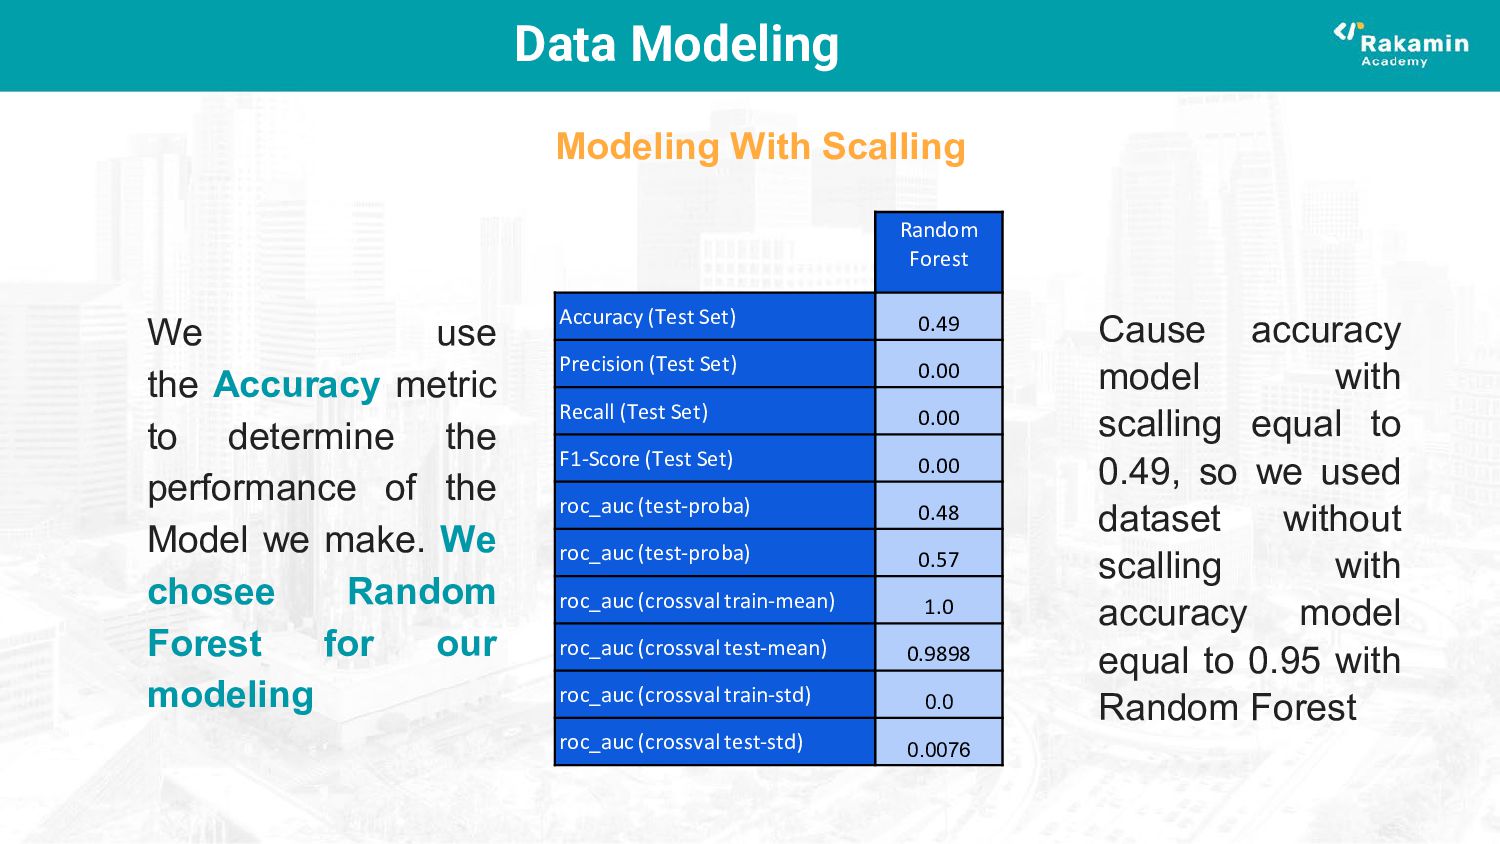
Set) 0.00 Recall (Test Set) 0.00 F1-Score (Test Set) 0.00 roc_auc (test-proba) 0.48 roc_auc (test-proba) 0.57 roc_auc (crossval train-mean) 1.0 roc_auc (crossval test-mean) 0.9898 roc_auc (crossval train-std) 0.0 roc_auc (crossval test-std) 0.0076 We use the Accuracy metric to determine the performance of the Model we make. We chosee Random Forest for our modeling Modeling With Scalling Cause accuracy model with scalling equal to 0.49, so we used dataset without scalling with accuracy model equal to 0.95 with Random Forest
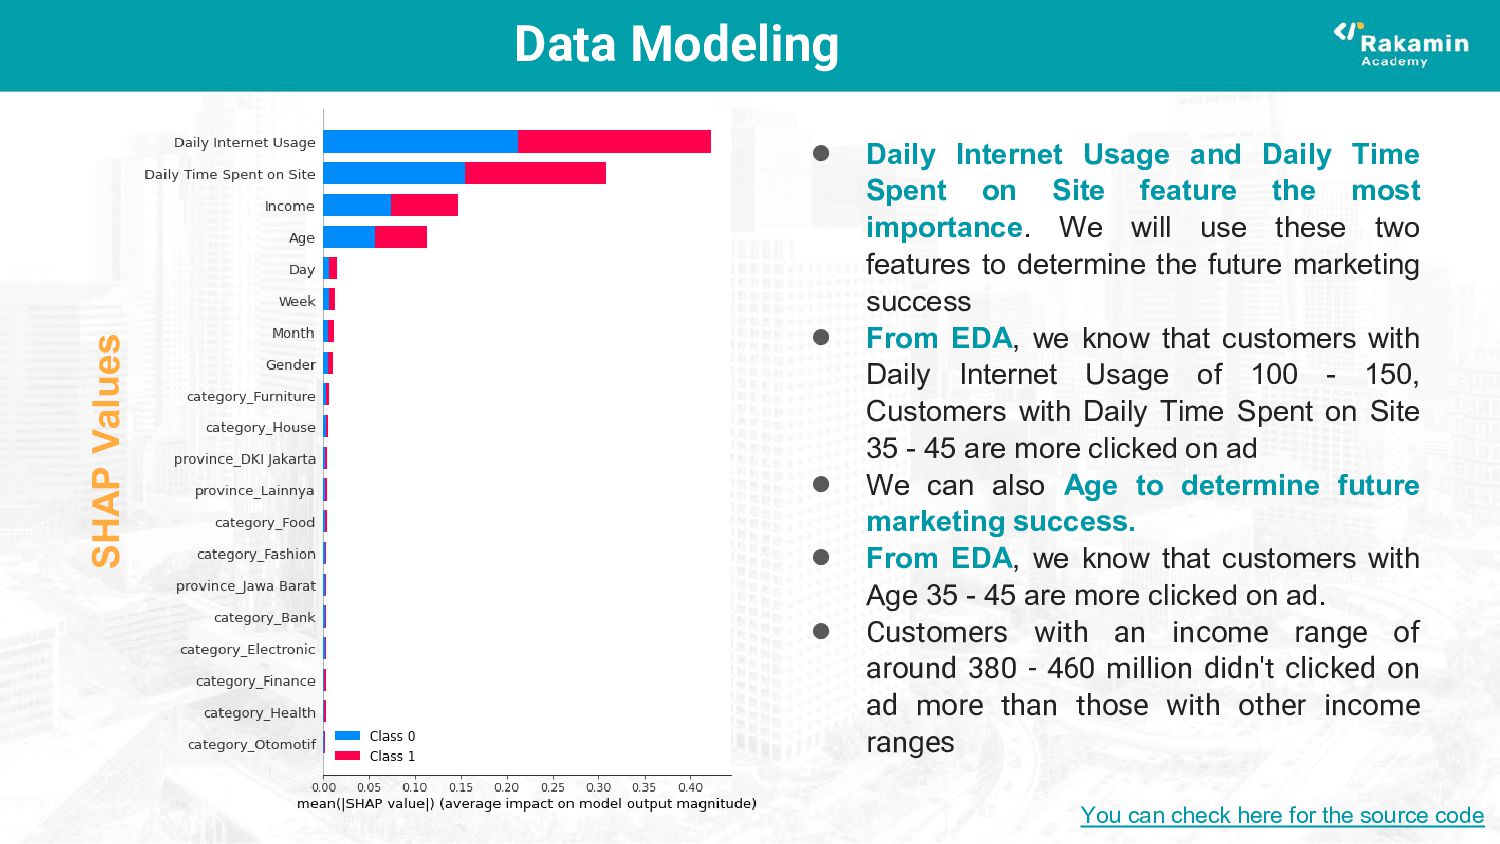
on Site feature the most importance. We will use these two features to determine the future marketing success • From EDA, we know that customers with Daily Internet Usage of 100 - 150, Customers with Daily Time Spent on Site 35 - 45 are more clicked on ad • We can also Age to determine future marketing success. • From EDA, we know that customers with Age 35 - 45 are more clicked on ad. • Customers with an income range of around 380 - 460 million didn't clicked on ad more than those with other income ranges SHAP Values You can check here for the source code
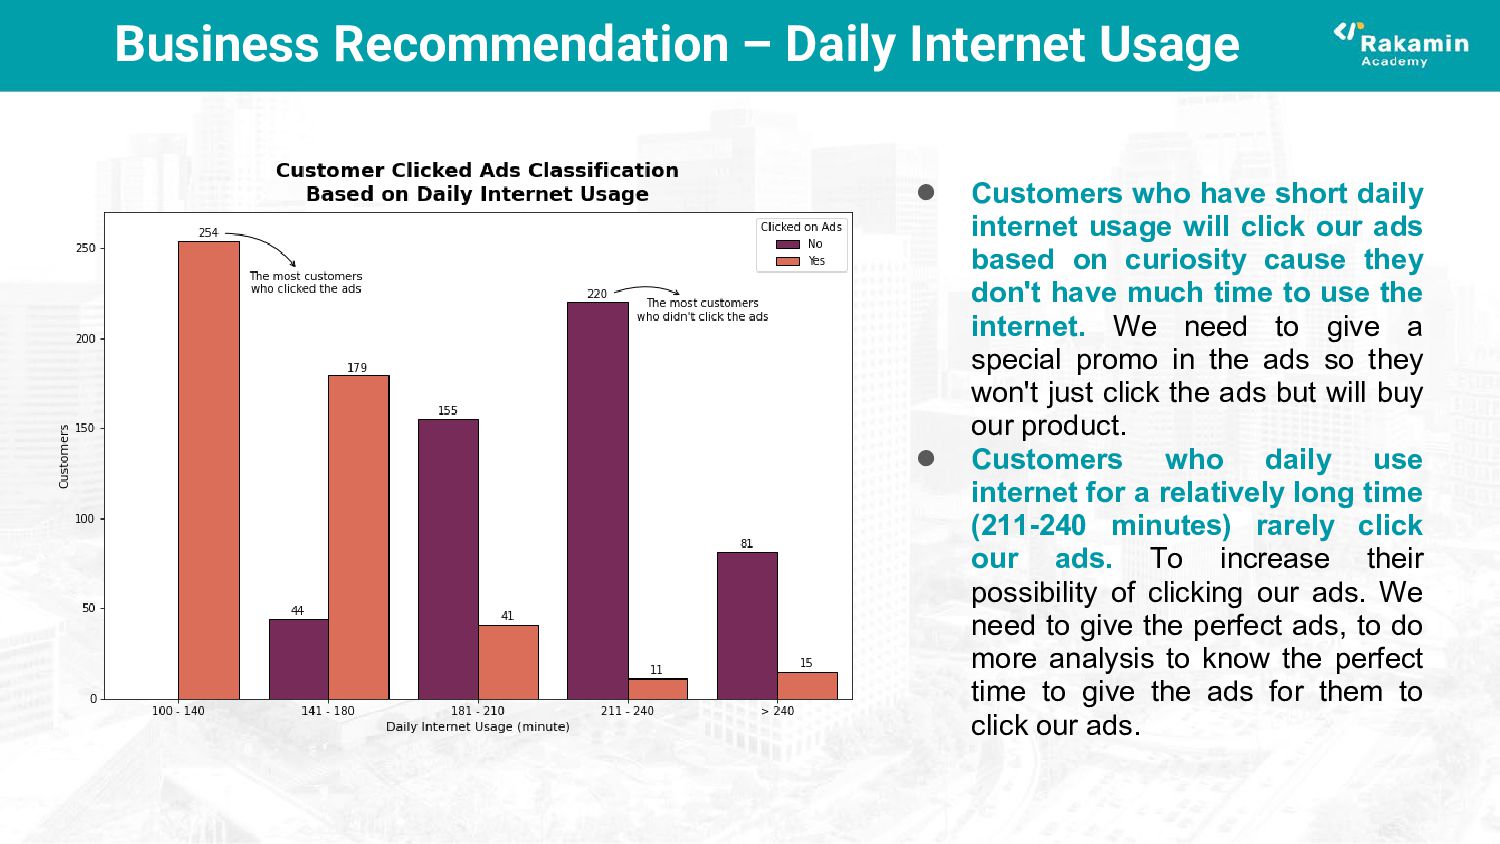
short daily internet usage will click our ads based on curiosity cause they don't have much time to use the internet. We need to give a special promo in the ads so they won't just click the ads but will buy our product. • Customers who daily use internet for a relatively long time (211-240 minutes) rarely click our ads. To increase their possibility of clicking our ads. We need to give the perfect ads, to do more analysis to know the perfect time to give the ads for them to click our ads.
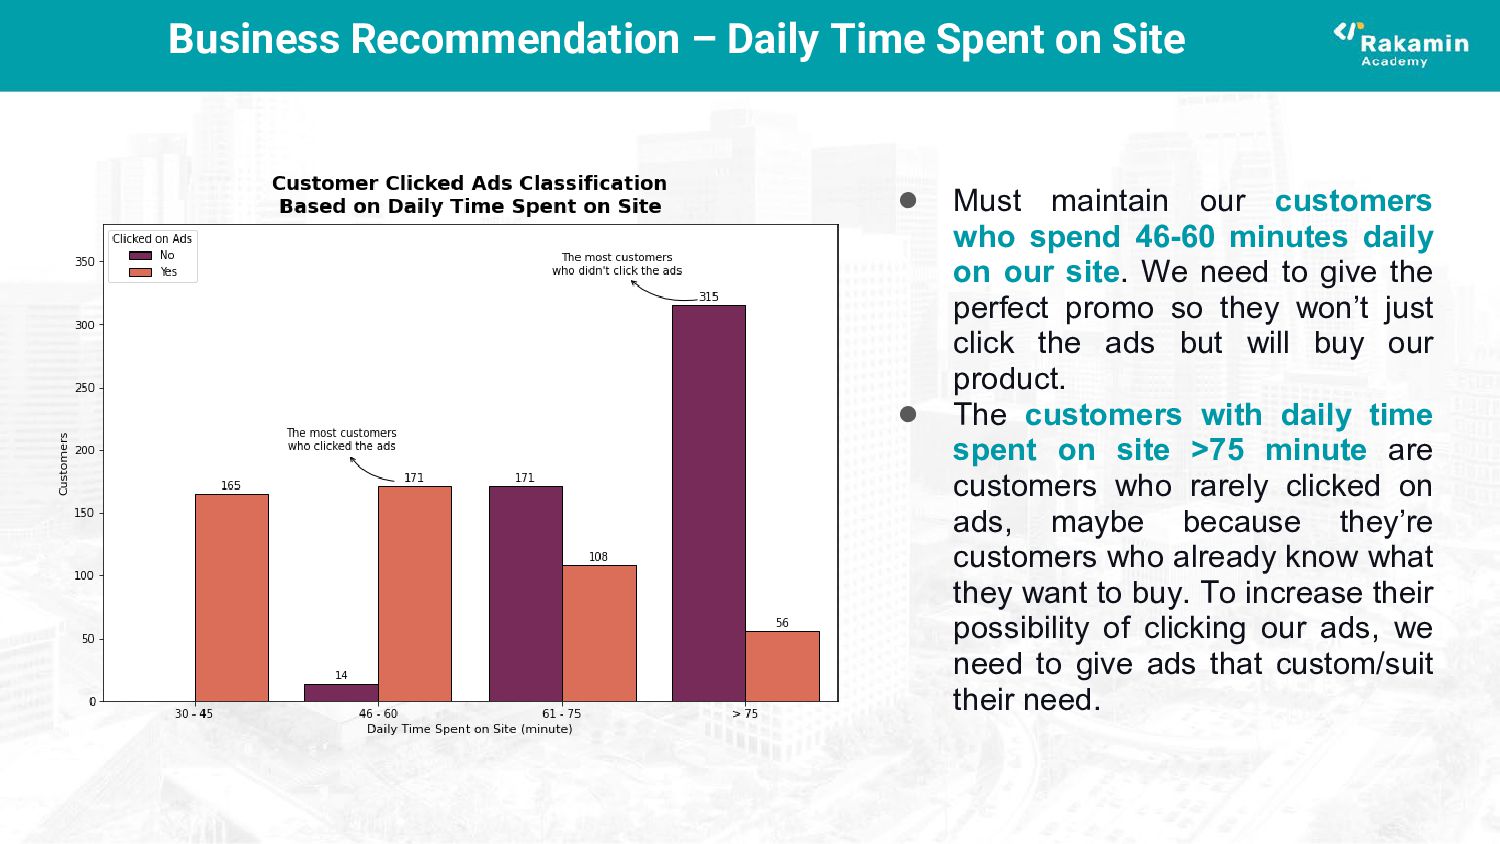
maintain our customers who spend 46-60 minutes daily on our site. We need to give the perfect promo so they won’t just click the ads but will buy our product. • The customers with daily time spent on site >75 minute are customers who rarely clicked on ads, maybe because they’re customers who already know what they want to buy. To increase their possibility of clicking our ads, we need to give ads that custom/suit their need.
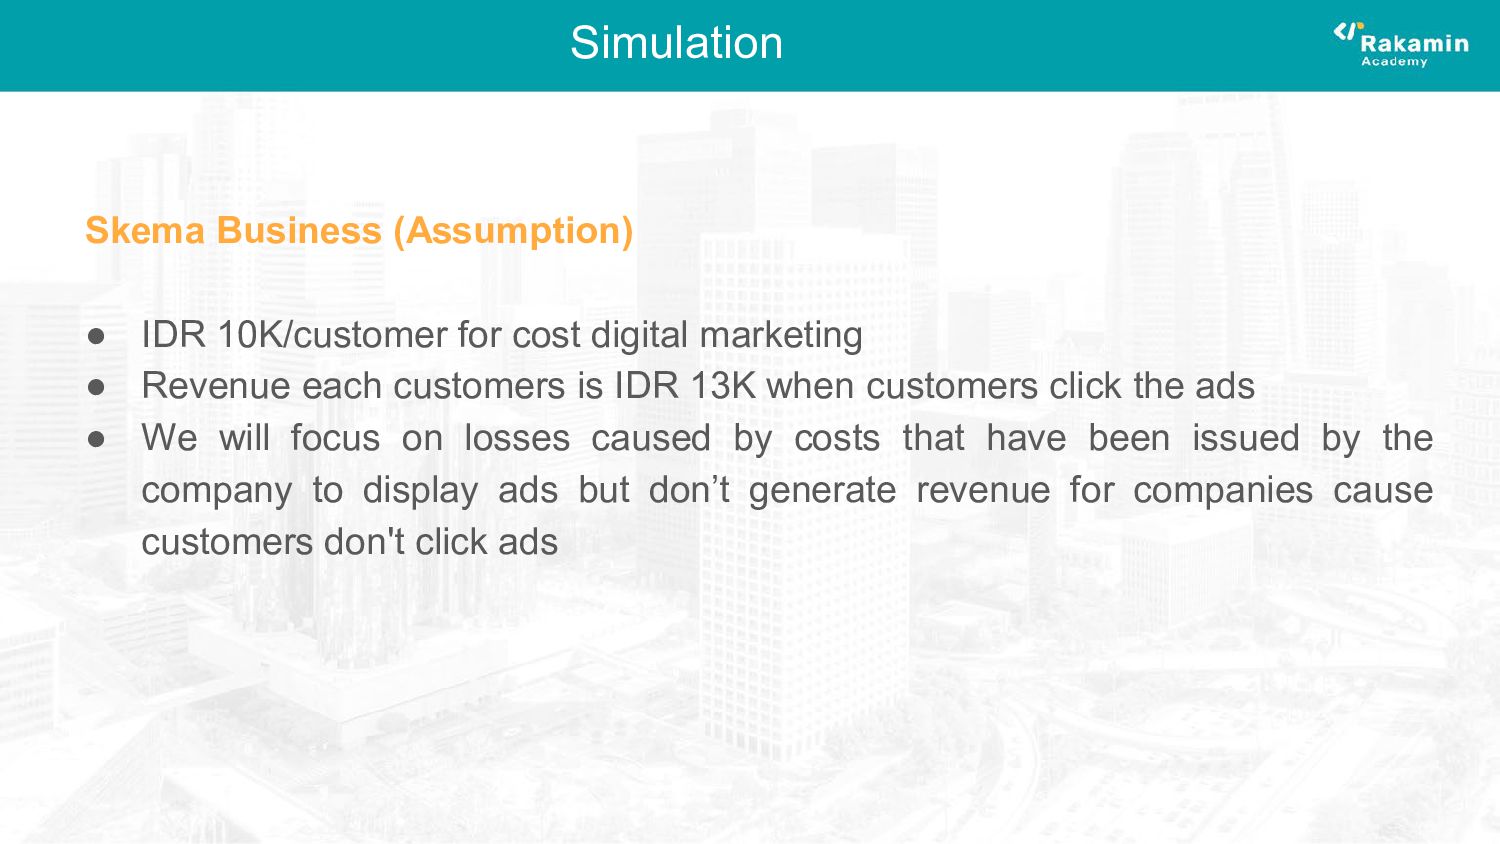
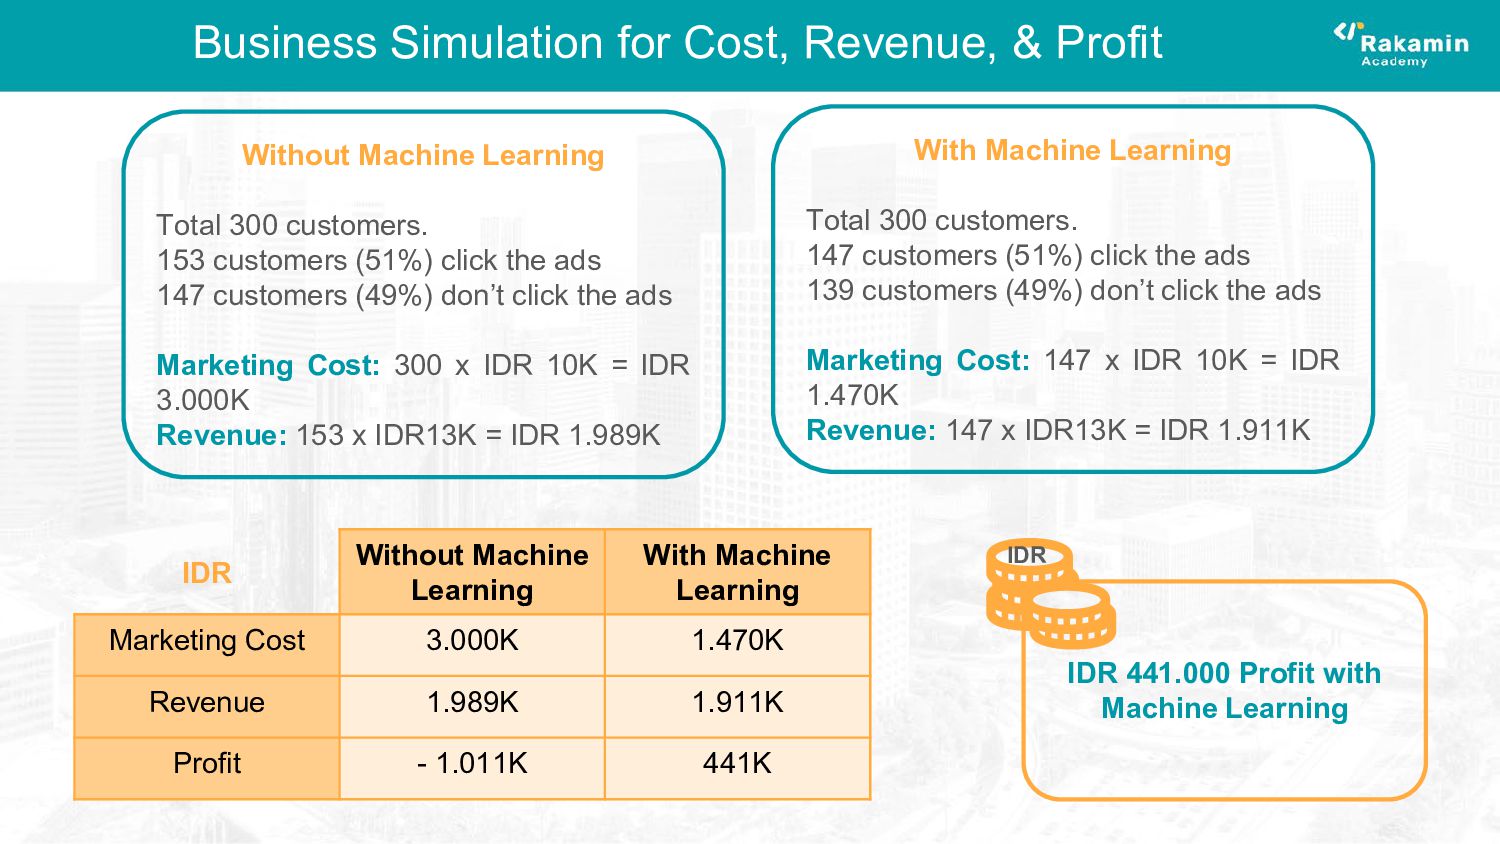
marketing • Revenue each customers is IDR 13K when customers click the ads • We will focus on losses caused by costs that have been issued by the company to display ads but don’t generate revenue for companies cause customers don't click ads
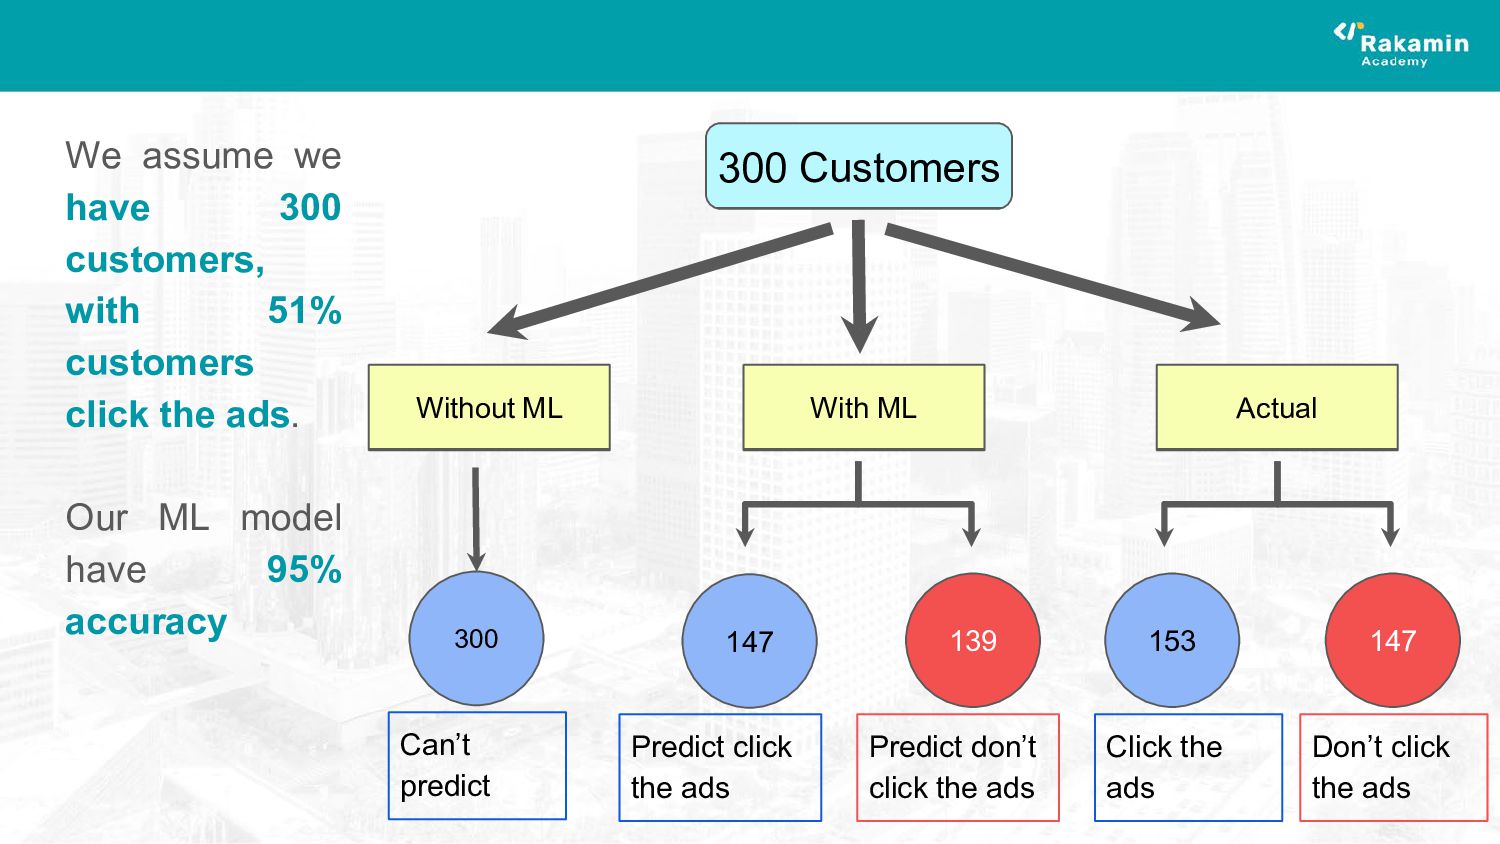
147 147 Can’t predict Predict click the ads Predict don’t click the ads Click the ads Don’t click the ads We assume we have 300 customers, with 51% customers click the ads. Our ML model have 95% accuracy