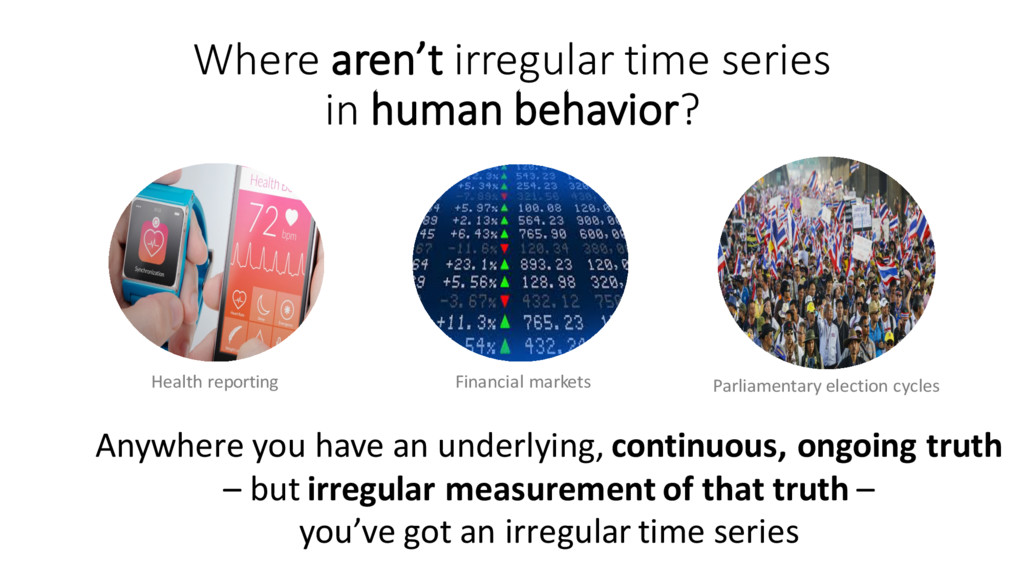
have an underlying, continuous, ongoing truth – but irregular measurement of that truth – you’ve got an irregular time series Health reporting Financial markets Parliamentary election cycles
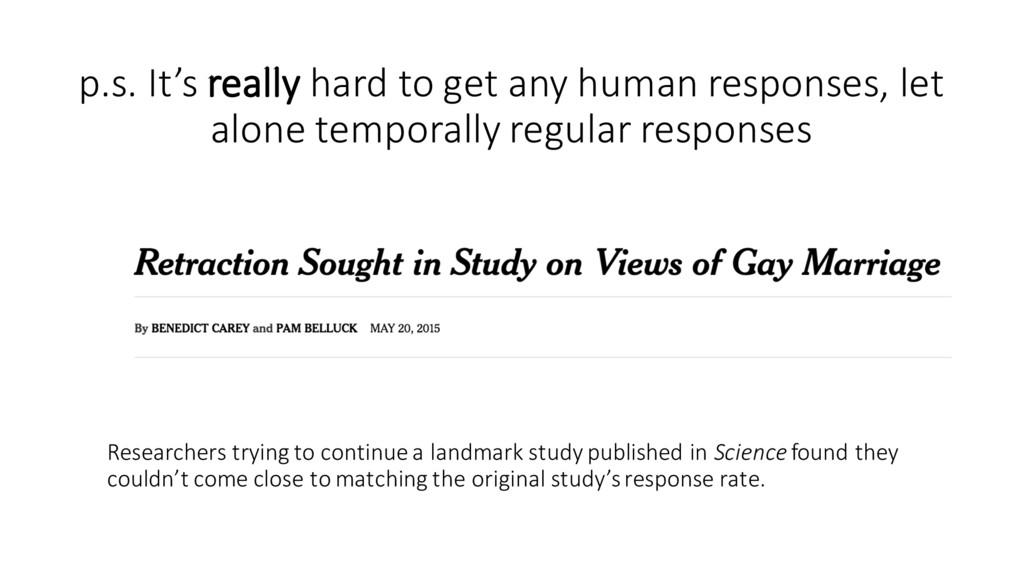
alone temporally regular responses Researchers trying to continue a landmark study published in Science found they couldn’t come close to matching the original study’s response rate.
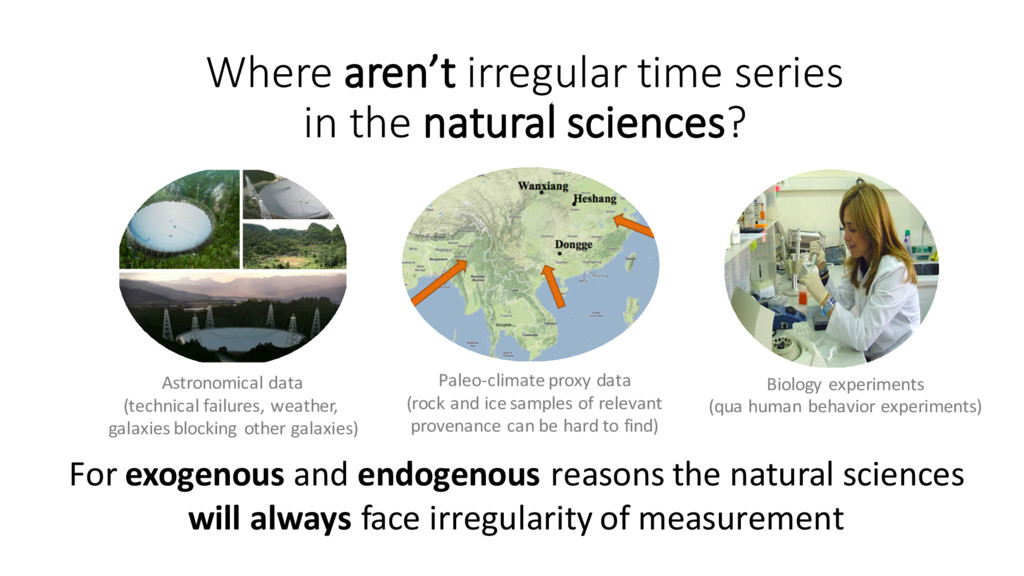
experiments (qua human behavior experiments) For exogenous and endogenous reasons the natural sciences will always face irregularity of measurement Astronomical data (technical failures, weather, galaxies blocking other galaxies) Paleo-climate proxy data (rock and ice samples of relevant provenance can be hard to find)
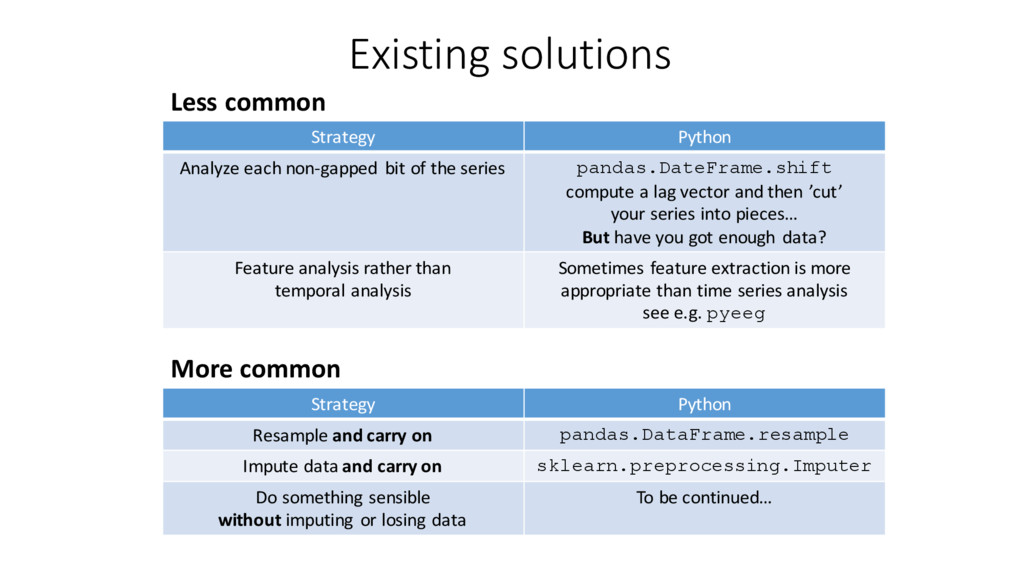
carry on pandas.DataFrame.resample Impute data and carry on sklearn.preprocessing.Imputer Do something sensible without imputing or losing data To be continued… Strategy Python Analyze each non-gapped bit of the series pandas.DateFrame.shift compute a lag vector and then ’cut’ your series into pieces… But have you got enough data? Feature analysis rather than temporal analysis Sometimes feature extraction is more appropriate than time series analysis see e.g. pyeeg
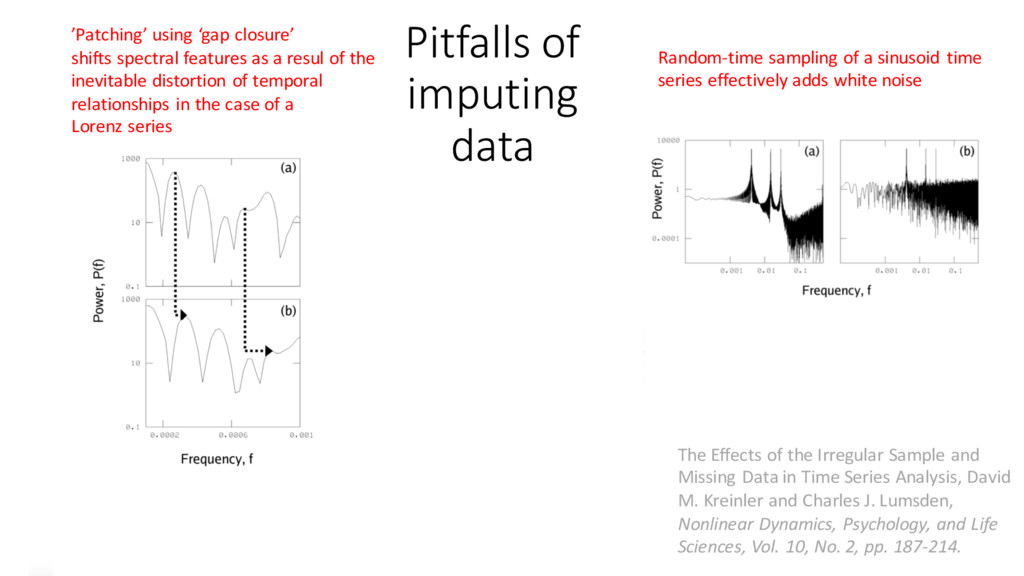
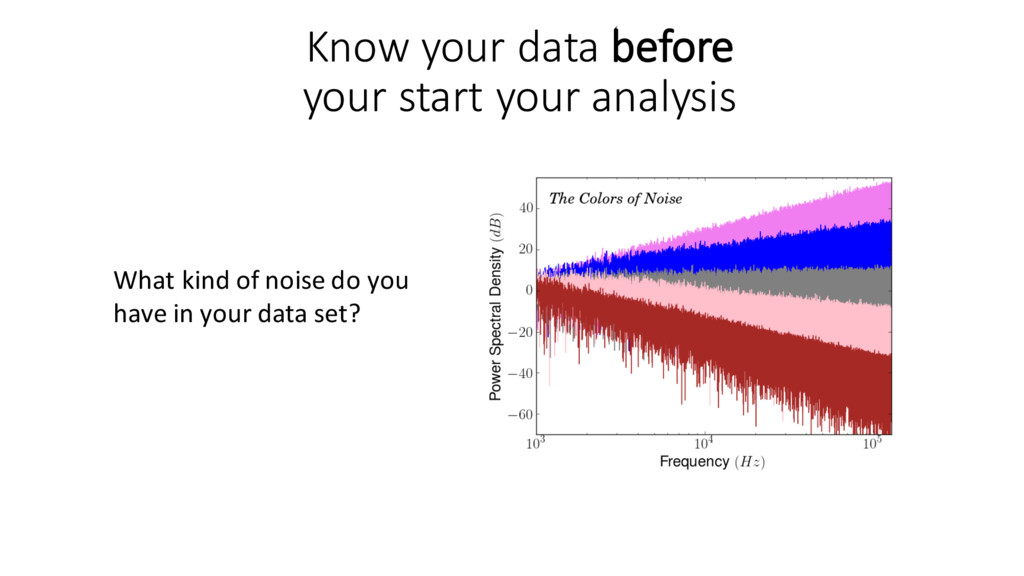
and Missing Data in Time Series Analysis, David M. Kreinler and Charles J. Lumsden, Nonlinear Dynamics, Psychology, and Life Sciences, Vol. 10, No. 2, pp. 187-214. ’Patching’ using ‘gap closure’ shifts spectral features as a resul of the inevitable distortion of temporal relationships in the case of a Lorenz series Random-time sampling of a sinusoid time series effectively adds white noise
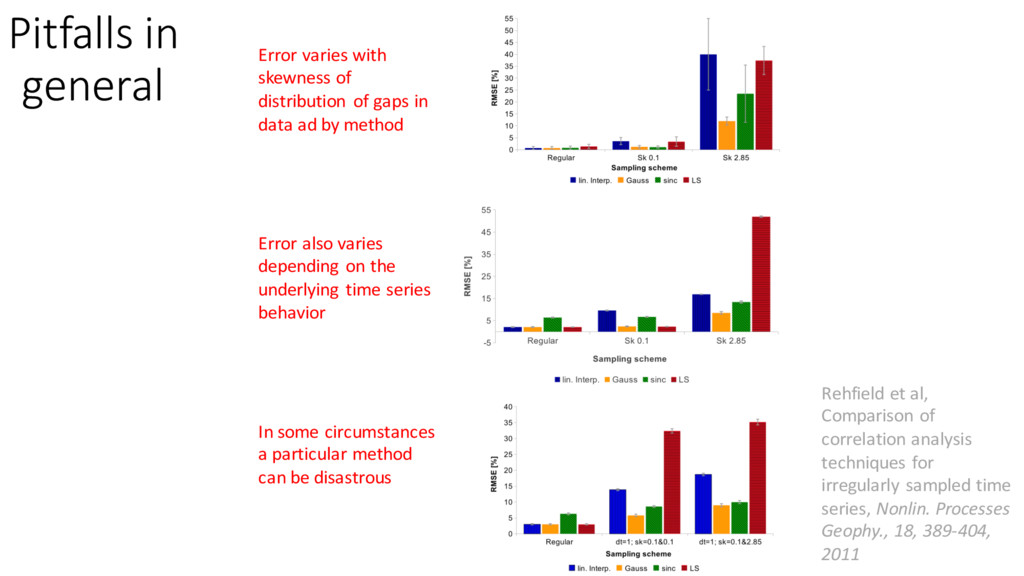
ad by method Pitfalls in general Rehfield et al, Comparison of correlation analysis techniques for irregularly sampled time series, Nonlin. Processes Geophy., 18, 389-404, 2011 Error also varies depending on the underlying time series behavior In some circumstances a particular method can be disastrous
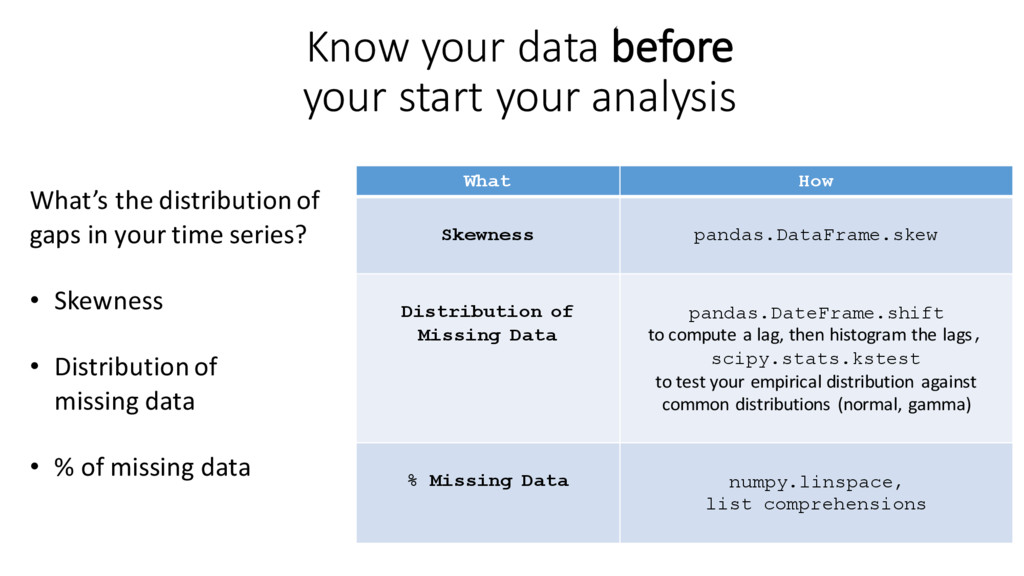
distribution of gaps in your time series? • Skewness • Distribution of missing data • % of missing data What How Skewness pandas.DataFrame.skew Distribution of Missing Data pandas.DateFrame.shift to compute a lag, then histogram the lags, scipy.stats.kstest to test your empirical distribution against common distributions (normal, gamma) % Missing Data numpy.linspace, list comprehensions
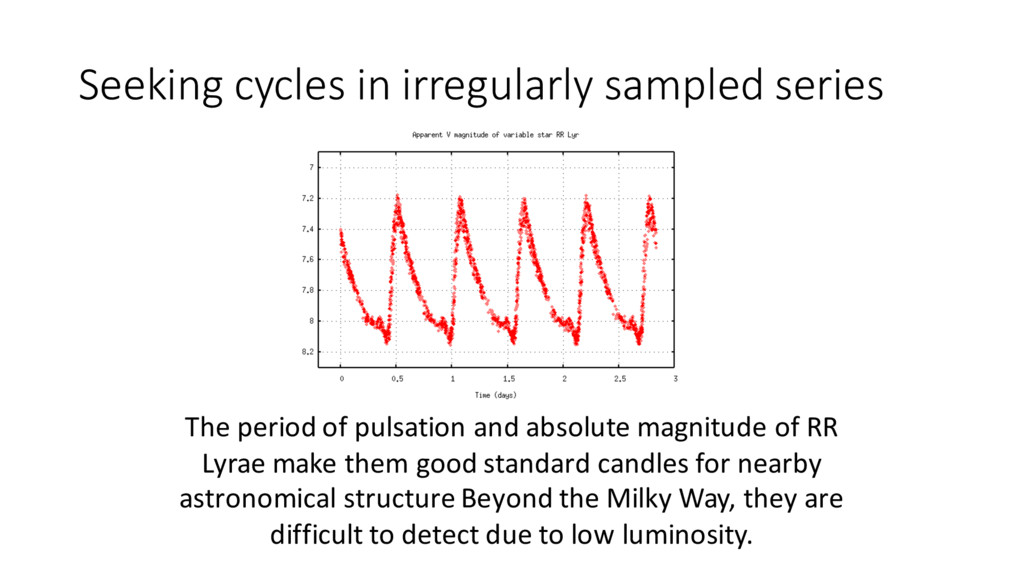
and absolute magnitude of RR Lyrae make them good standard candles for nearby astronomical structure Beyond the Milky Way, they are difficult to detect due to low luminosity.
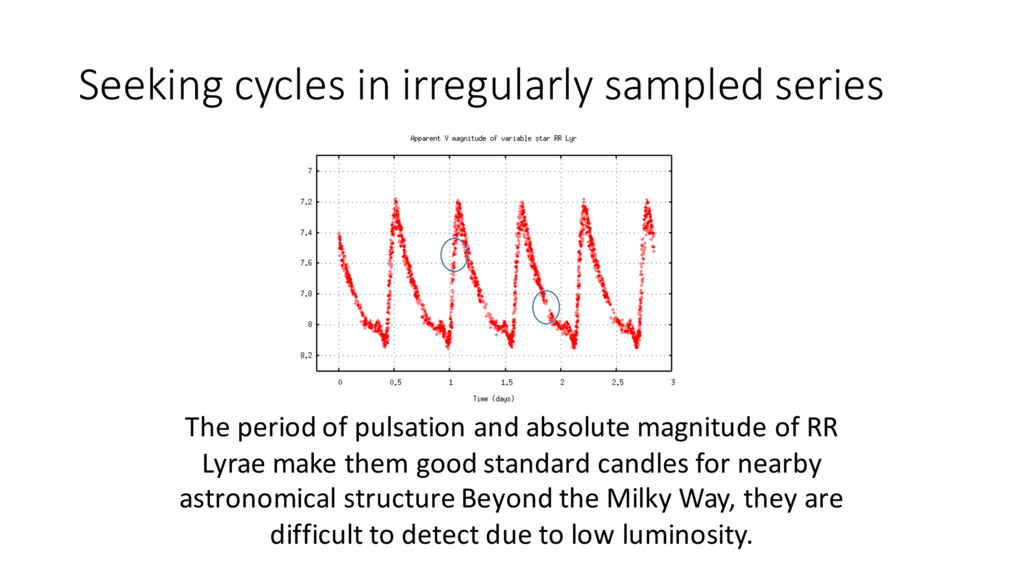
and absolute magnitude of RR Lyrae make them good standard candles for nearby astronomical structure Beyond the Milky Way, they are difficult to detect due to low luminosity.
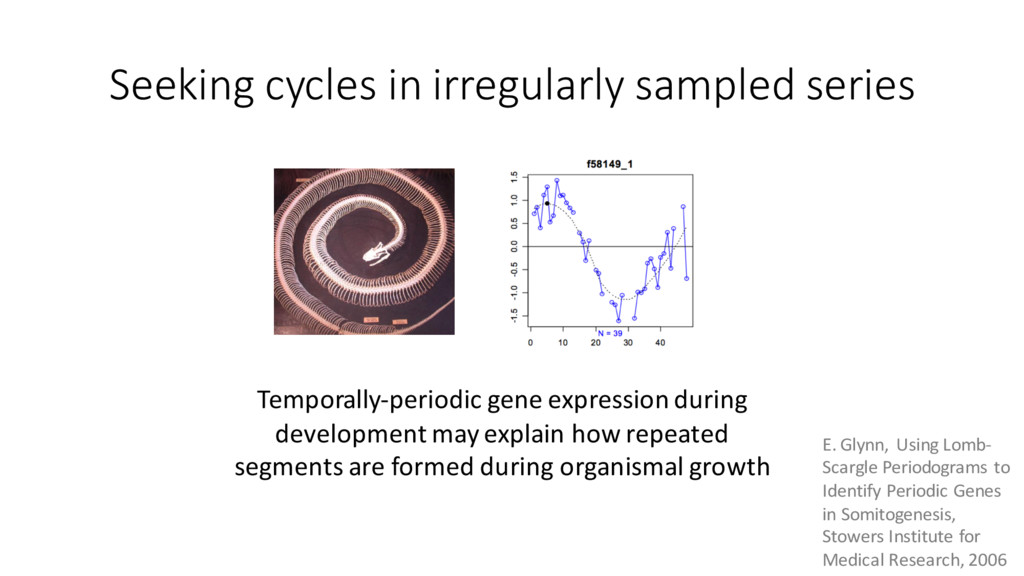
development may explain how repeated segments are formed during organismal growth E. Glynn, Using Lomb- Scargle Periodograms to Identify Periodic Genes in Somitogenesis, Stowers Institute for Medical Research, 2006
Scargle Periodograms to Identify Periodic Genes in Somitogenesis, Stowers Institute for Medical Research, 2006 Temporally-periodic gene expression during development may explain how repeated segments are formed during organismal growth
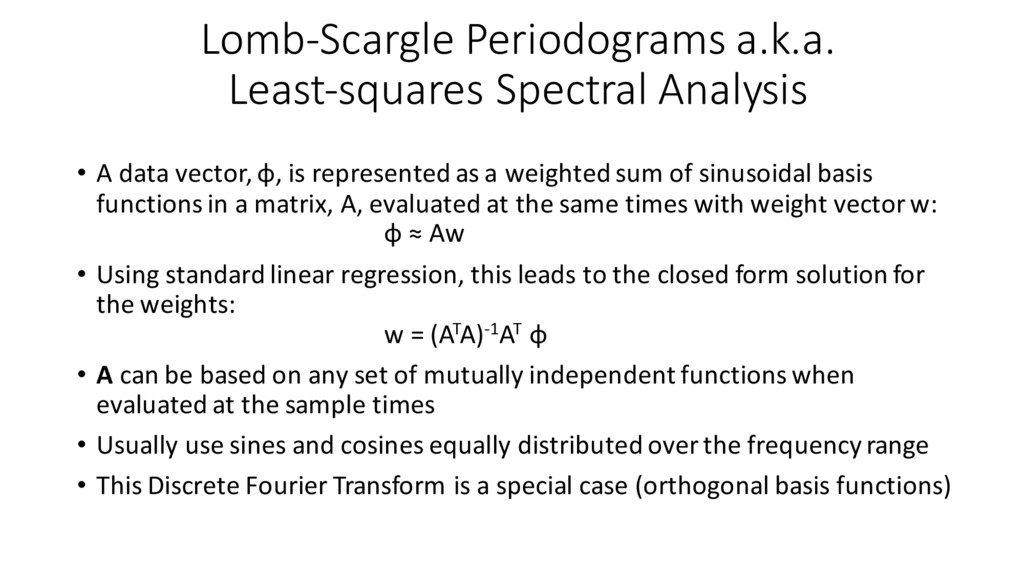
φ, is represented as a weighted sum of sinusoidal basis functions in a matrix, A, evaluated at the same times with weight vector w: φ ≈ Aw • Using standard linear regression, this leads to the closed form solution for the weights: w = (ATA)-1AT φ • A can be based on any set of mutually independent functions when evaluated at the sample times • Usually use sines and cosines equally distributed over the frequency range • This Discrete Fourier Transform is a special case (orthogonal basis functions)
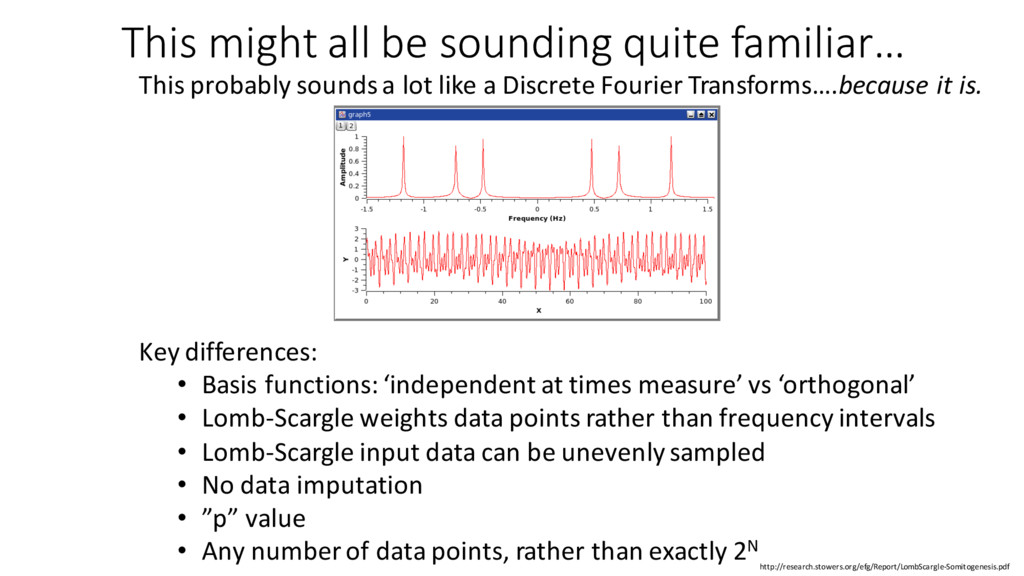
sounds a lot like a Discrete Fourier Transforms….because it is. Key differences: • Basis functions: ‘independent at times measure’ vs ‘orthogonal’ • Lomb-Scargle weights data points rather than frequency intervals • Lomb-Scargle input data can be unevenly sampled • No data imputation • ”p” value • Any number of data points, rather than exactly 2N
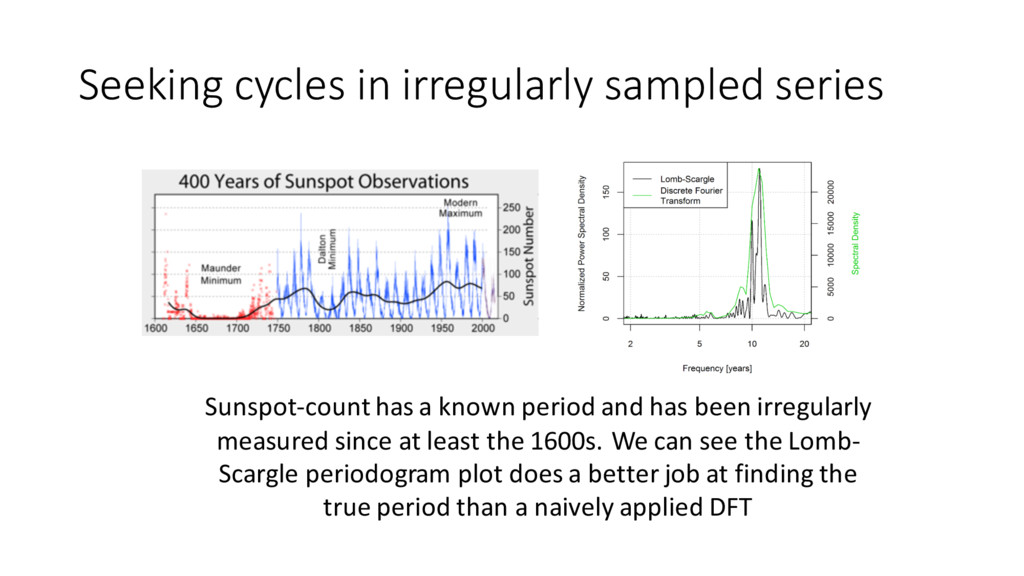
period and has been irregularly measured since at least the 1600s. We can see the Lomb- Scargle periodogram plot does a better job at finding the true period than a naively applied DFT
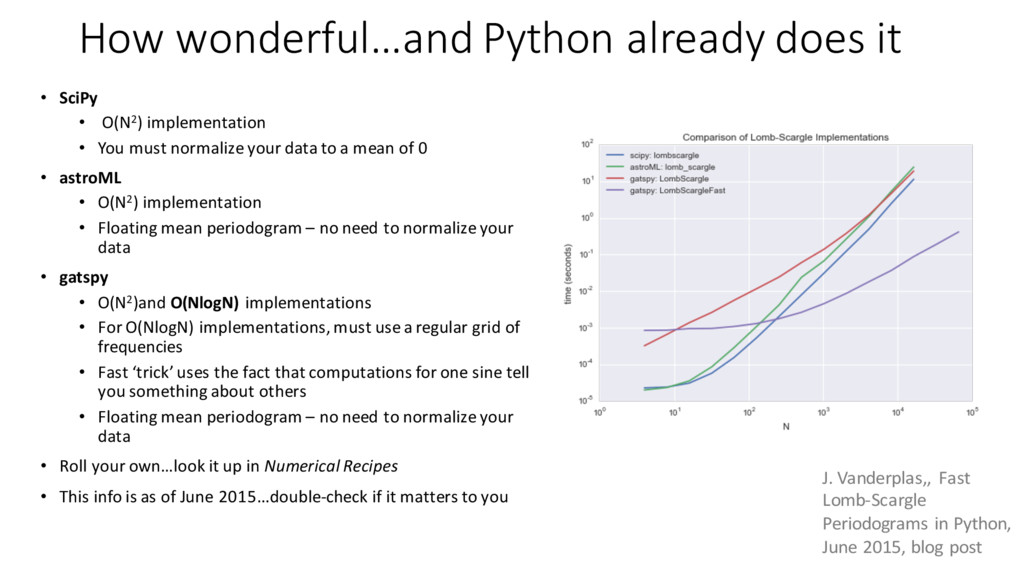
implementation • You must normalize your data to a mean of 0 • astroML • O(N2) implementation • Floating mean periodogram – no need to normalize your data • gatspy • O(N2)and O(NlogN) implementations • For O(NlogN) implementations, must use a regular grid of frequencies • Fast ‘trick’ uses the fact that computations for one sine tell you something about others • Floating mean periodogram – no need to normalize your data • Roll your own…look it up in Numerical Recipes • This info is as of June 2015...double-check if it matters to you J. Vanderplas,, Fast Lomb-Scargle Periodograms in Python, June 2015, blog post
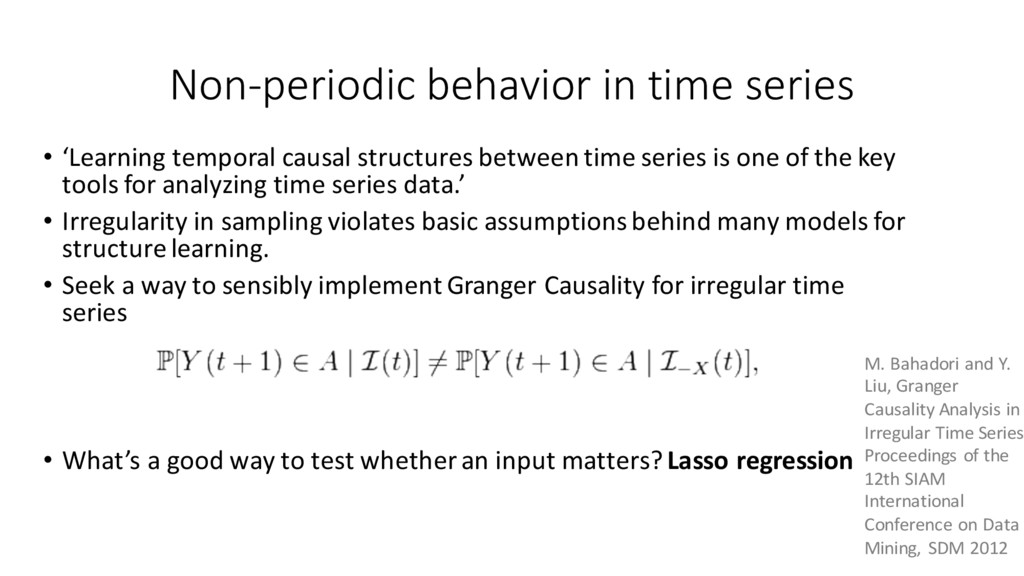
between time series is one of the key tools for analyzing time series data.’ • Irregularity in sampling violates basic assumptions behind many models for structure learning. • Seek a way to sensibly implement Granger Causality for irregular time series • What’s a good way to test whether an input matters? Lasso regression M. Bahadori and Y. Liu, Granger Causality Analysis in Irregular Time Series Proceedings of the 12th SIAM International Conference on Data Mining, SDM 2012
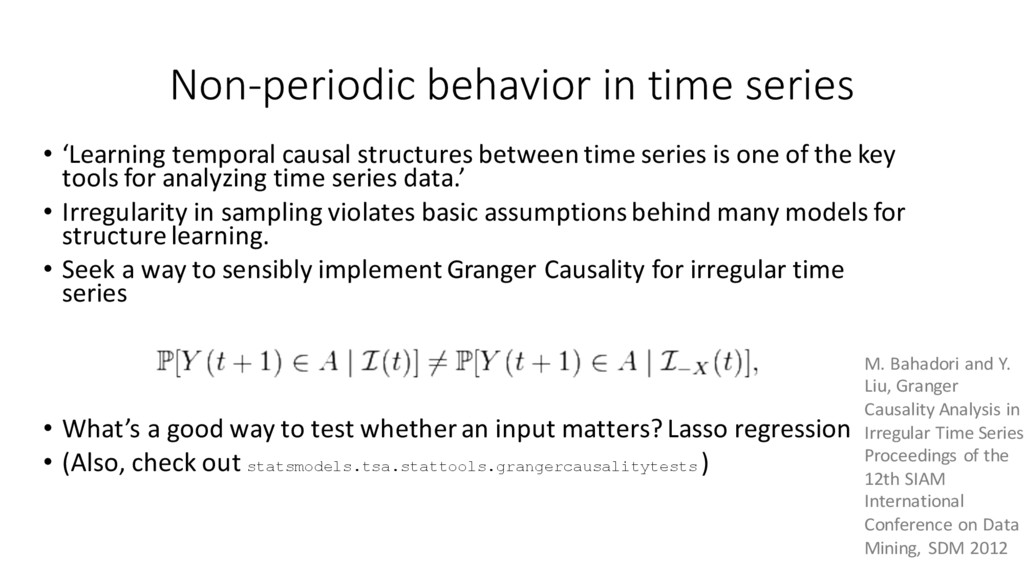
between time series is one of the key tools for analyzing time series data.’ • Irregularity in sampling violates basic assumptions behind many models for structure learning. • Seek a way to sensibly implement Granger Causality for irregular time series • What’s a good way to test whether an input matters? Lasso regression • (Also, check out statsmodels.tsa.stattools.grangercausalitytests ) M. Bahadori and Y. Liu, Granger Causality Analysis in Irregular Time Series Proceedings of the 12th SIAM International Conference on Data Mining, SDM 2012
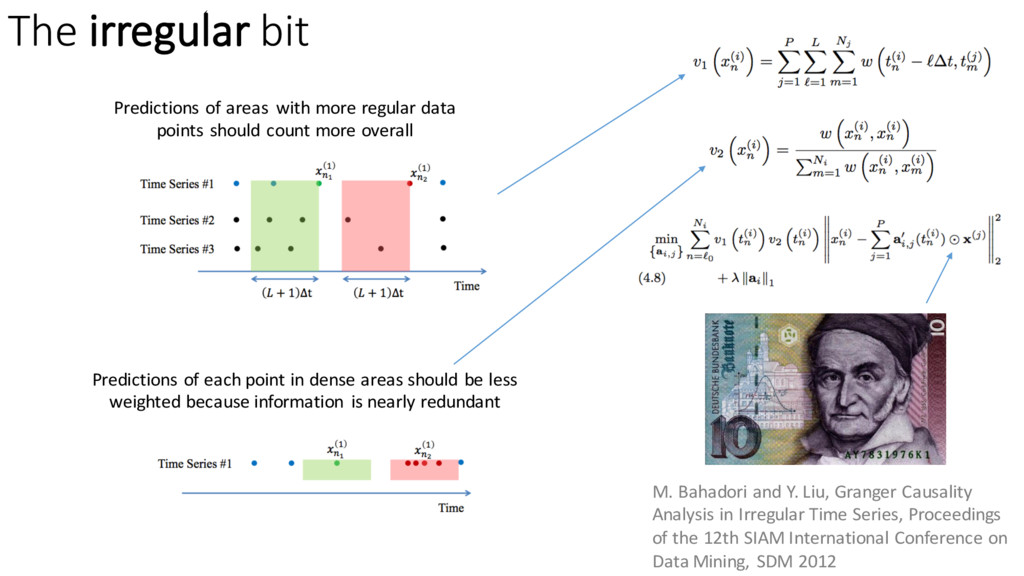
Analysis in Irregular Time Series, Proceedings of the 12th SIAM International Conference on Data Mining, SDM 2012 Predictions of areas with more regular data points should count more overall Predictions of each point in dense areas should be less weighted because information is nearly redundant