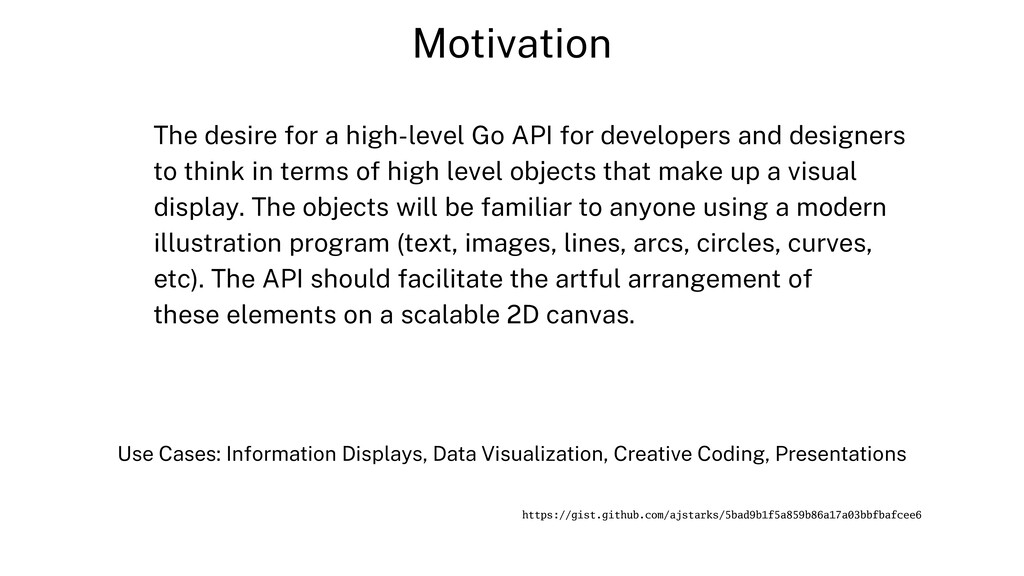
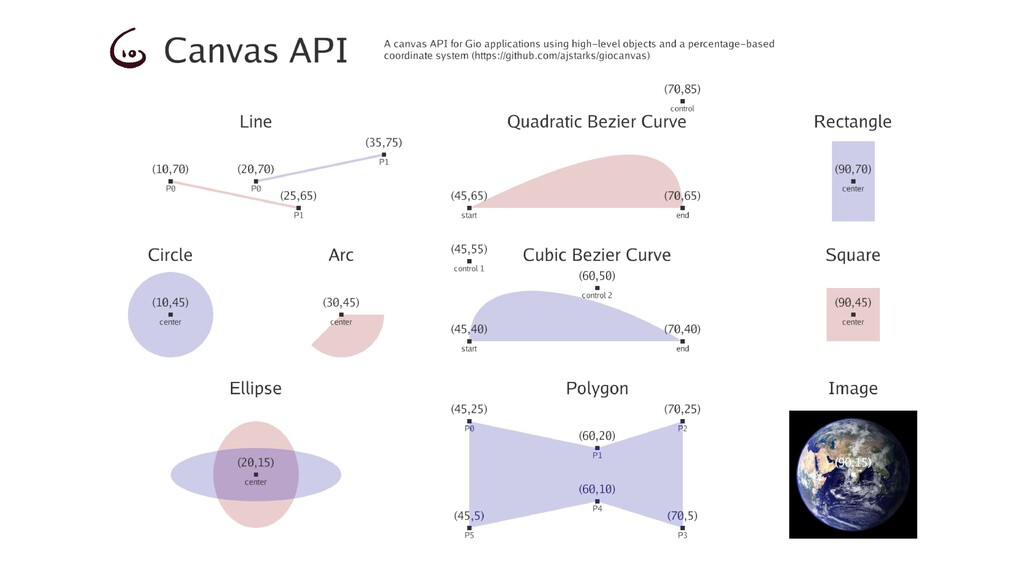
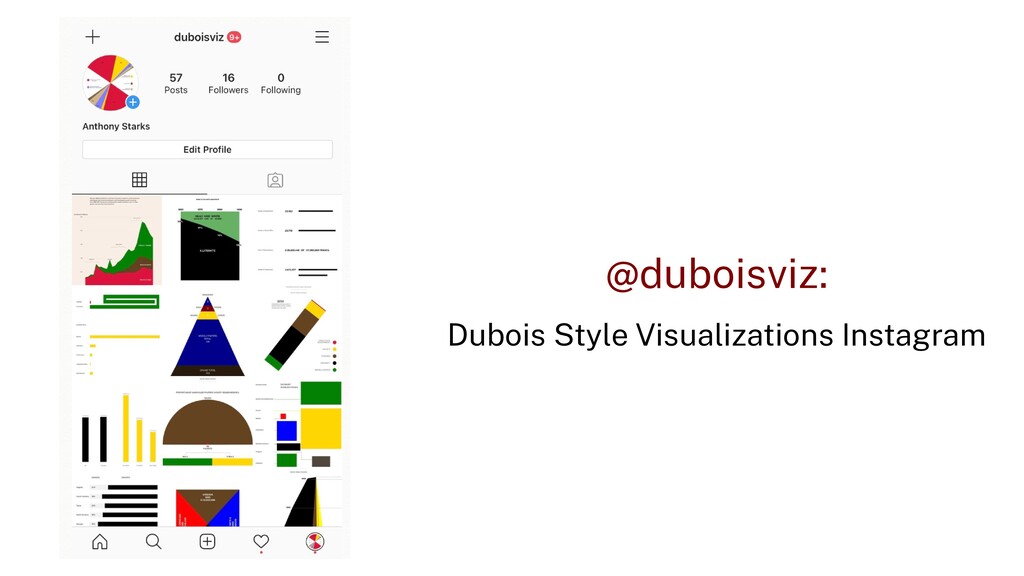
and designers to think in terms of high level objects that make up a visual display. The objects will be familiar to anyone using a modern illustration program (text, images, lines, arcs, circles, curves, etc). The API should facilitate the artful arrangement of these elements on a scalable 2D canvas. Use Cases: Information Displays, Data Visualization, Creative Coding, Presentations https://gist.github.com/ajstarks/5bad9b1f5a859b86a17a03bbfbafcee6
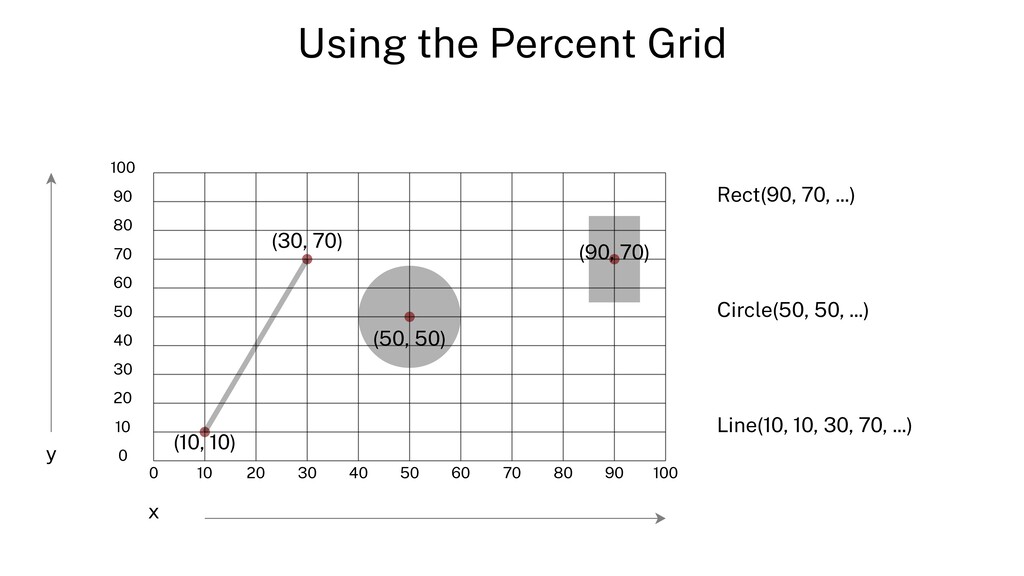
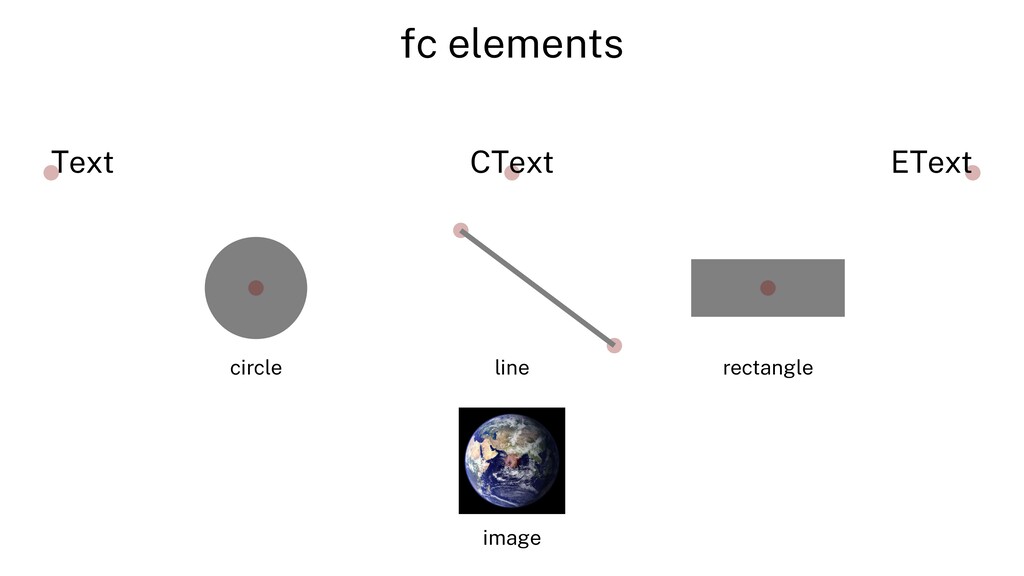
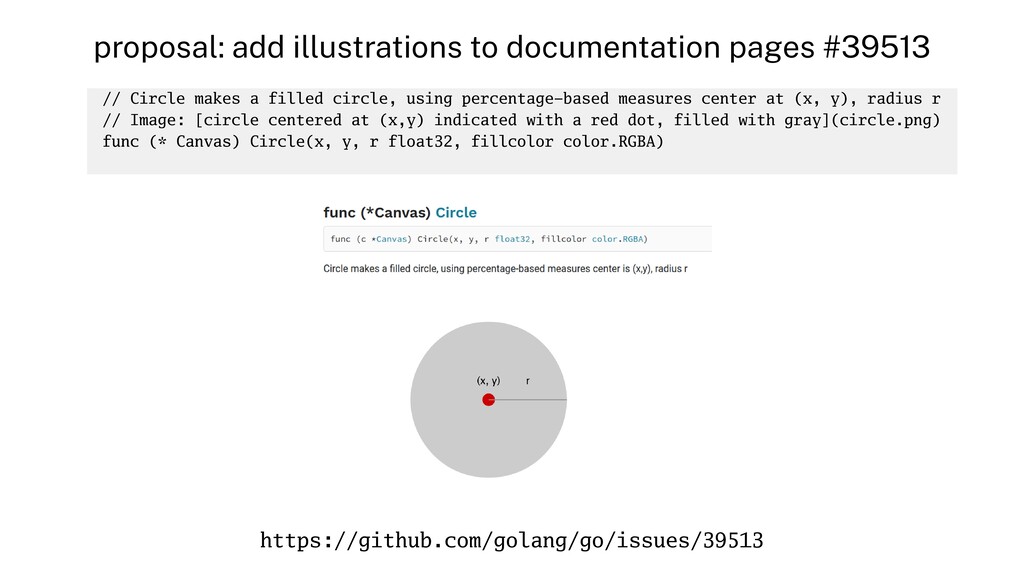
a filled circle, using percentage-based measures center at (x, y), radius r // Image: [circle centered at (x,y) indicated with a red dot, filled with gray](circle.png) func (* Canvas) Circle(x, y, r float32, fillcolor color.RGBA) https://github.com/golang/go/issues/39513