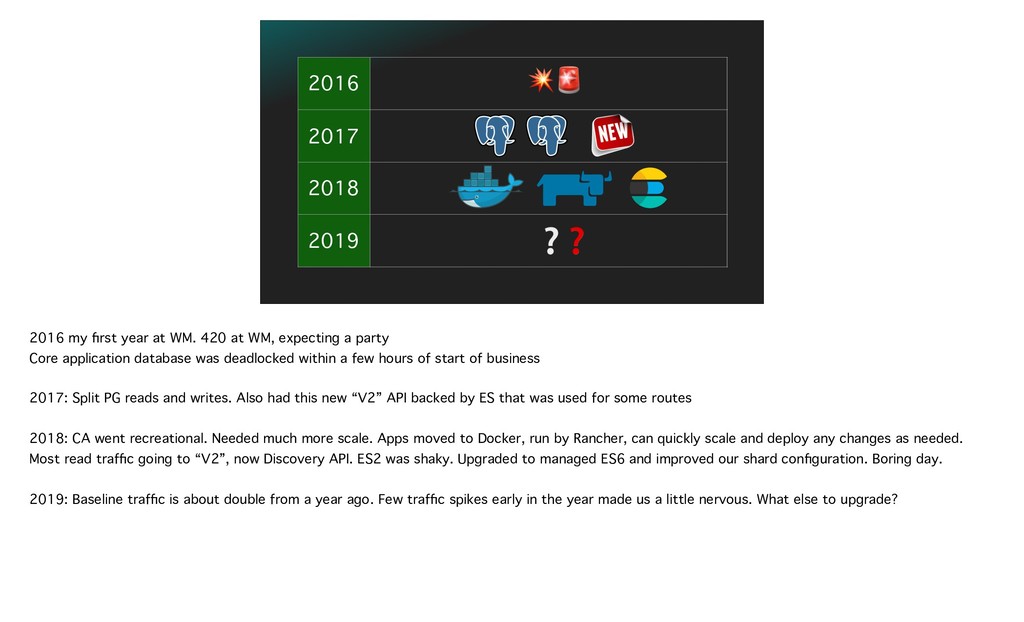
This is a sponsored talk by Weedmaps.
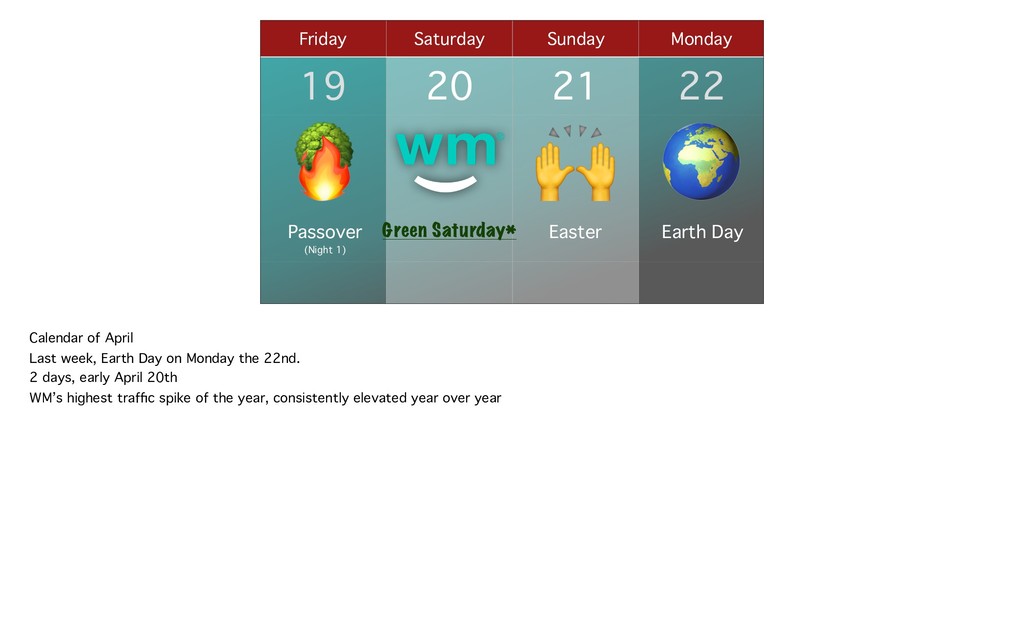
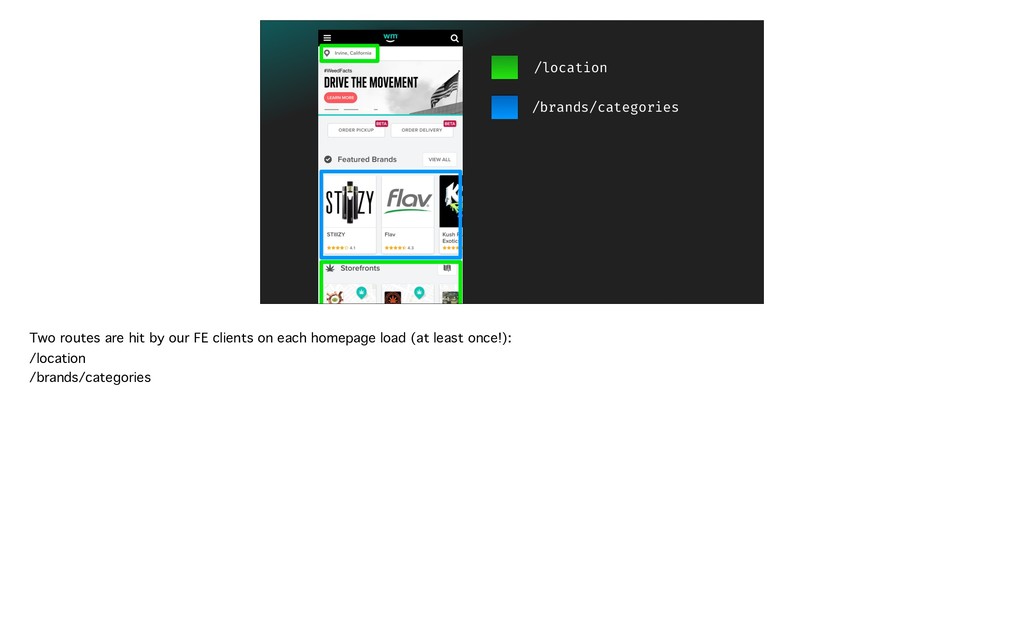
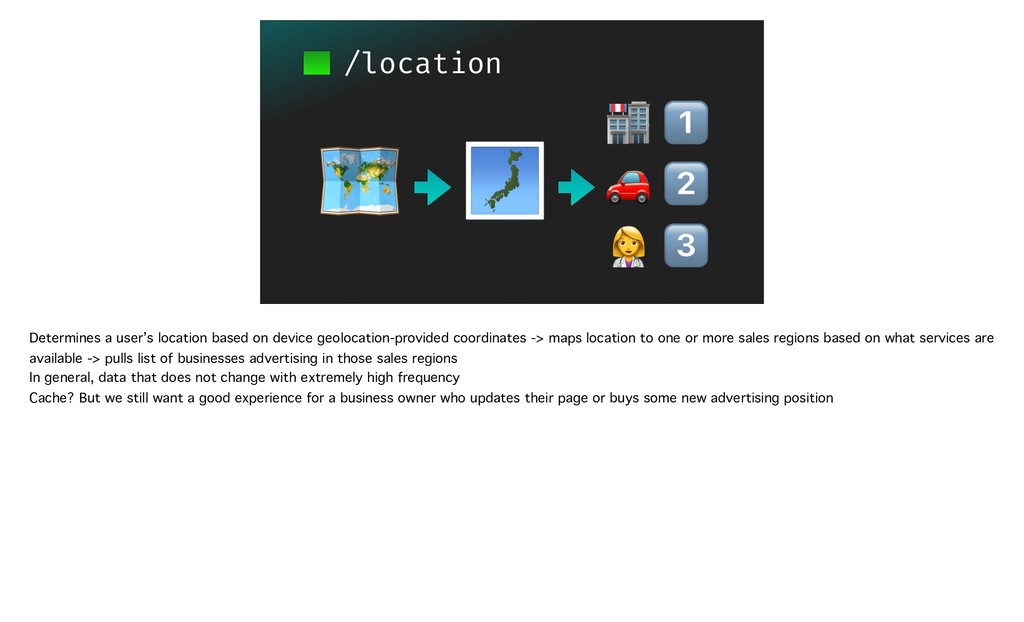
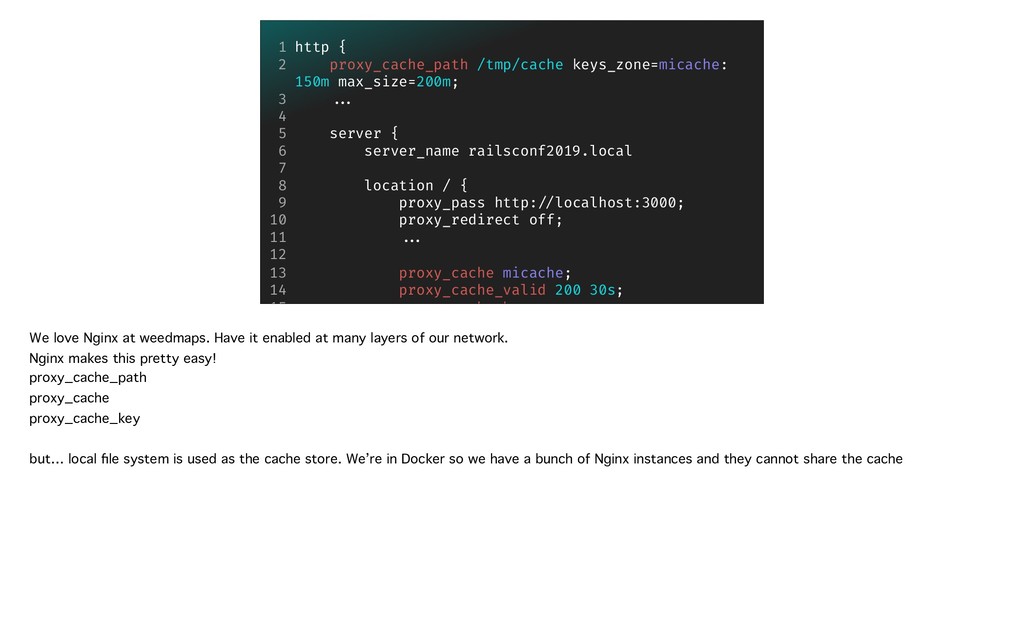
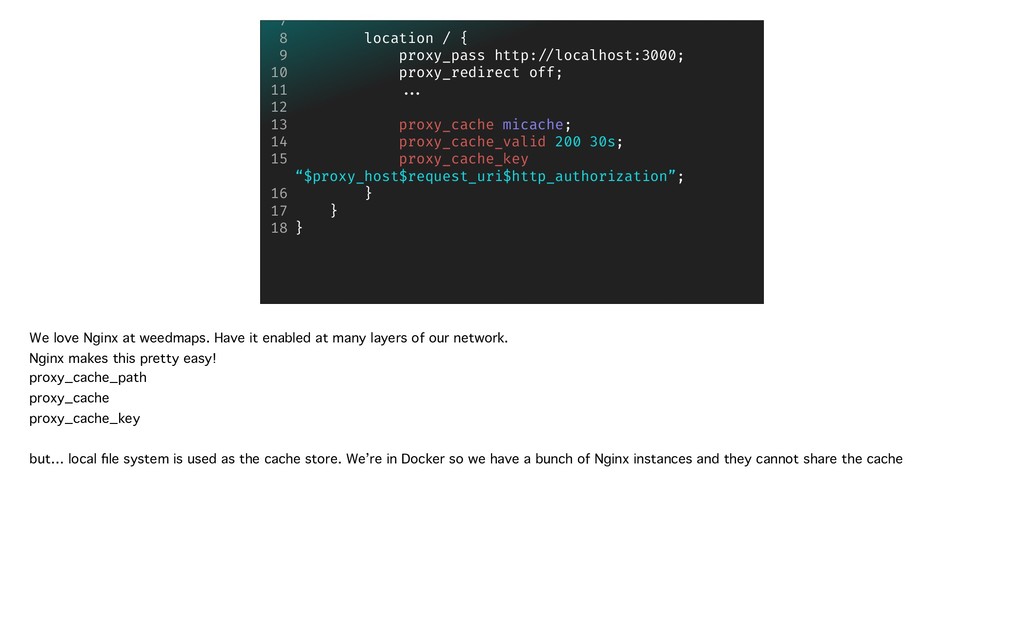
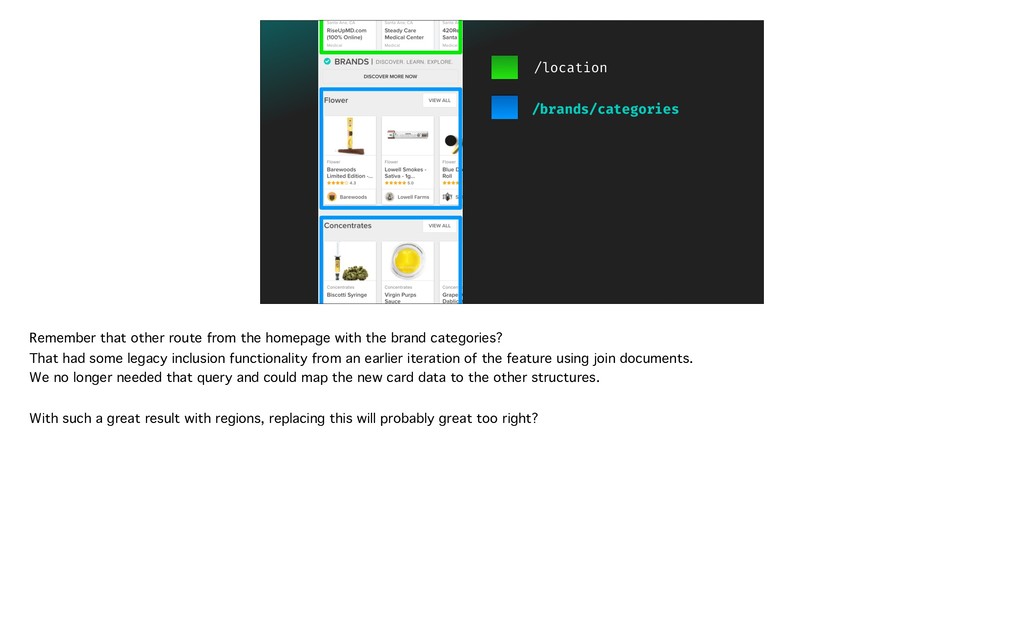
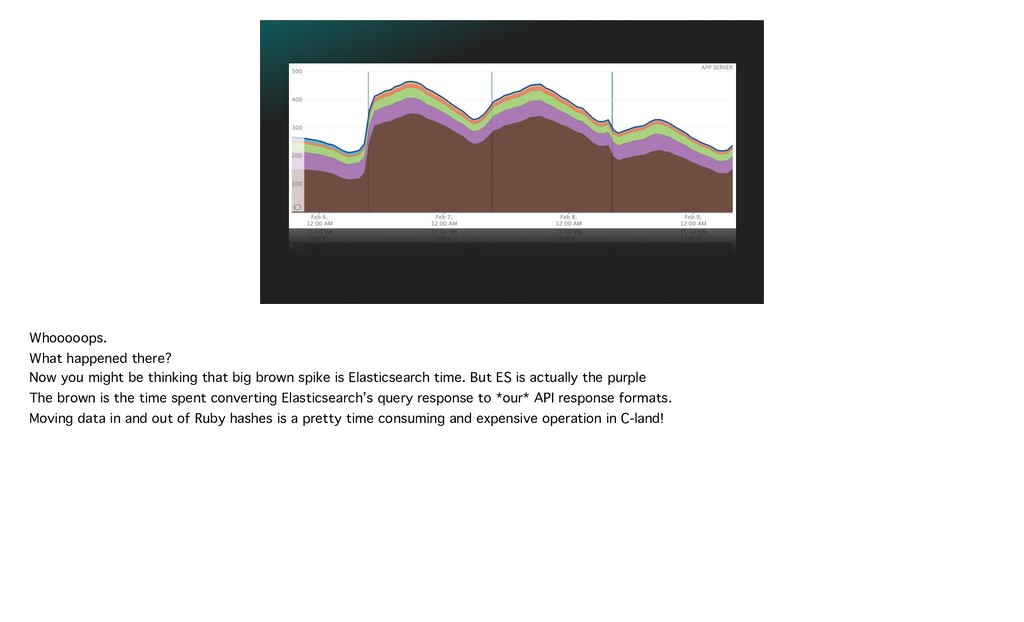
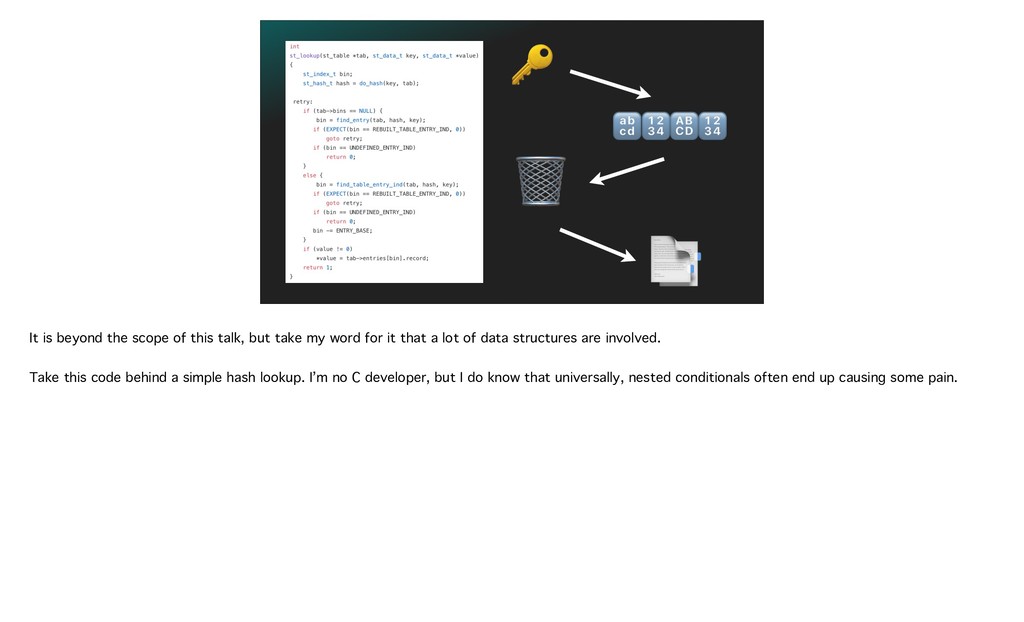
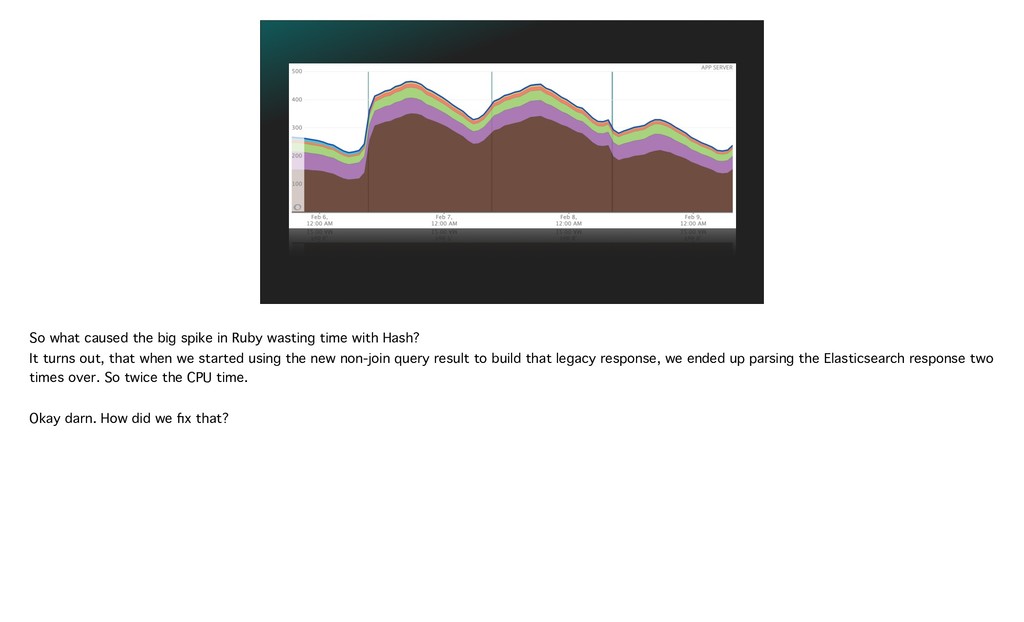
Every April, we observe Earth Day and celebrate our planet’s beauty and resources, its oceans and trees. But only days earlier, another kind of tree is celebrated, and Weedmaps experiences its highest traffic of the year. Come see techniques we’ve used recently to lighten the latency on our most requested routes ahead of the elevated demand. Do you cache your API responses but want a lift in your hit ratio? Does that Elasticsearch best practice you know you’re ignoring cause nerves? We’ll pass our solutions to these problems—on the lefthand side.
![coord_params = params.permit(:latitude, :longitude).to_h rounded = Types ::LatLon[coord_params].round(4) Query ::Region.new(intersects_with:](https://files.speakerdeck.com/presentations/0275a62c23ff4042bfec50fbc656c6ef/slide_18.jpg)
![coord_params = params.permit(:latitude, :longitude).to_h rounded = Types ::LatLon[coord_params].round(4) cache_key =](https://files.speakerdeck.com/presentations/0275a62c23ff4042bfec50fbc656c6ef/slide_25.jpg)
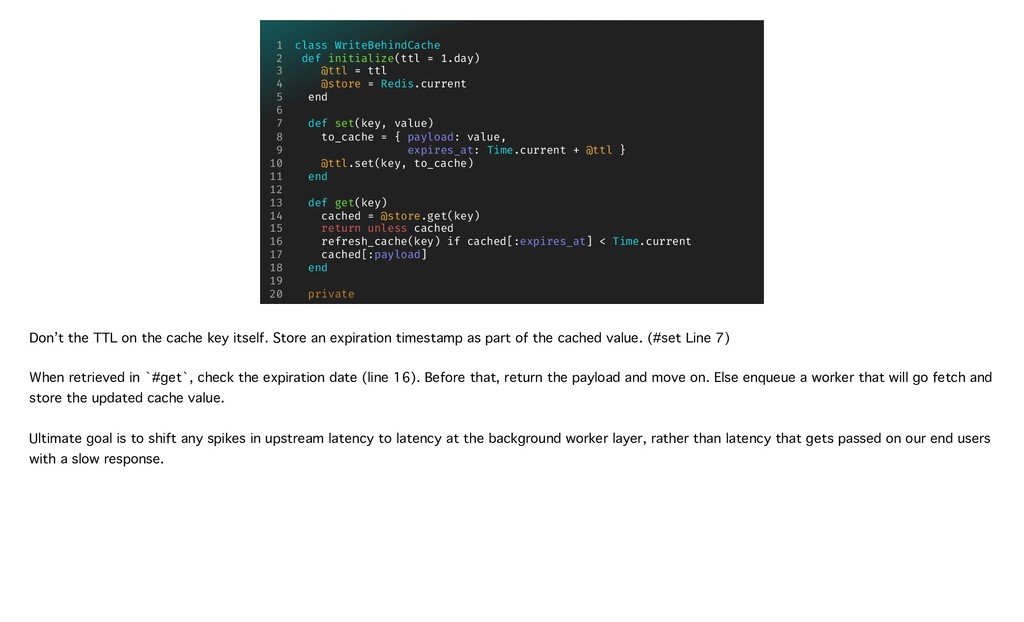
![cached[:payload] end private def refresh_cache(key) WriteBehindRefresher.perform_later(key, @ttl) end end class](https://files.speakerdeck.com/presentations/0275a62c23ff4042bfec50fbc656c6ef/slide_29.jpg)