Upgrade to Pro — share decks privately, control downloads, hide ads and more …

The Geodemographics of Use and Engagement with the Internet

alexsingleton
November 06, 2014

The Geodemographics of Use and Engagement with the Internet

Talk at the Market Research Society, London; 5/11/14

alexsingleton

November 06, 2014
Tweet

More Decks by alexsingleton

Other Decks in Education

Transcript

  1. www.cdrc.ac.uk www.alex-singleton.com @alexsingleton Consumer Data Research Centre An ESRC Data

    Investment Alex Singleton Department of Geography and Planning The Geodemographics of Use and Engagement with the Internet
  2. Does this household have access to the Internet - Yes,

    have access at present −12.5 −10.0 −7.5 −5.0 −2.5 0.0 2.5 5.0 7.5 10.0 12.5 1a: Rural Retirement 1b: Farming Communities 1c: Country Life 2a: Aspirational Migrants 2b: Student Communities 2c: Settled City Living 3a: Urban Deprivation 3b: Connected Achievers 3c: Aspirational Multicultural Families 3d: Challenged Ethnic Mix 4a: Blue Collar Estates 4b: Blue Collar Transitions 4c: Blue Collar Terraces 5a: Socially Mobile Minorities 5b: Ethnic Communities 6a: Inner Suburbs 6b: Established Suburbs 6c: Suburban Aspiration 7a: Industrial Legacy 7b: Hard−Pressed Multi−Ethnic Neighbourhoods 7c: Elderly in Flats 8a: Traditional Trades 8b: Service Sector Urbanities 8c: Late Retirement Output Area Classification 2011 % Difference From National Average Oxford Internet Institute Survey
  3. Previous Work • The “e-Society” • 1990s – Technology Use

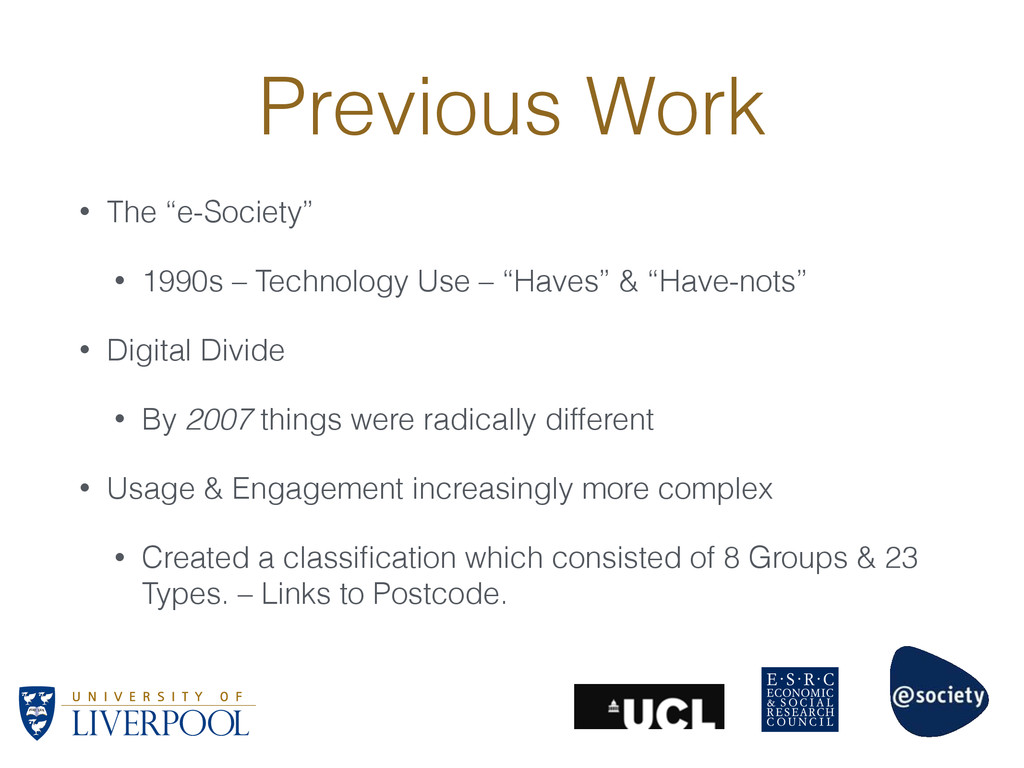
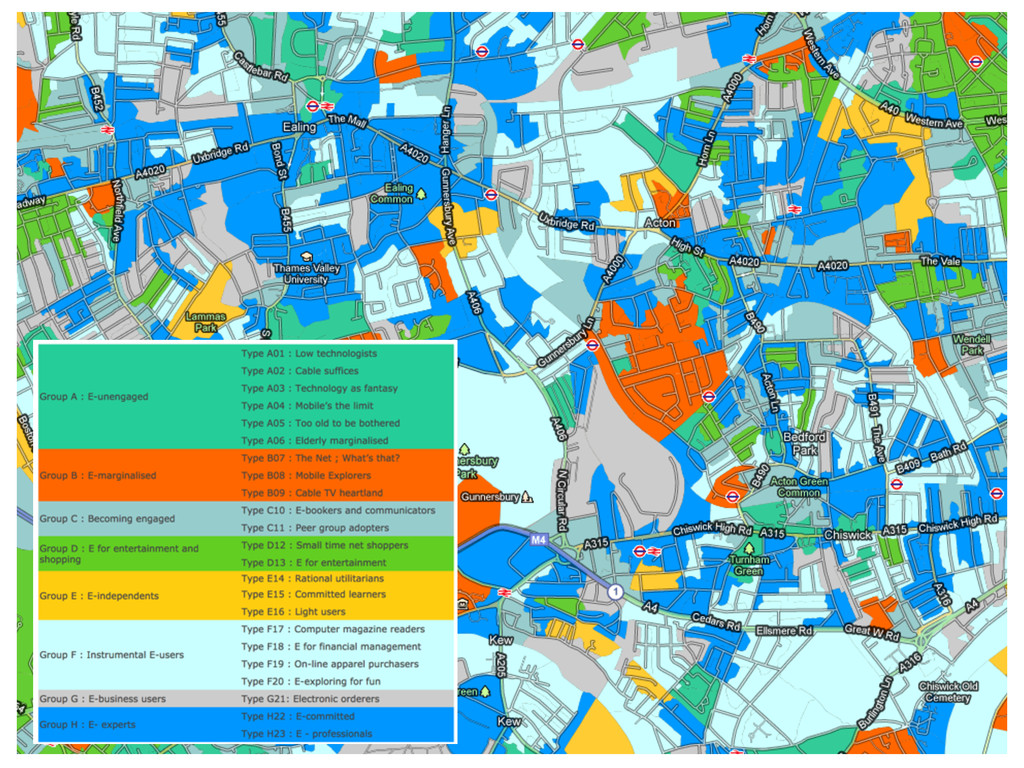
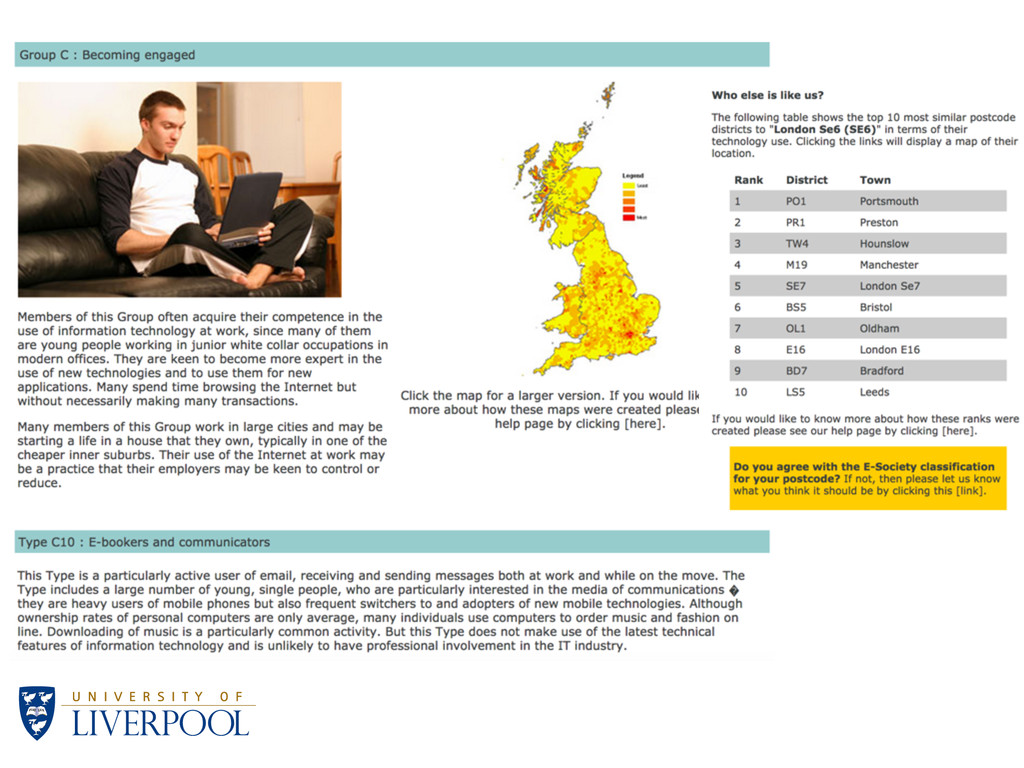
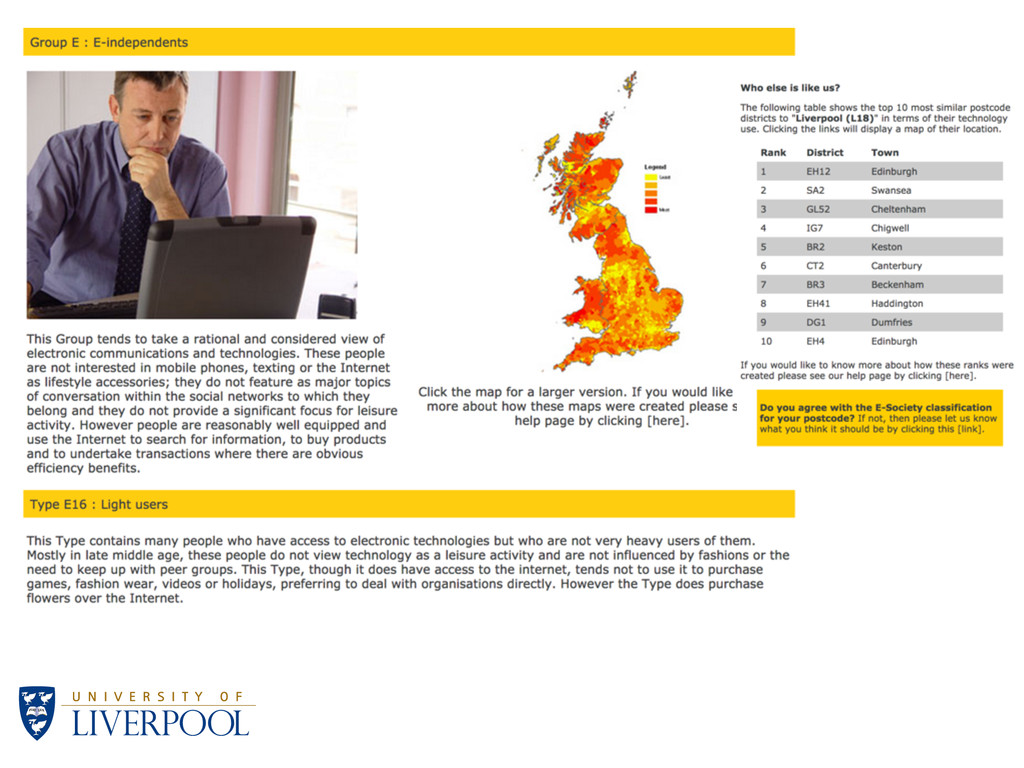
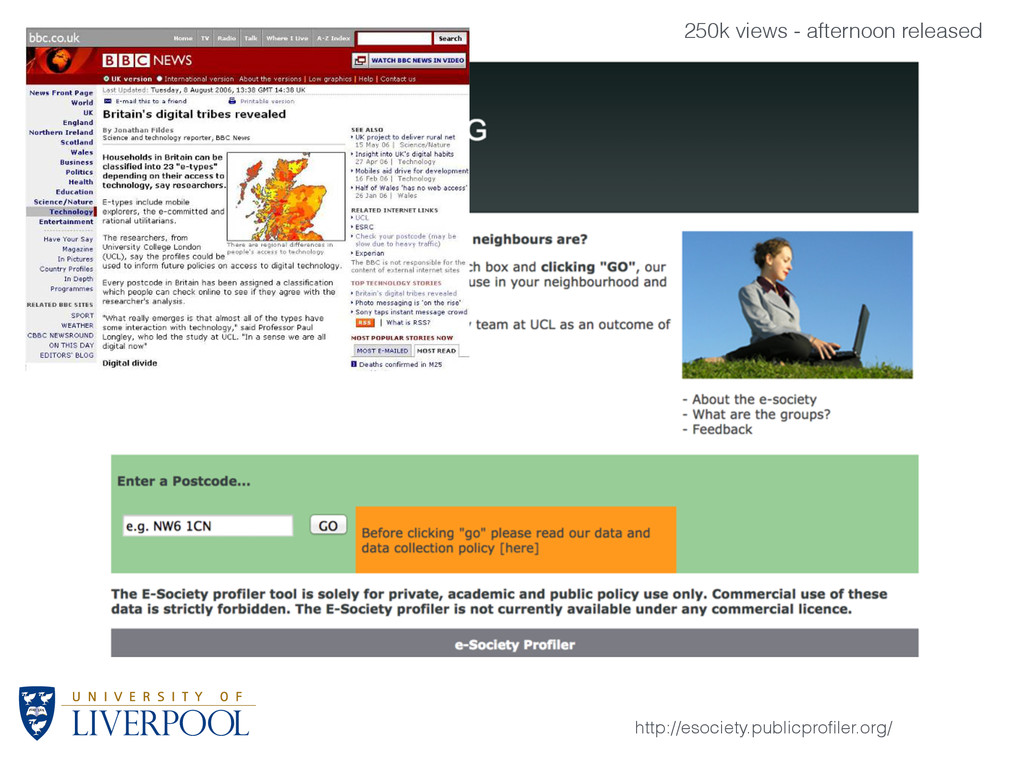
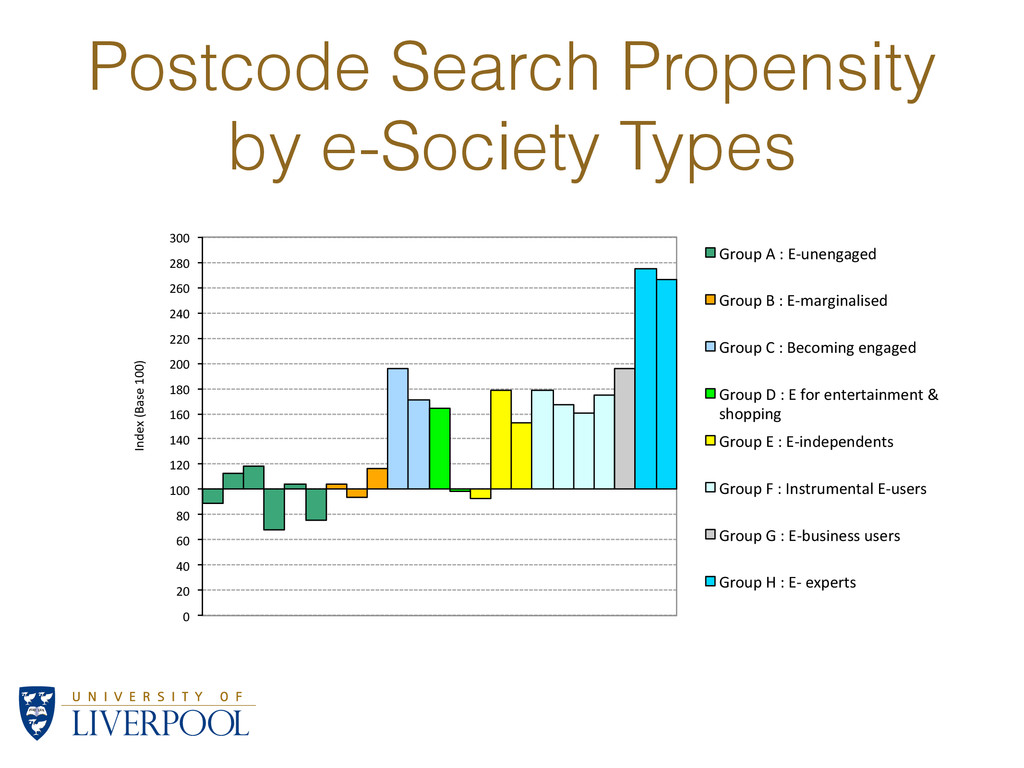
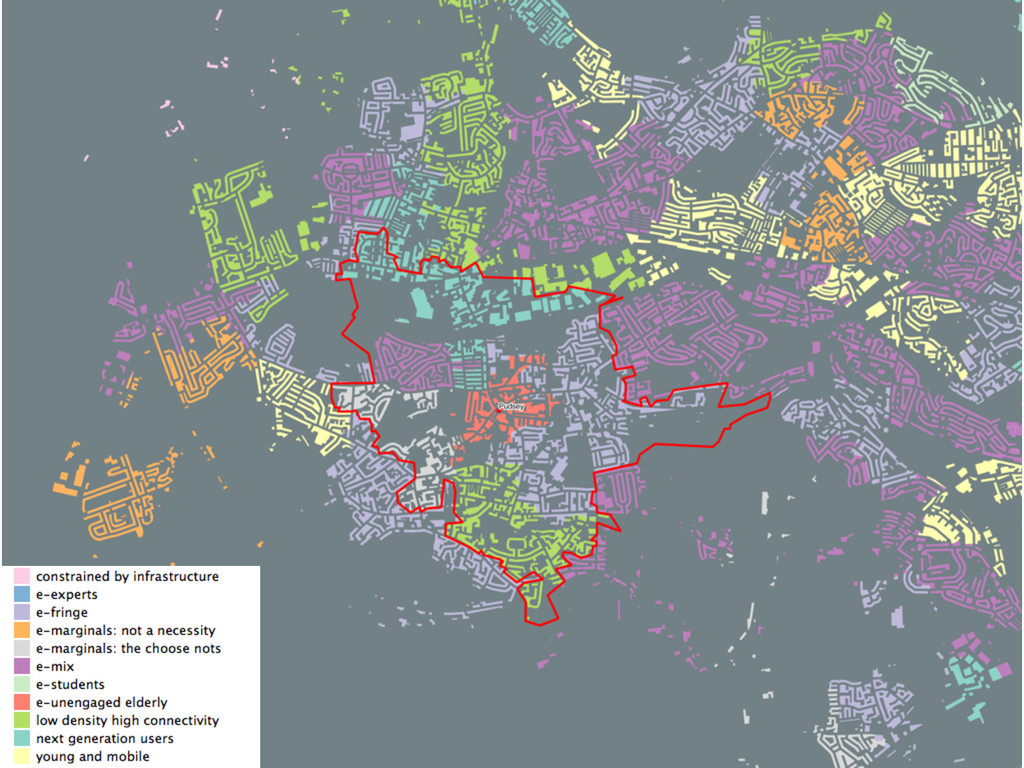
    – “Haves” & “Have-nots” • Digital Divide • By 2007 things were radically different • Usage & Engagement increasingly more complex • Created a classification which consisted of 8 Groups & 23 Types. – Links to Postcode.
  4. Postcode Search Propensity by e-Society Types 0" 20" 40" 60"

    80" 100" 120" 140" 160" 180" 200" 220" 240" 260" 280" 300" Index"(Base"100)" Group"A":"E;unengaged" Group"B":"E;marginalised" Group"C":"Becoming"engaged" Group"D":"E"for"entertainment"&" shopping" Group"E":"E;independents" Group"F":"Instrumental"E;users" Group"G":"E;business"users" Group"H":"E;"experts"
  5. Feedback Origin 0" 20" 40" 60" 80" 100" 120" 140"

    160" 180" 200" 220" 240" Index"(Base"100)" Group"A":"E:unengaged" Group"B":"E:marginalised" Group"C":"Becoming"engaged" Group"D":"E"for"entertainment"&" shopping" Group"E":"E:independents" Group"F":"Instrumental"E:users" Group"G":"E:business"users" Group"H":"E:"experts"
  6. Feedback Destination 0" 50" 100" 150" 200" 250" 300" 350"

    400" 450" 500" Index"(Base"100)" Group"A":"E:unengaged" Group"B":"E:marginalised" Group"C":"Becoming"engaged" Group"D":"E"for"entertainment"&" shopping" Group"E":"E:independents" Group"F":"Instrumental"E:users" Group"G":"E:business"users" Group"H":"E:"experts"
  7. IMD Materially) deprived! Not)materially) deprived! Not)e0engaged! Group!1! (1,150,926!–!2.3%)! Group!2! (7,065,101–14.4%)!

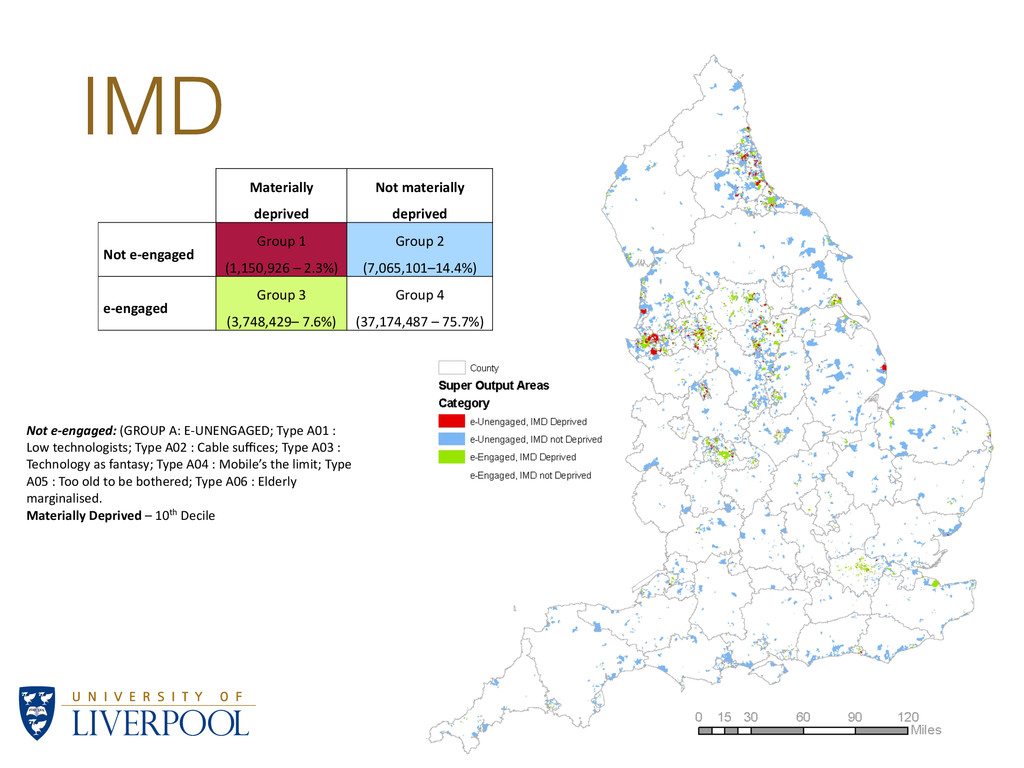
    e0engaged! Group!3! (3,748,429–!7.6%)! Group!4! (37,174,487!–!75.7%)! Not  e-­‐engaged:  (GROUP  A:  E-­‐UNENGAGED;  Type  A01  :   Low  technologists;  Type  A02  :  Cable  suffices;  Type  A03  :   Technology  as  fantasy;  Type  A04  :  Mobile’s  the  limit;  Type   A05  :  Too  old  to  be  bothered;  Type  A06  :  Elderly   marginalised.   Materially  Deprived  –  10th  Decile  
  8. 0" 20" 40" 60" 80" 100" Jan+08" Mar+08" May+08" Jul+08"

    Sep+08" Nov+08" Jan+09" Mar+09" May+09" Jul+09" Sep+09" Nov+09" Jan+10" Mar+10" May+10" Jul+10" Sep+10" Nov+10" %"OF"ALL"WITH"ACCESS" EMAILS":YES" BANK"A/C"&"FINANCES":YES" DOWNLOAD"MUSIC":YES" SOCIAL"NETWORKS"/"BLOGS":YES" Behaviour change Source: http://www.thebps.co.uk/
  9. Infrastructure change 20 30 40 50 60 70 80 2005

    2006 2007 2008 2009 2010 % Population Internet take-up Total broadband take-up Source: Ofcom - http://stakeholders.ofcom.org.uk/market-data-research/telecoms-research/broadband-speeds/main/
  10. 0 50 100 150 200 Mar 
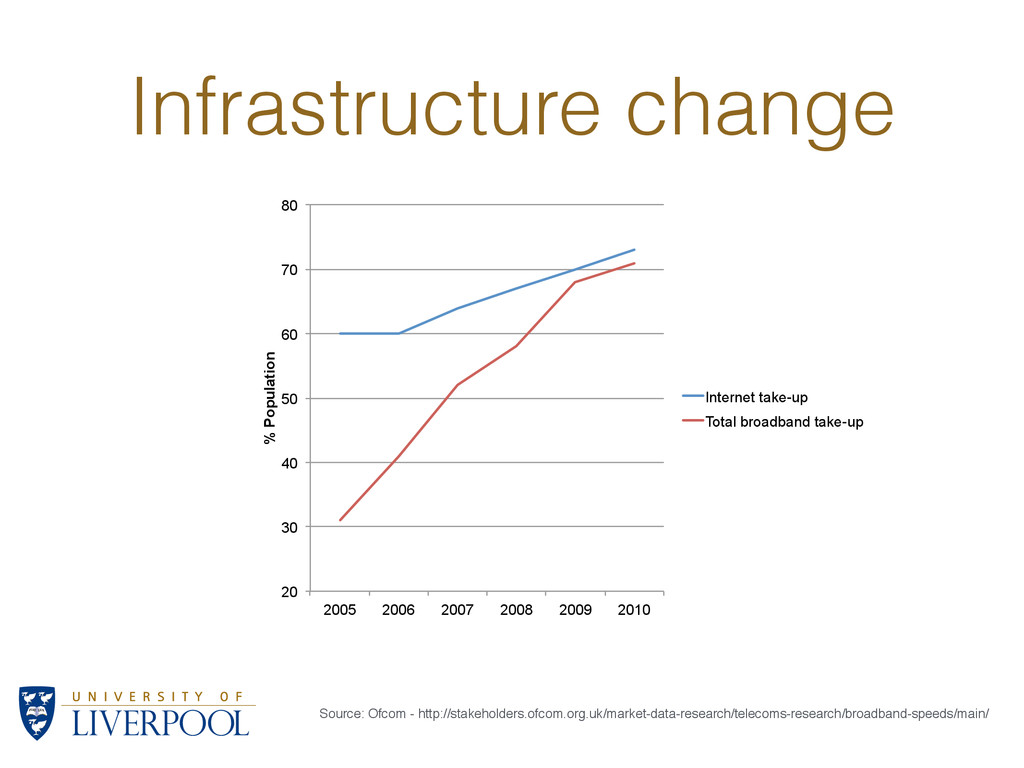
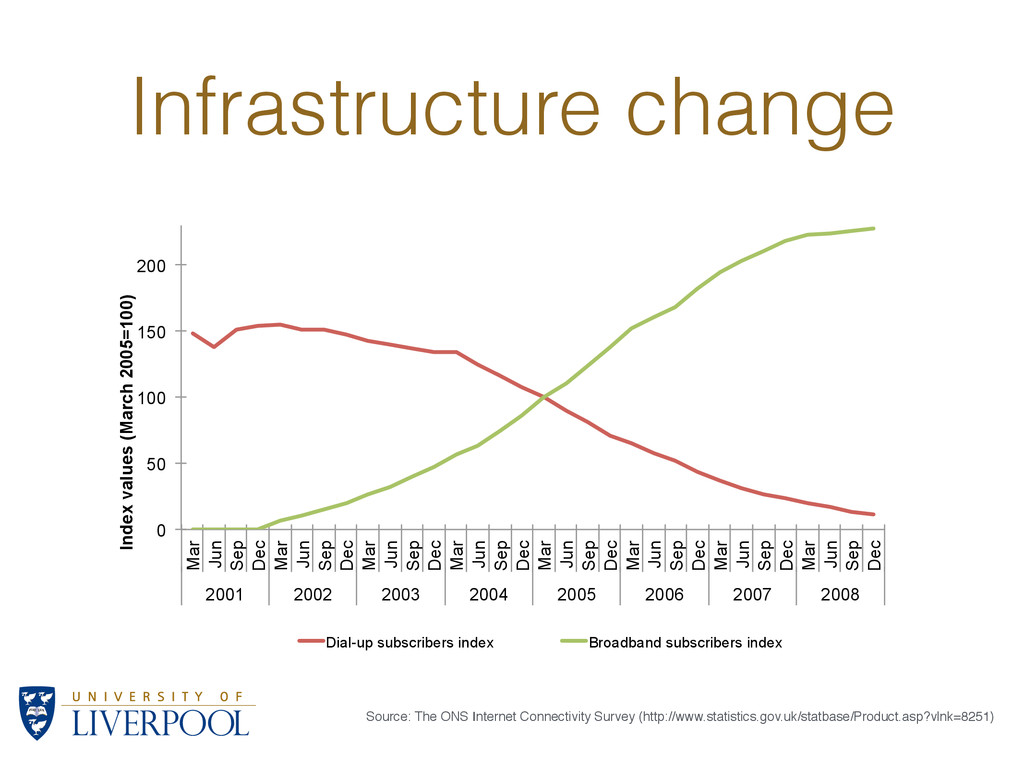
Jun Sep Dec Mar

    Jun Sep Dec Mar Jun Sep Dec Mar Jun Sep Dec Mar Jun Sep Dec Mar Jun Sep Dec Mar Jun Sep Dec Mar Jun Sep Dec 2001 2002 2003 2004 2005 2006 2007 2008 Index values (March 2005=100) Dial-up subscribers index Broadband subscribers index Source: The ONS Internet Connectivity Survey (http://www.statistics.gov.uk/statbase/Product.asp?vlnk=8251) Infrastructure change
  11. New Internet User Classification Connec&vity+ Drivers'of'Differen,a,on' Demographics+ Components' Behaviours+ Mode%

    Speed% Contextual+ Gender% Age% Ethnicity% NS4SEC% Income% Par:cipa:on% Ac:vi:es% Rurality% Region% Measures' ONS%Popula:on% Es:mates% ONS%Rural/ Urban% Defini:on% ONS%Household% earnings% es:mates% Labour%Force% Survey% OII%Internet%Survey% Exchange% Loca:ons% 3G%Signal% Strength% Hotspot% Loca:ons% Internet%% Speed%Survey% Cable% Availability% E5Society' Council%Tax% Bands% Dept.%Educa:on% Educa:on%
  12. ! ! ! Internet Consumer Map Book Consumer Data Research

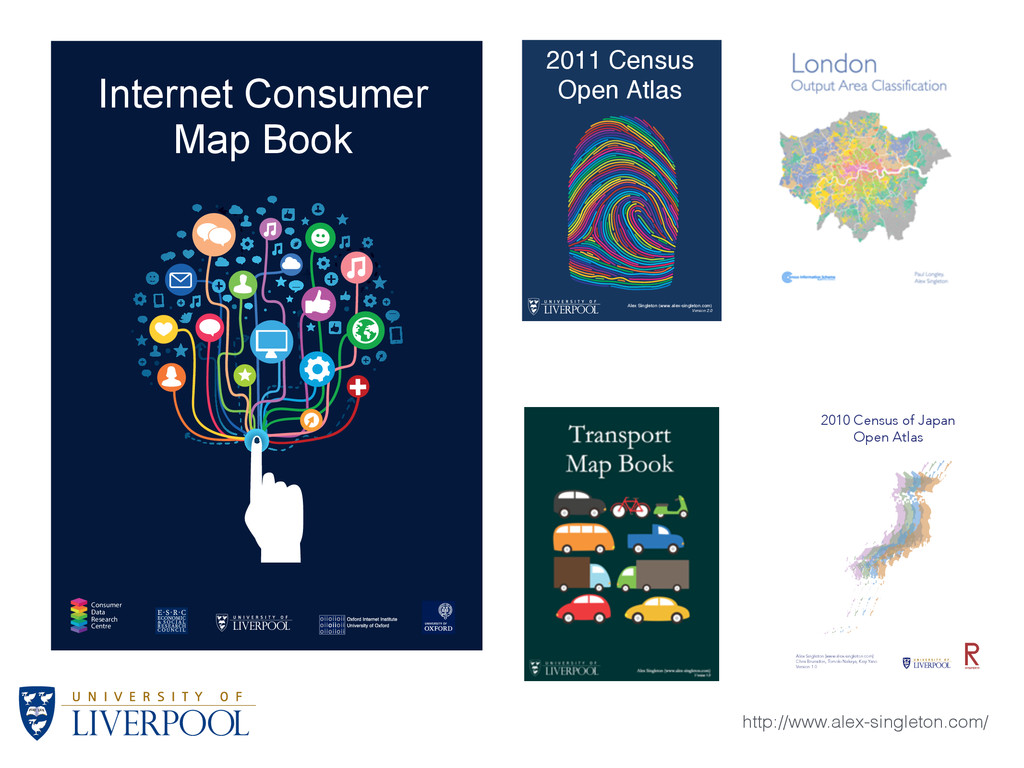
    Centre An ESRC Data Investment 2010 Census of Japan Open Atlas Alex Singleton [www.alex-singleton.com] Chris Brunsdon, Tomoki Nakaya, Keiji Yano Version 1.0 ! 2011 Census Open Atlas Alex Singleton (www.alex-singleton.com) Version 2.0 http://www.alex-singleton.com/
  13. ! ! ! Internet Consumer Map Book Consumer Data Research

    Centre An ESRC Data Investment All local authorities
  14. From Attributes to Contexts • Similar method as OAC •

    Standardised Inputs • K-Means • 2 tiers
  15. Online&sales& Supply&factors& Demand&factors& Retail/Service& Offer& Catchments& &Demographics& Retail& e<Resilience& Vulnerability/adapta?on&

    Connec?vity& Consumer&Behaviour& retail/service+mix+ +++a.rac/veness++ +++++shopping+convenience++ + + socio5economic+status+ age+ + ++infrastructure+ +++++++speed+ rurality+ Engagement+with+ICT+ ++++++Shopping+online+ + e-Resilient Retail
  16. Catchment Estimates LSOA (i) A - attractiveness D - distance

    Retail Centre (j) L LDC Large, Medium, Small (s) Note: General model
  17. Some Innovations 1) Use the retail centre extent not the

    centroid 2) Street distances, not straight line 3) Routing / model all within R 4) Open Source
  18. 75%

  19. Work in Progress • Catchment model refinement • Population •

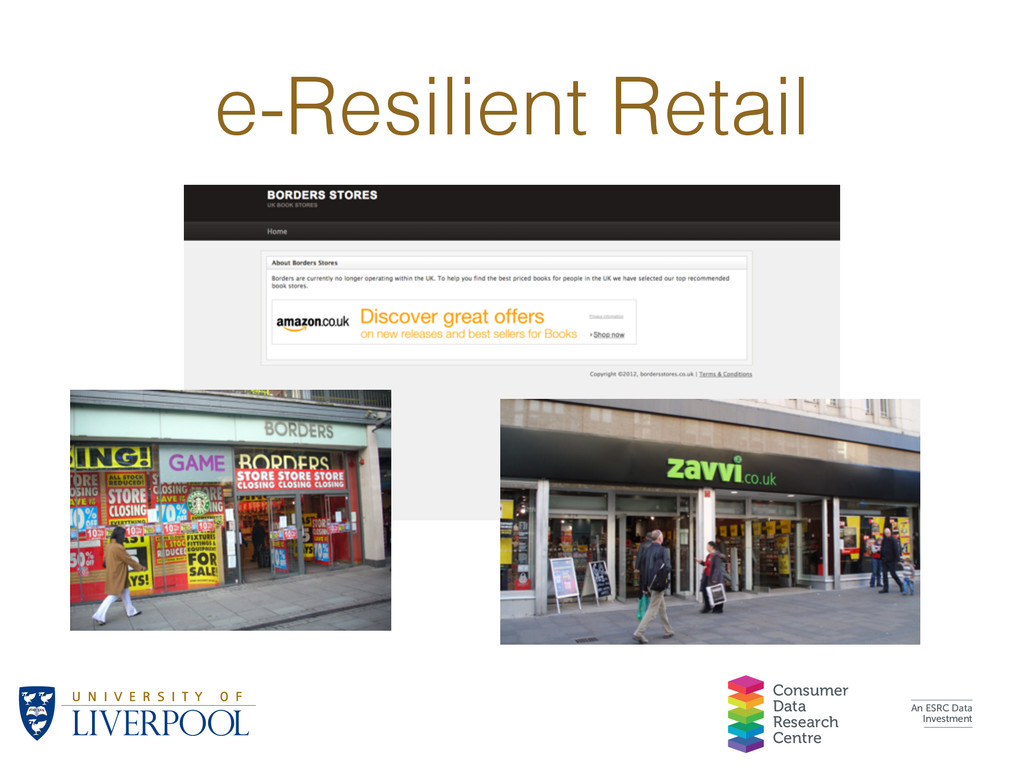
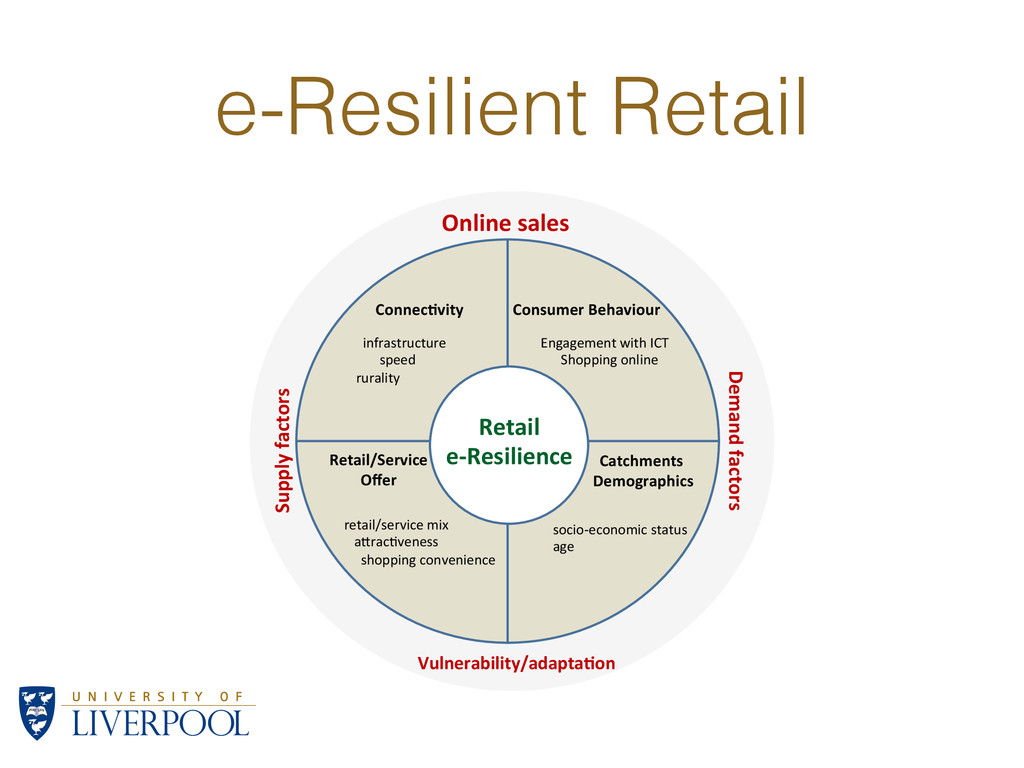
    Geodemographics • Day V Night • Retail hierarchy • Sensitivity to e-Resilience • Retail activity type - e.g. comparison V leisure etc • Retail centres…