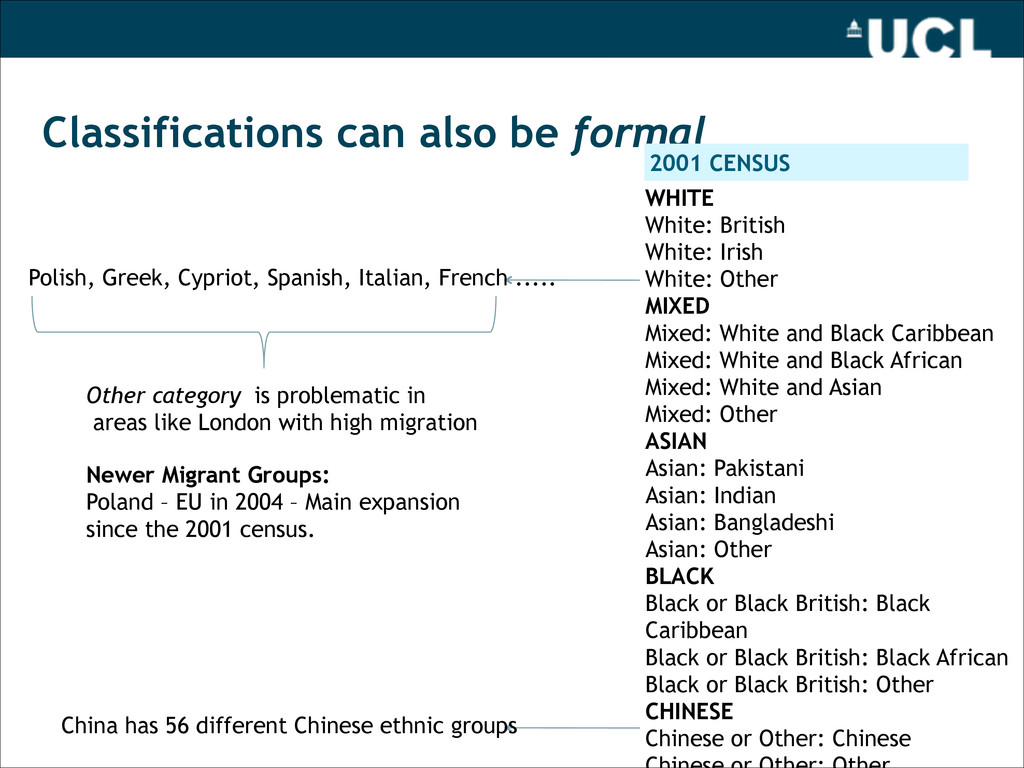
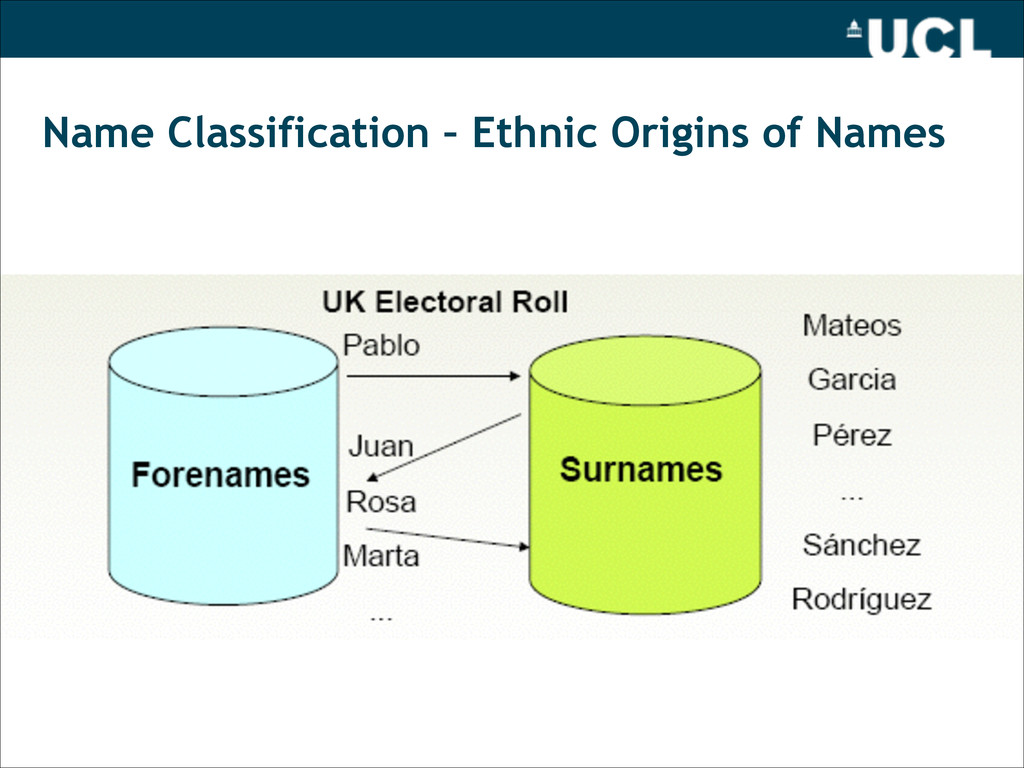
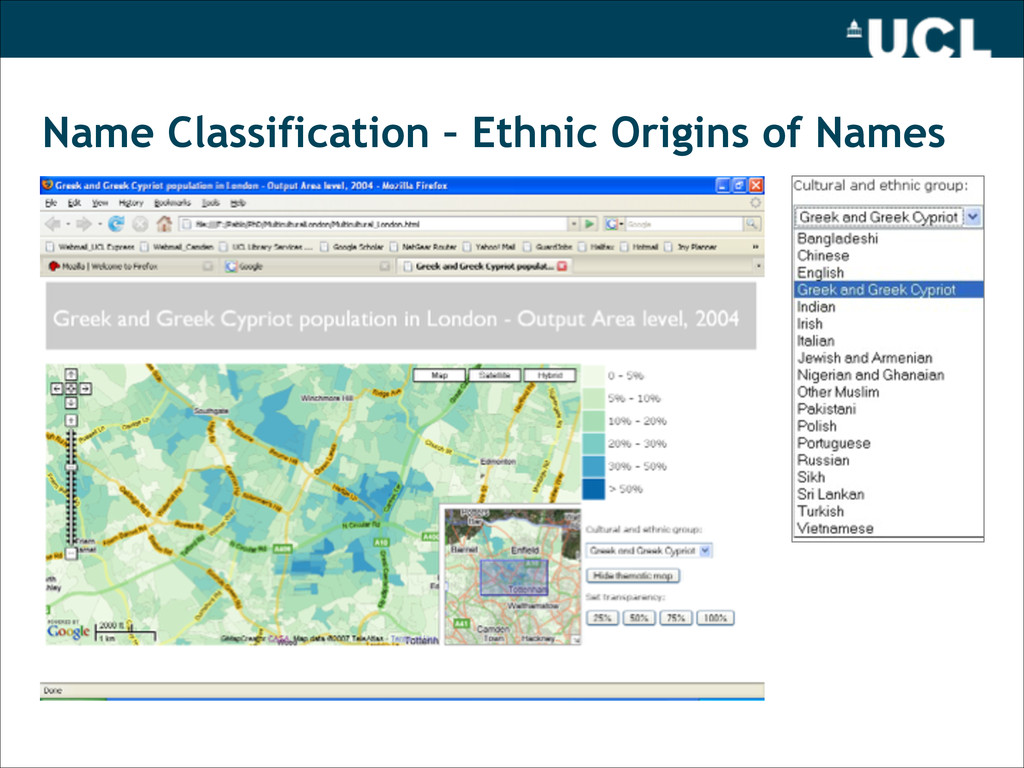
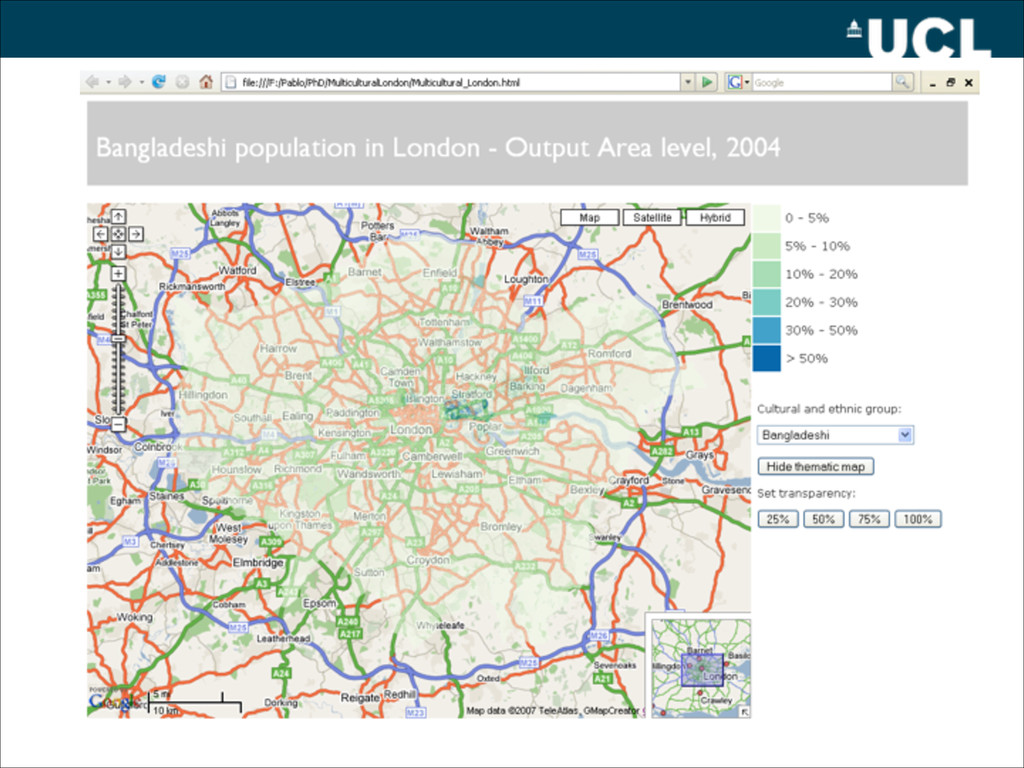
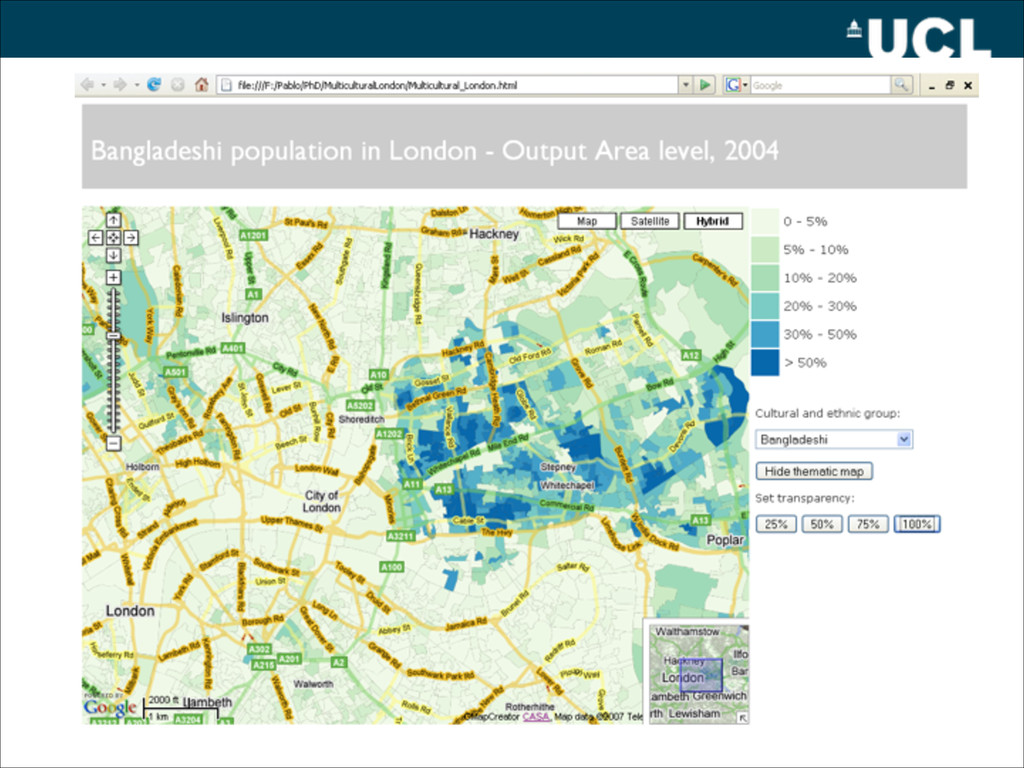
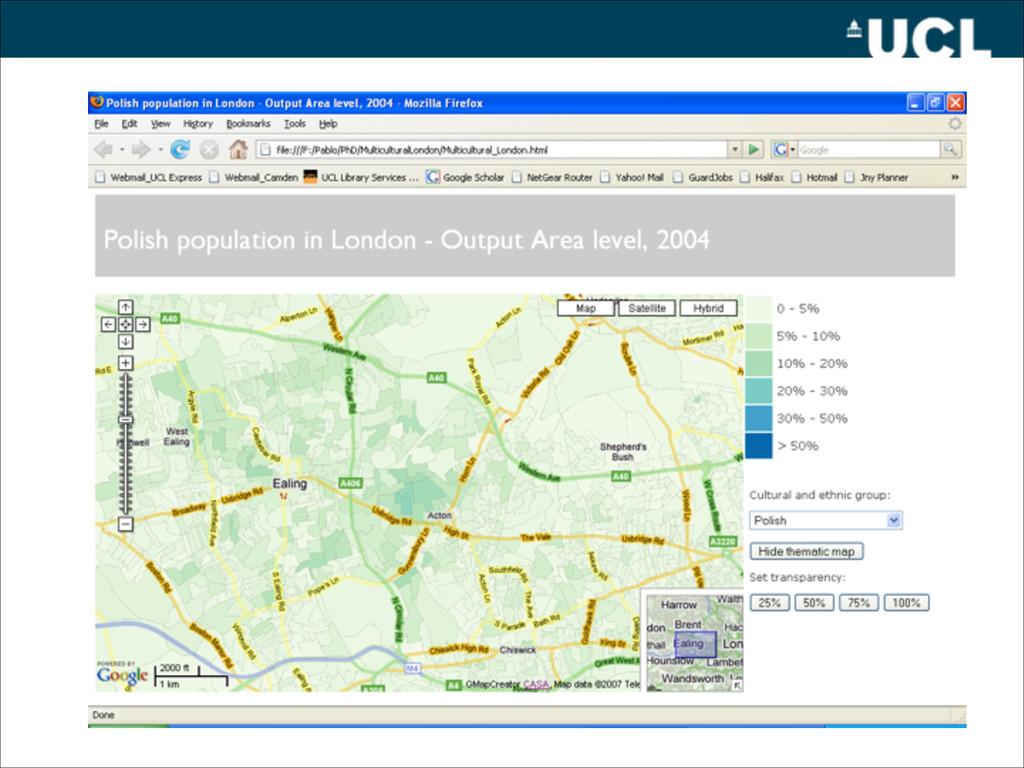
and Black Caribbean Mixed: White and Black African Mixed: White and Asian Mixed: Other ASIAN Asian: Pakistani Asian: Indian Asian: Bangladeshi Asian: Other BLACK Black or Black British: Black Caribbean Black or Black British: Black African Black or Black British: Other CHINESE Chinese or Other: Chinese Classifications can also be formal Polish, Greek, Cypriot, Spanish, Italian, French ..... China has 56 different Chinese ethnic groups Other category is problematic in areas like London with high migration ! Newer Migrant Groups: Poland – EU in 2004 – Main expansion since the 2001 census. 2001 CENSUS
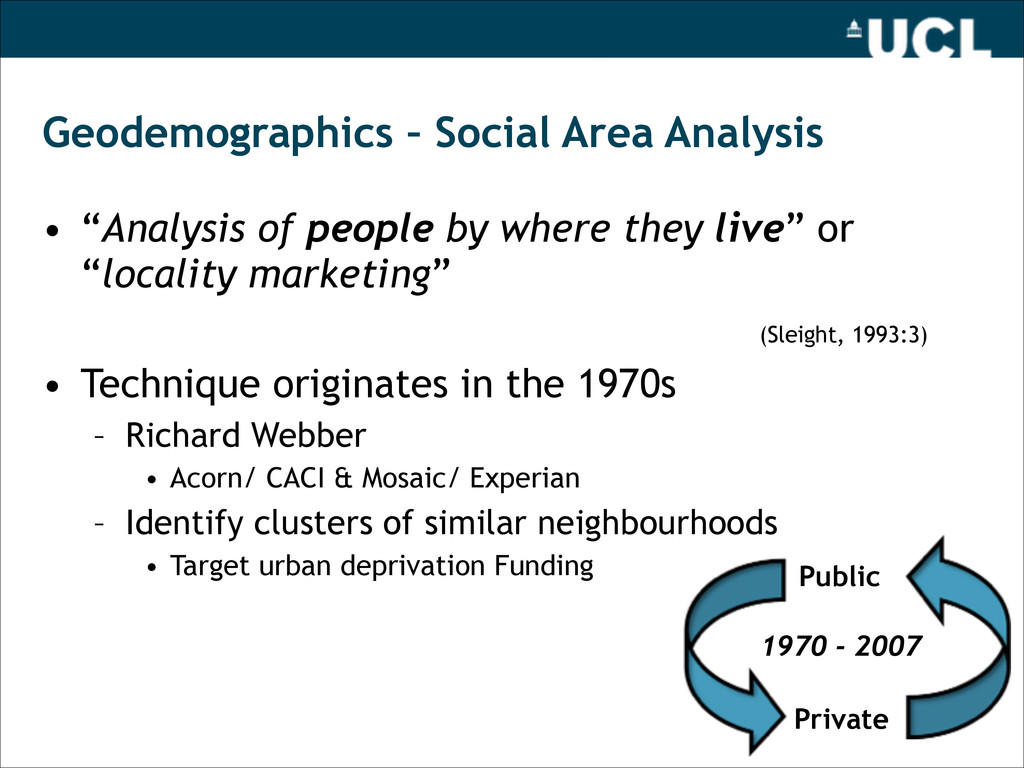
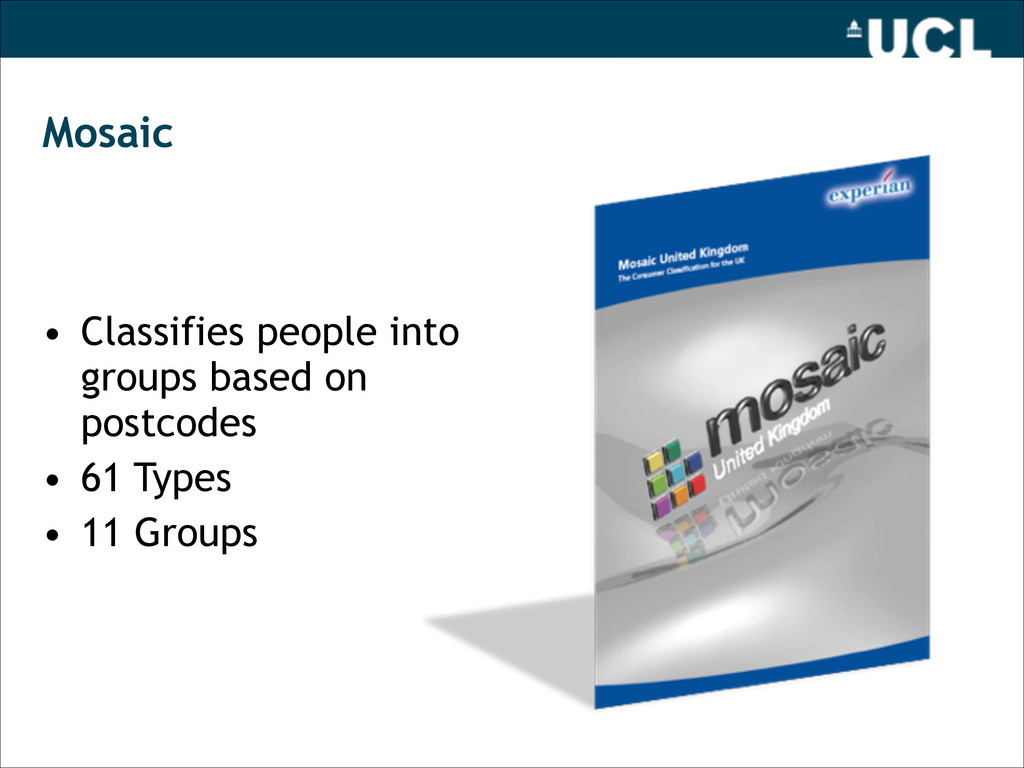
where they live” or “locality marketing” (Sleight, 1993:3) • Technique originates in the 1970s – Richard Webber • Acorn/ CACI & Mosaic/ Experian – Identify clusters of similar neighbourhoods • Target urban deprivation Funding Public Private 1970 - 2007
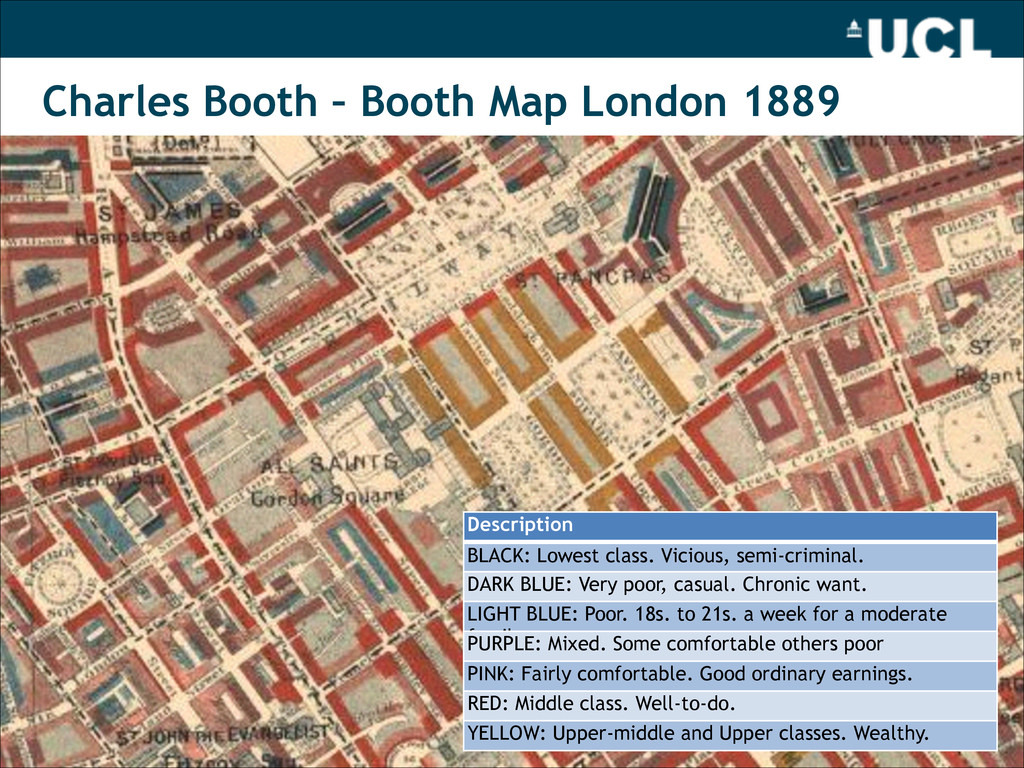
class. Vicious, semi-criminal. DARK BLUE: Very poor, casual. Chronic want. LIGHT BLUE: Poor. 18s. to 21s. a week for a moderate family PURPLE: Mixed. Some comfortable others poor PINK: Fairly comfortable. Good ordinary earnings. RED: Middle class. Well-to-do. YELLOW: Upper-middle and Upper classes. Wealthy.
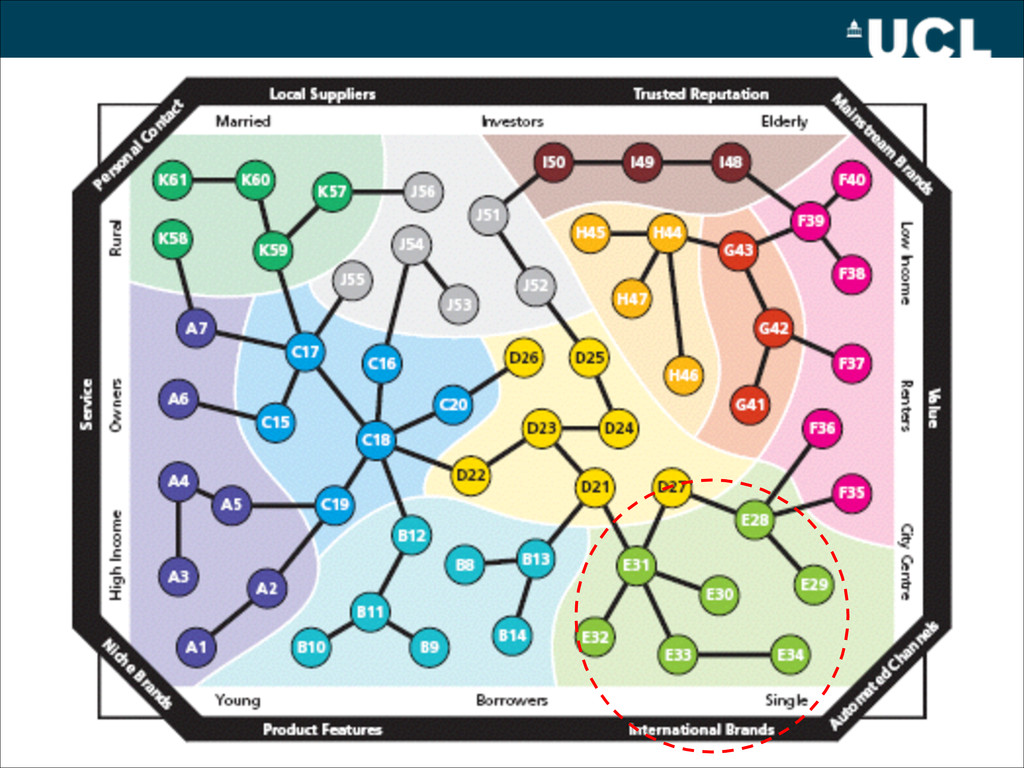
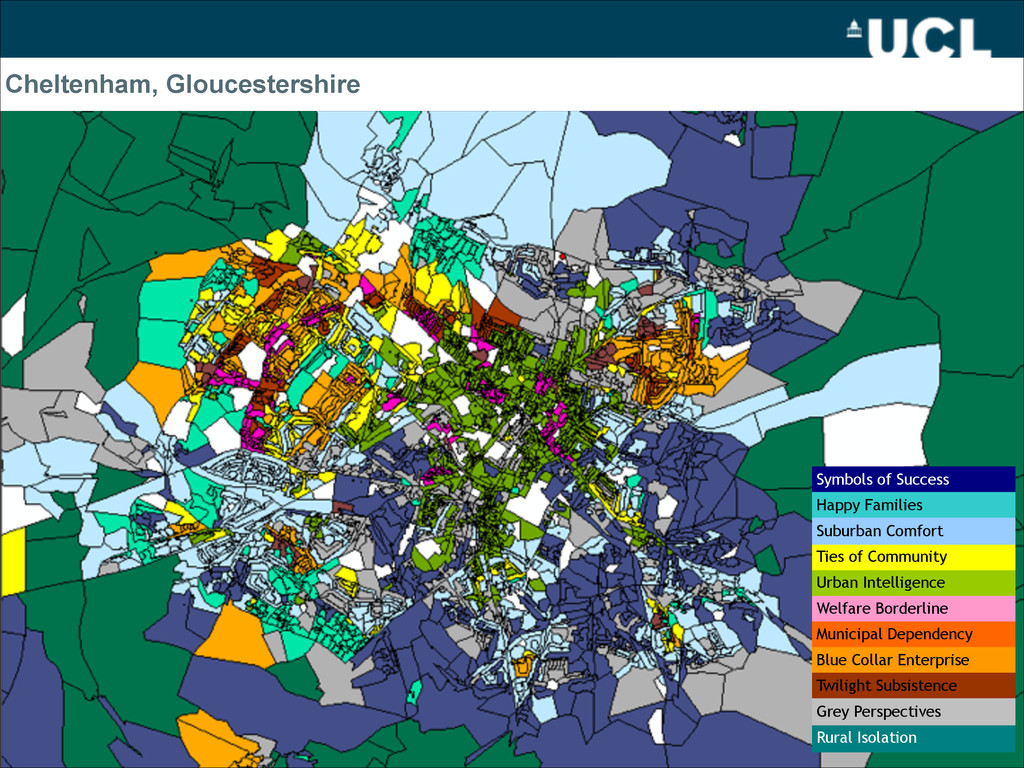
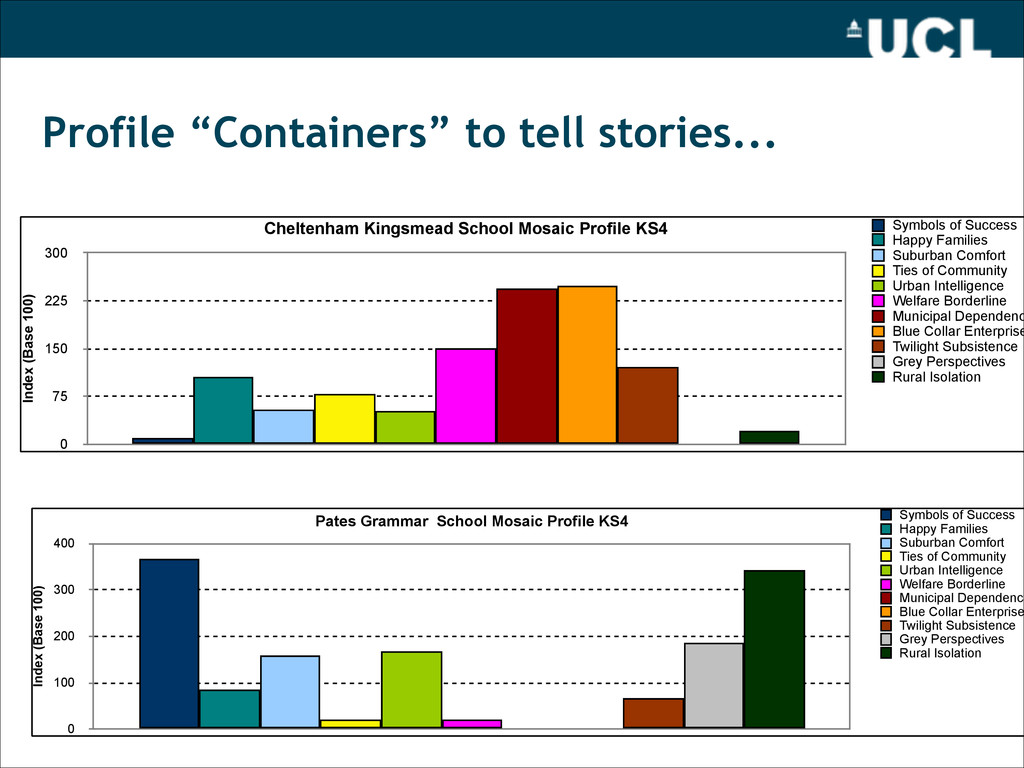
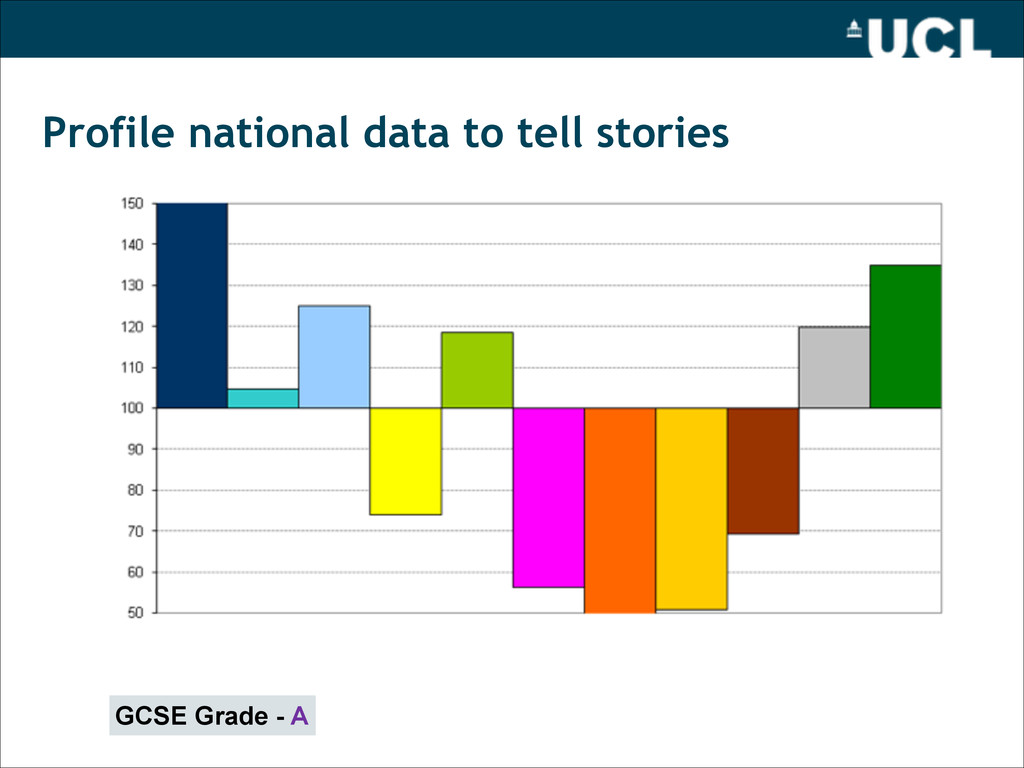
75 150 225 300 Symbols of Success Happy Families Suburban Comfort Ties of Community Urban Intelligence Welfare Borderline Municipal Dependenc Blue Collar Enterprise Twilight Subsistence Grey Perspectives Rural Isolation Pates Grammar School Mosaic Profile KS4 Index (Base 100) 0 100 200 300 400 Symbols of Success Happy Families Suburban Comfort Ties of Community Urban Intelligence Welfare Borderline Municipal Dependency Blue Collar Enterprise Twilight Subsistence Grey Perspectives Rural Isolation Profile “Containers” to tell stories...
Technology Use – “Haves” & “Have-nots” – Digital Divide • 2007 things are radically different – Usage & Engagement increasingly more complex • Created a classification which consisted of 8 Groups & 23 Types. – Links to Postcode.
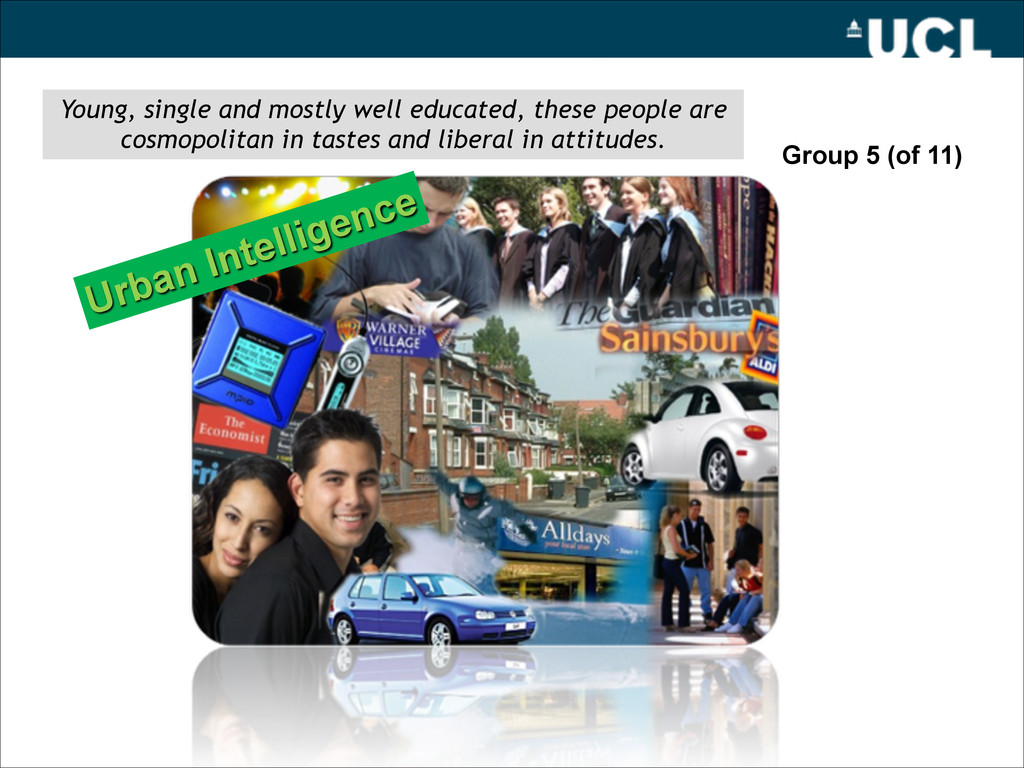
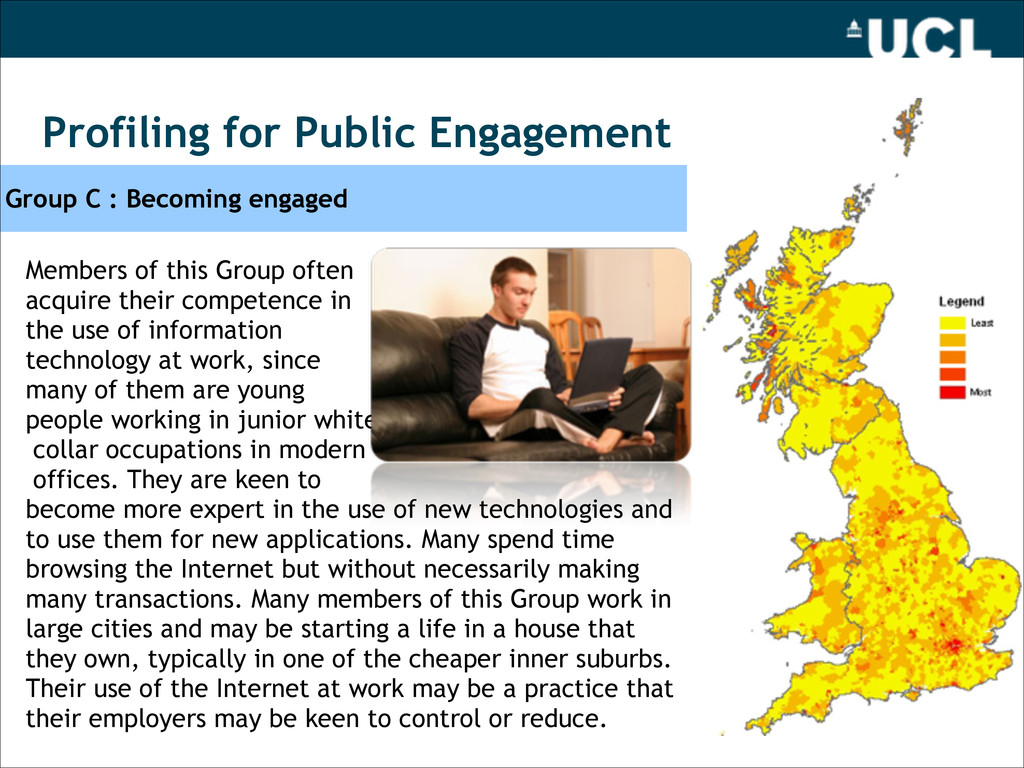
their competence in the use of information technology at work, since many of them are young people working in junior white collar occupations in modern offices. They are keen to become more expert in the use of new technologies and to use them for new applications. Many spend time browsing the Internet but without necessarily making many transactions. Many members of this Group work in large cities and may be starting a life in a house that they own, typically in one of the cheaper inner suburbs. Their use of the Internet at work may be a practice that their employers may be keen to control or reduce. Group C : Becoming engaged