Upgrade to Pro — share decks privately, control downloads, hide ads and more …

SFN2010-v6.pdf

alimoeeny
September 26, 2011

 SFN2010-v6.pdf

alimoeeny

September 26, 2011
Tweet

Other Decks in Education

Transcript

  1. A top-down component of decision- related activity in monkey MT

    Ali Moeeny MD PhD Bruce Cumming MD PhD Laboratory of Sensory-motor Research National Eye Institute, NIH, Bethesda, MD 1
  2. Sources of Decision Variation MT Feedforward models Reported Direction No

    incoming signal High rate Low rate Random noise 2
  3. Sources of Decision Variation MT Feedforward models Reported Direction No

    incoming signal High rate Low rate Random noise 2
  4. Hypothesis • If we can manipulate the way a subject

    perceives an ambiguous stimulus, that manipulation should change the firing rate of sensory neurons 4
  5. Demo • Ambiguous • Stable • Binocular disparity can make

    it unambiguous -- -- -- -- -- -- -- -- -- -- -- -- -- -- -- -- • Trick Start a trial with only a brief pulse of disparity 5
  6. Design Fixation Disparity Rotation Time 500 ms 0 2000 ms

    1000 ms %15 of trials Initial Disparity Rewarded by chance %85 of trials Rewarded if correct 6
  7. Design Fixation Disparity Rotation Time 500 ms 0 2000 ms

    1000 ms %15 of trials Initial Disparity Rewarded by chance %85 of trials Rewarded if correct 6
  8. Design Fixation Disparity Rotation Time 500 ms 0 2000 ms

    1000 ms %15 of trials Initial Disparity Rewarded by chance %85 of trials Rewarded if correct 6
  9. Design Fixation Disparity Rotation Time 500 ms 0 2000 ms

    1000 ms %15 of trials Initial Disparity Rewarded by chance %85 of trials Rewarded if correct 6
  10. Design Fixation Disparity Rotation Time 500 ms 0 2000 ms

    1000 ms %15 of trials Initial Disparity Rewarded by chance %85 of trials Rewarded if correct 6
  11. Average Performance During Recording Disparity (degrees) - 0.035 0 +

    0.035 Rightward in front Leftward in front %Leftward is in front %100 %50 %0 7
  12. Average Performance During Recording Disparity (degrees) - 0.035 0 +

    0.035 Rightward in front Leftward in front %Leftward is in front %100 %50 %0 -0.04 Initial disparity 7
  13. Average Performance During Recording Disparity (degrees) - 0.035 0 +

    0.035 Rightward in front Leftward in front %Leftward is in front %100 %50 %0 -0.04 Initial disparity Initial disparity +0.04 7
  14. Example Neuron Time (ms) Firing Rate (spike/s) dae119 Preferred rotation

    dir. Null rotation direction 0 500 1000 1500 2000 120 60 0 8
  15. Example Neuron Time (ms) Firing Rate (spike/s) dae119 Preferred rotation

    dir. Null rotation direction 0 500 1000 1500 2000 120 60 0 8
  16. Example Neuron Time (ms) Firing Rate (spike/s) dae119 Preferred rotation

    dir. Preferred Initial disparity Null rotation direction 0 500 1000 1500 2000 120 60 0 8
  17. Example Neuron Time (ms) Firing Rate (spike/s) dae119 Preferred rotation

    dir. Preferred Initial disparity Null rotation direction 0 500 1000 1500 2000 120 60 0 Predictions from Feedforward model 8
  18. Example Neuron Time (ms) Firing Rate (spike/s) dae119 Preferred rotation

    dir. Preferred Initial disparity Null rotation direction 0 500 1000 1500 2000 120 60 0 Predictions from Feedforward model 8
  19. Example Neuron Time (ms) Firing Rate (spike/s) dae119 Preferred rotation

    dir. Preferred Initial disparity Null Initial disparity Null rotation direction 0 500 1000 1500 2000 120 60 0 Predictions from Feedforward model 8
  20. Example Neuron Time (ms) Firing Rate (spike/s) dae119 Preferred rotation

    dir. Preferred Initial disparity Null Initial disparity Null rotation direction 0 500 1000 1500 2000 120 60 0 Predictions from Feedforward model 8
  21. Example Neuron Time (ms) Firing Rate (spike/s) dae119 Preferred rotation

    dir. Preferred Initial disparity Null Initial disparity Null rotation direction 0 500 1000 1500 2000 120 60 0 Predictions from Feedforward model Delay 8
  22. Example Neuron Time (ms) Firing Rate (spike/s) dae119 Preferred rotation

    dir. Preferred Initial disparity Null Initial disparity Null rotation direction 0 500 1000 1500 2000 120 60 0 8
  23. Example Neuron Time (ms) Firing Rate (spike/s) dae119 Preferred rotation

    dir. Preferred Initial disparity Null Initial disparity Null rotation direction 0 500 1000 1500 2000 120 60 0 Predictions from Top-down model 8
  24. Example Neuron Time (ms) Firing Rate (spike/s) dae119 Preferred rotation

    dir. Preferred Initial disparity Null Initial disparity Null rotation direction 0 500 1000 1500 2000 120 60 0 Predictions from Top-down model 8
  25. Example Neuron Time (ms) Firing Rate (spike/s) dae119 Preferred rotation

    dir. Preferred Initial disparity Null Initial disparity Null rotation direction 0 500 1000 1500 2000 120 60 0 8
  26. Example Neuron Time (ms) Firing Rate (spike/s) dae119 Preferred rotation

    dir. Preferred Initial disparity Null Initial disparity Null rotation direction 0 500 1000 1500 2000 120 60 0 8
  27. Example Neuron Time (ms) Firing Rate (spike/s) dae119 Preferred rotation

    dir. Preferred Initial disparity Null Initial disparity Null rotation direction 0 500 1000 1500 2000 120 60 0 8
  28. Example Neuron Time (ms) Firing Rate (spike/s) dae119 Preferred rotation

    dir. Preferred Initial disparity Null Initial disparity Null rotation direction 0 500 1000 1500 2000 120 60 0 8
  29. Population Responses Time (ms) Firing Rate (spikes/s) 44 cells /

    2 monkeys Preferred rotation dir. Preferred initial disparity Null initial disparity Null rotation direction 0 500 1000 1500 2000 50 25 0 9
  30. Population Responses Time (ms) Firing Rate (spikes/s) 44 cells /

    2 monkeys Preferred initial disparity Null initial disparity 0 500 1000 1500 2000 50 25 0 9
  31. Population Responses Time (ms) Firing Rate (spikes/s) 44 cells /

    2 monkeys Preferred initial disparity Null initial disparity 0 500 1000 1500 2000 50 25 0 Mean ROC = 0.67 larger than 0.5 (p<0.001) 9
  32. Population Responses Time (ms) Firing Rate (spikes/s) 44 cells /

    2 monkeys Preferred initial disparity Null initial disparity 0 500 1000 1500 2000 50 25 0 Mean ROC = 0.67 larger than 0.5 (p<0.001) Delay 9
  33. Control Task Time 500 ms 0 2000 ms 1000 ms

    Fixation Rotation Disparity Inside RF 10
  34. Control Task Time 500 ms 0 2000 ms 1000 ms

    Fixation Rotation Disparity Inside RF Rotation Disparity Outside RF Rewarded for correct choice 10
  35. Control Task • To ensure that the monkey was attending

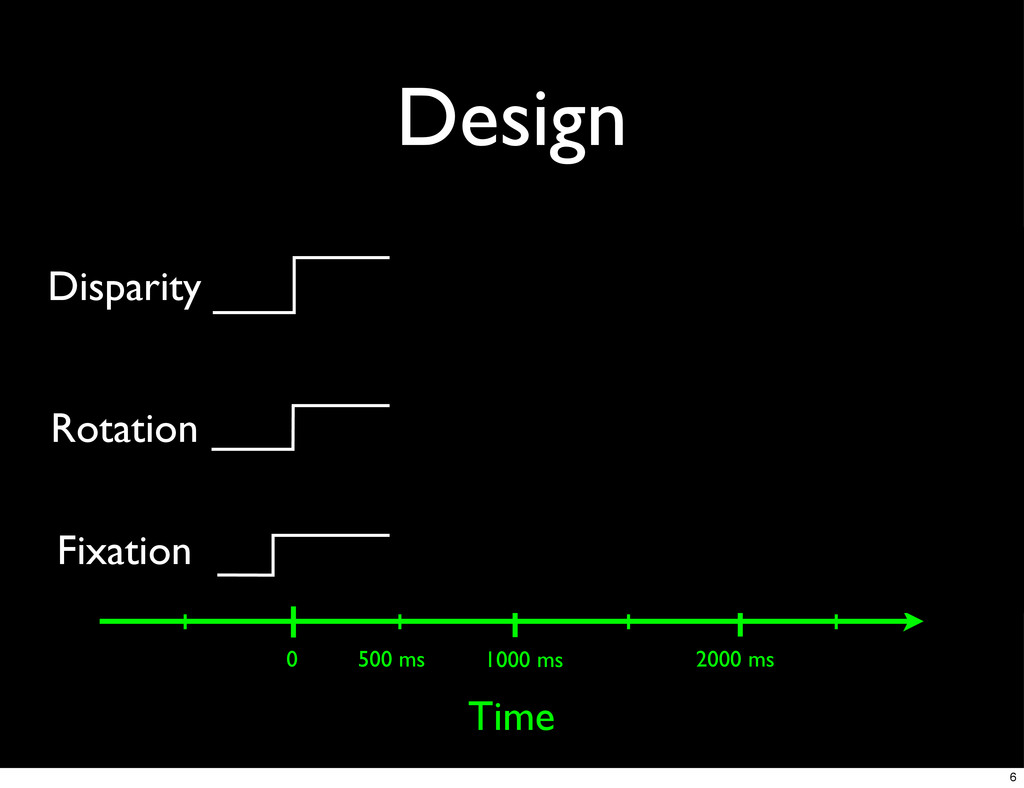
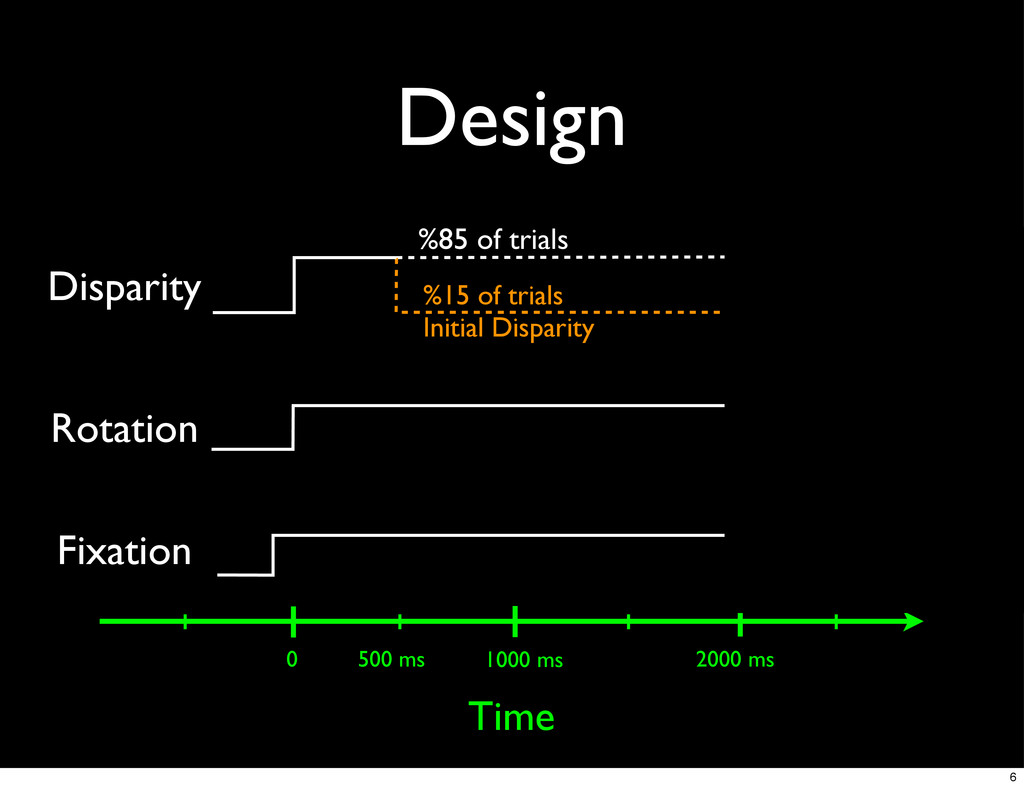
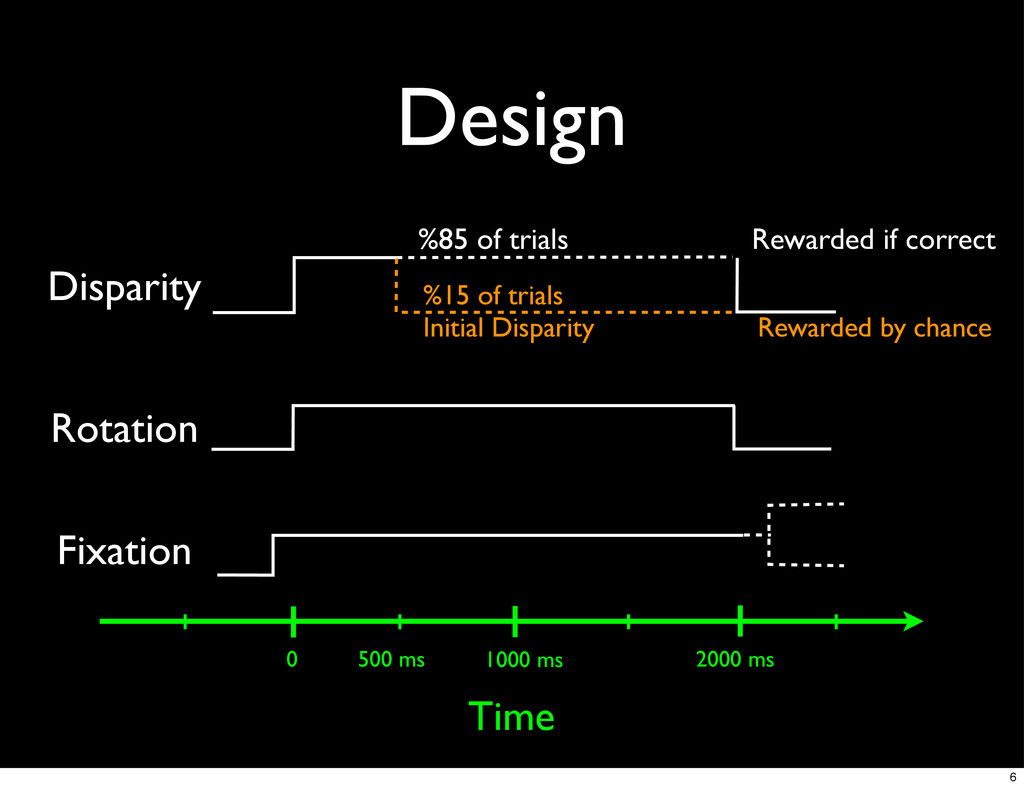
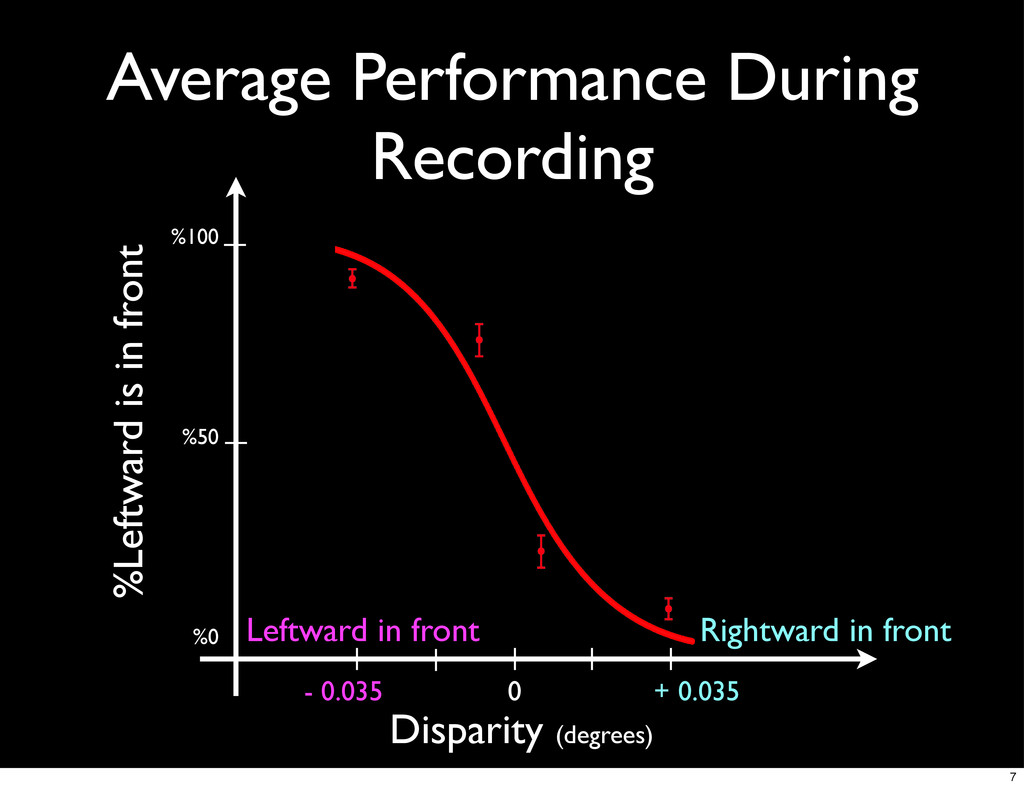
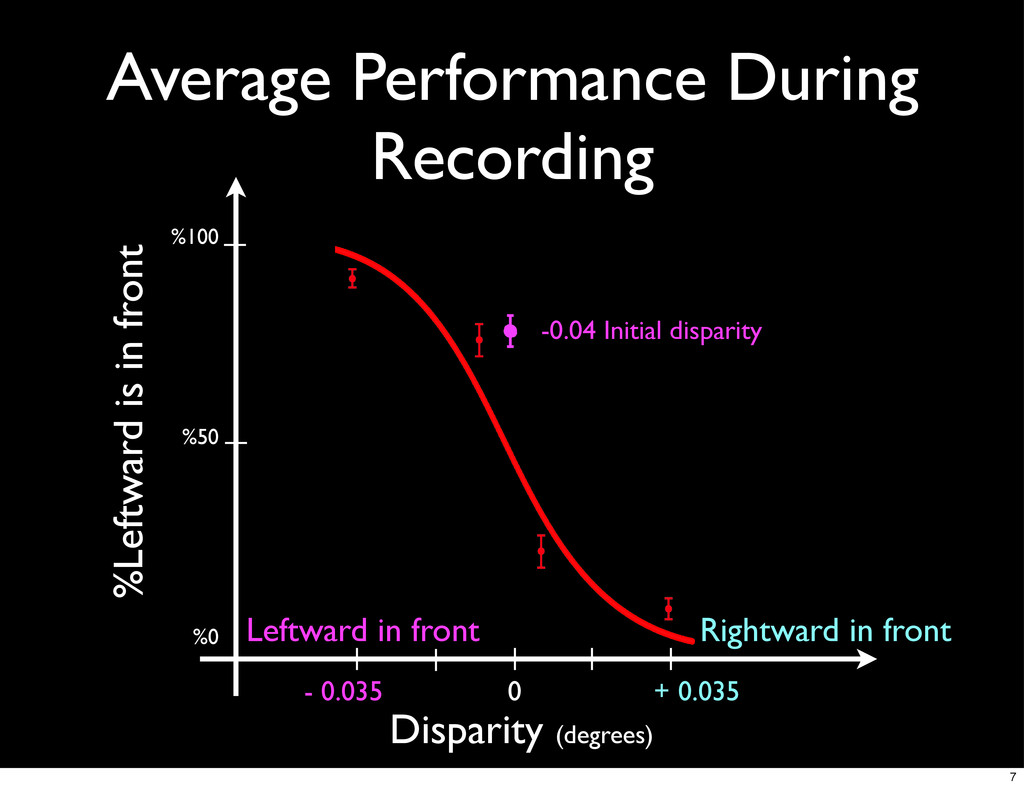
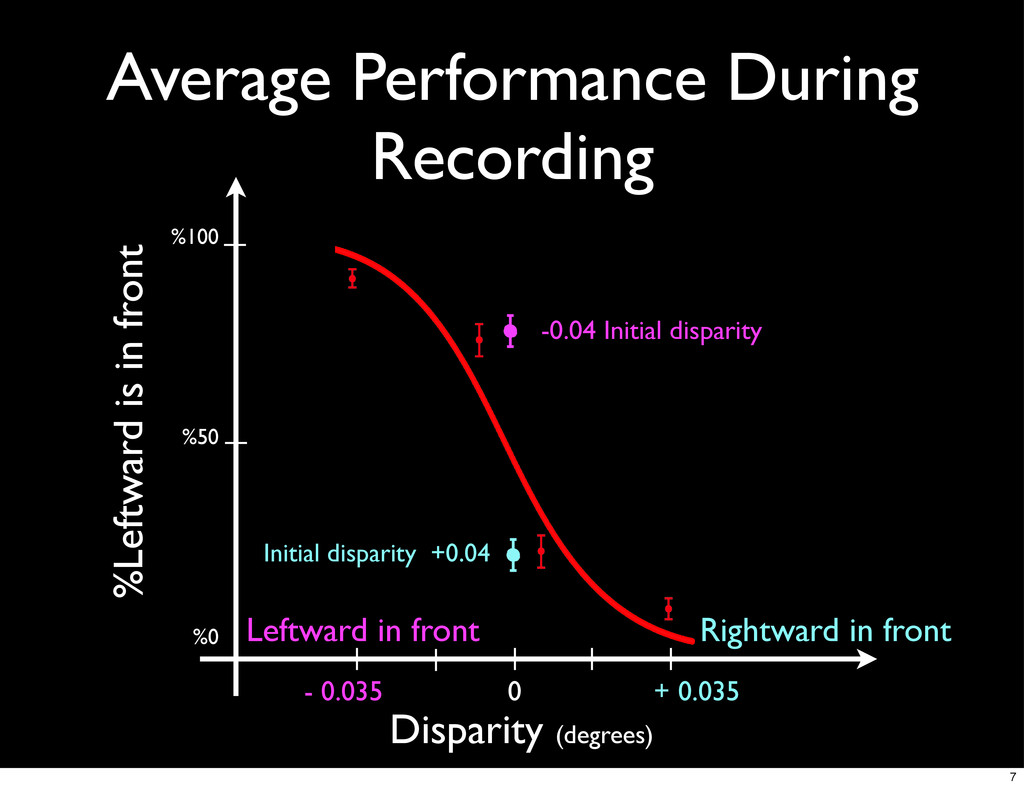
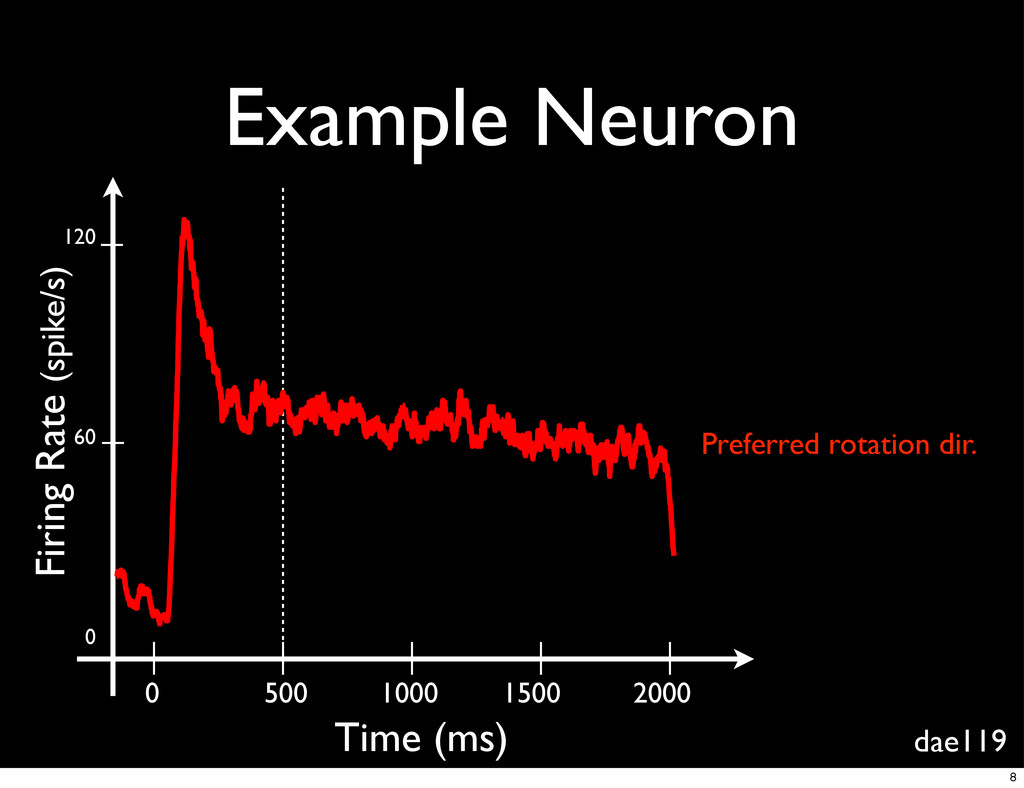
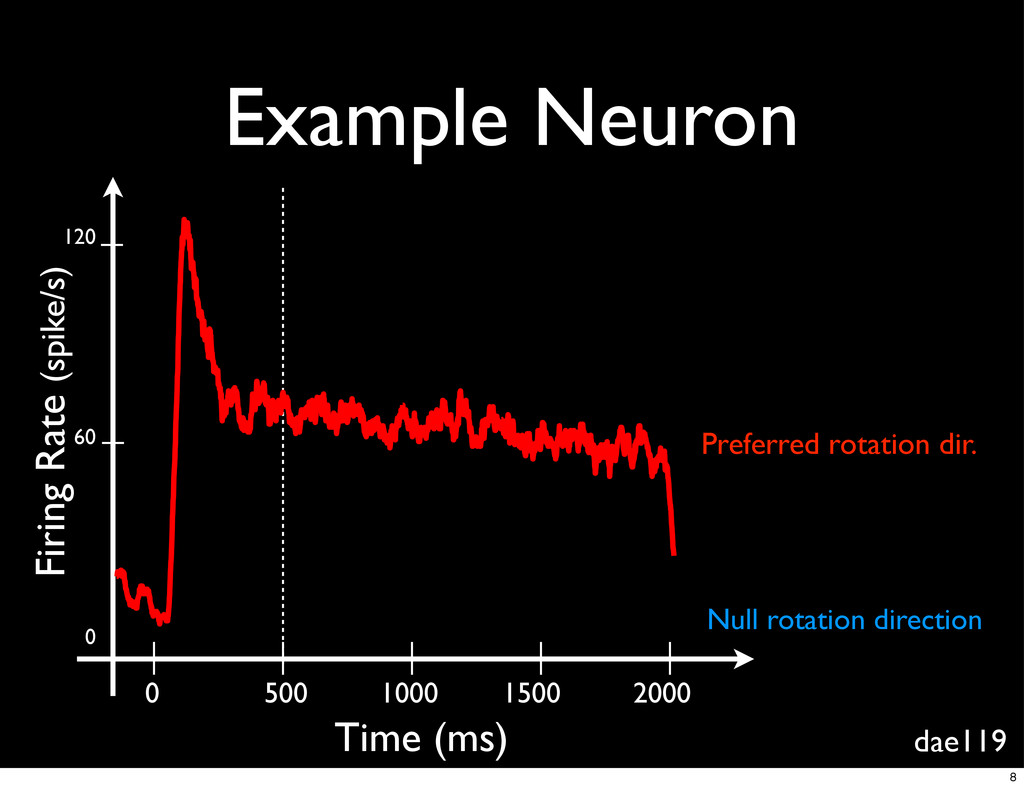
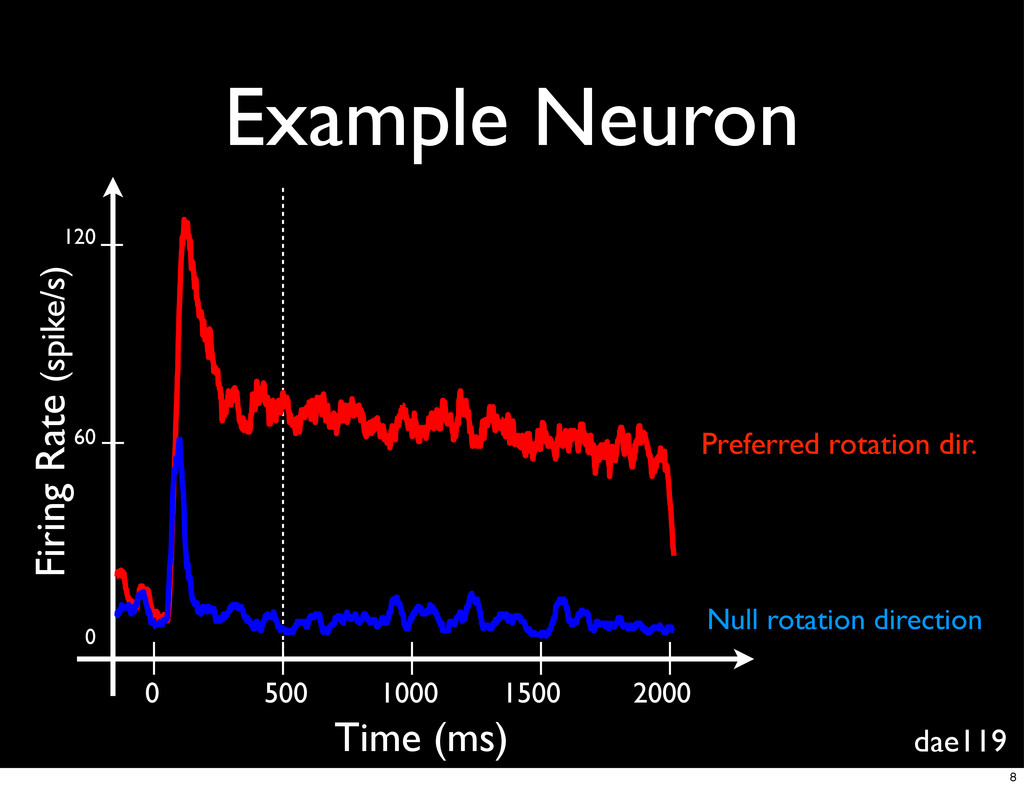
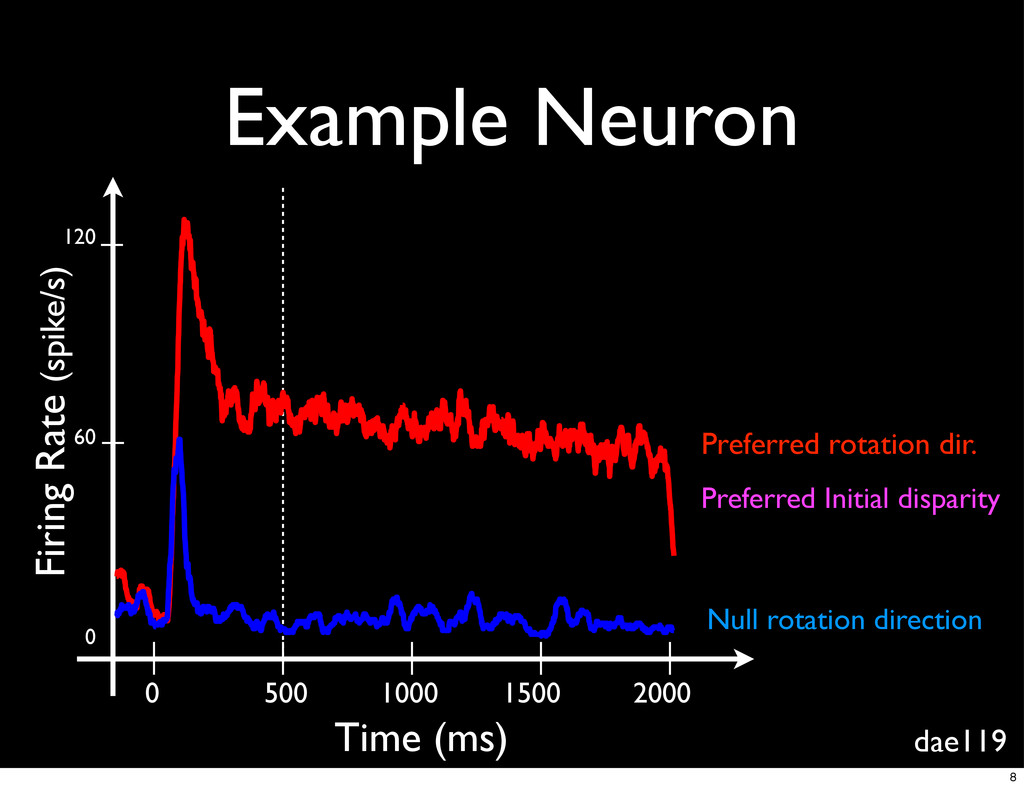
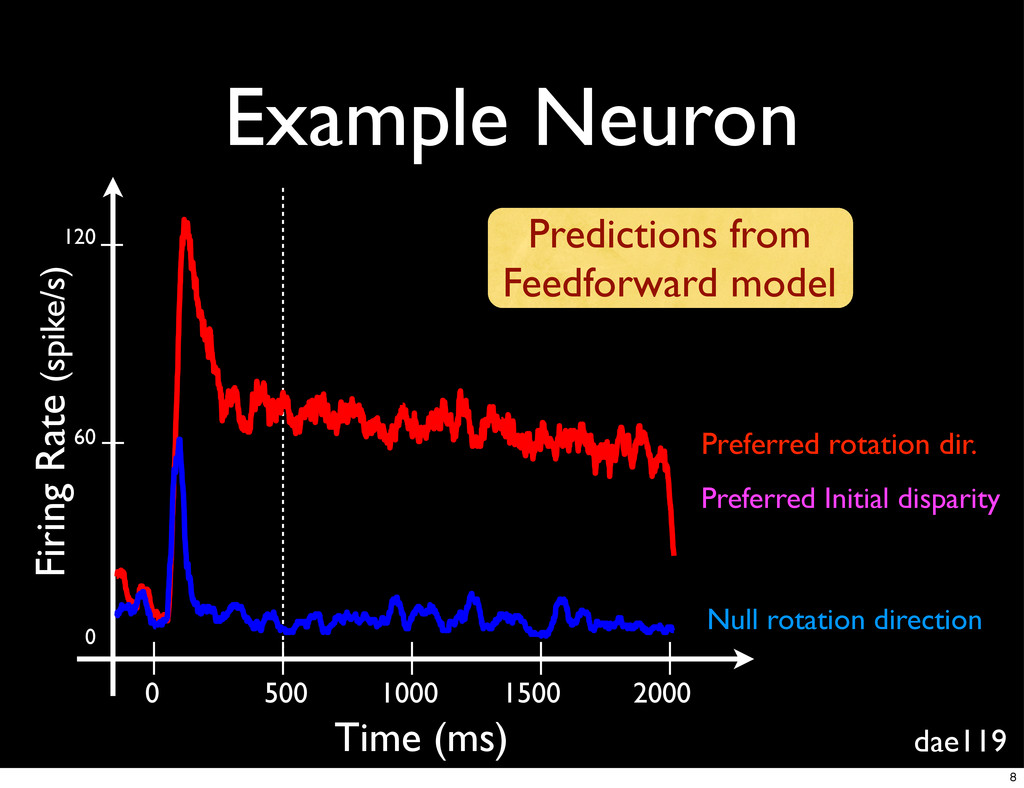
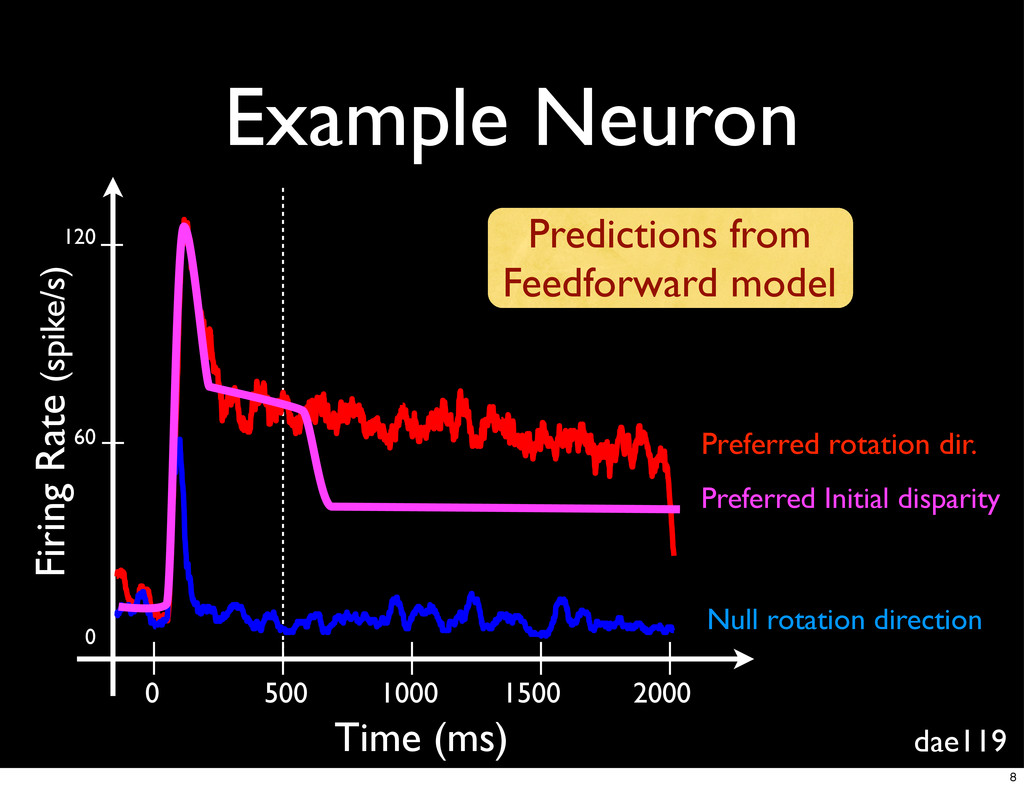
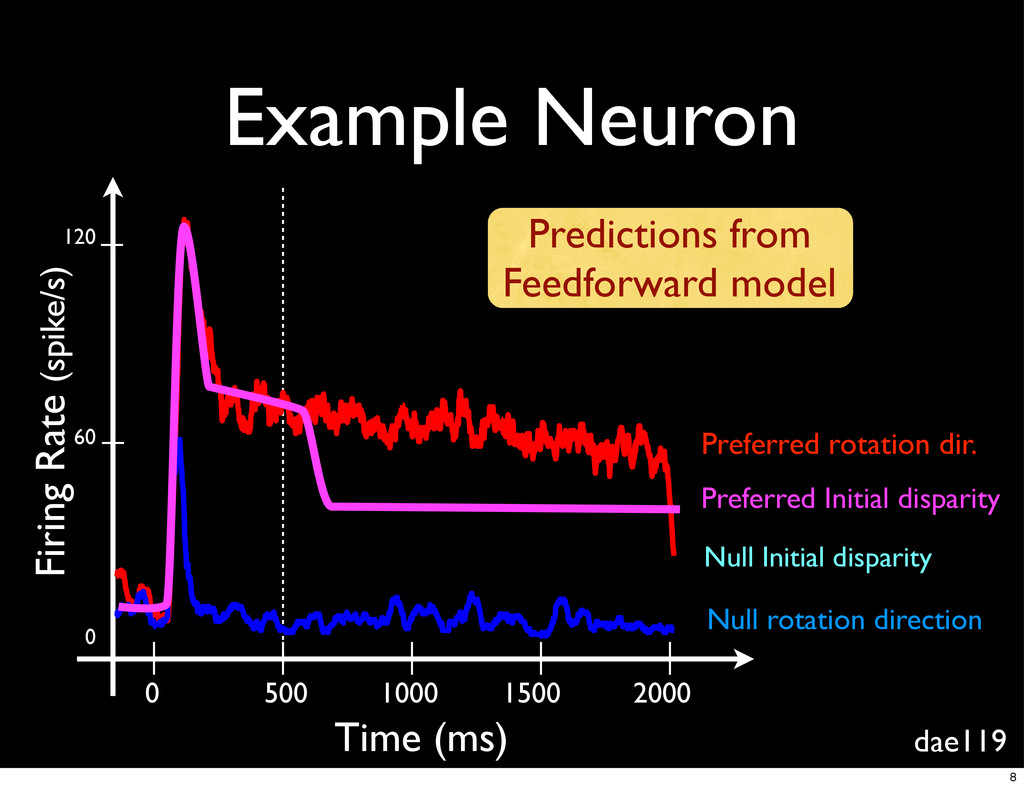
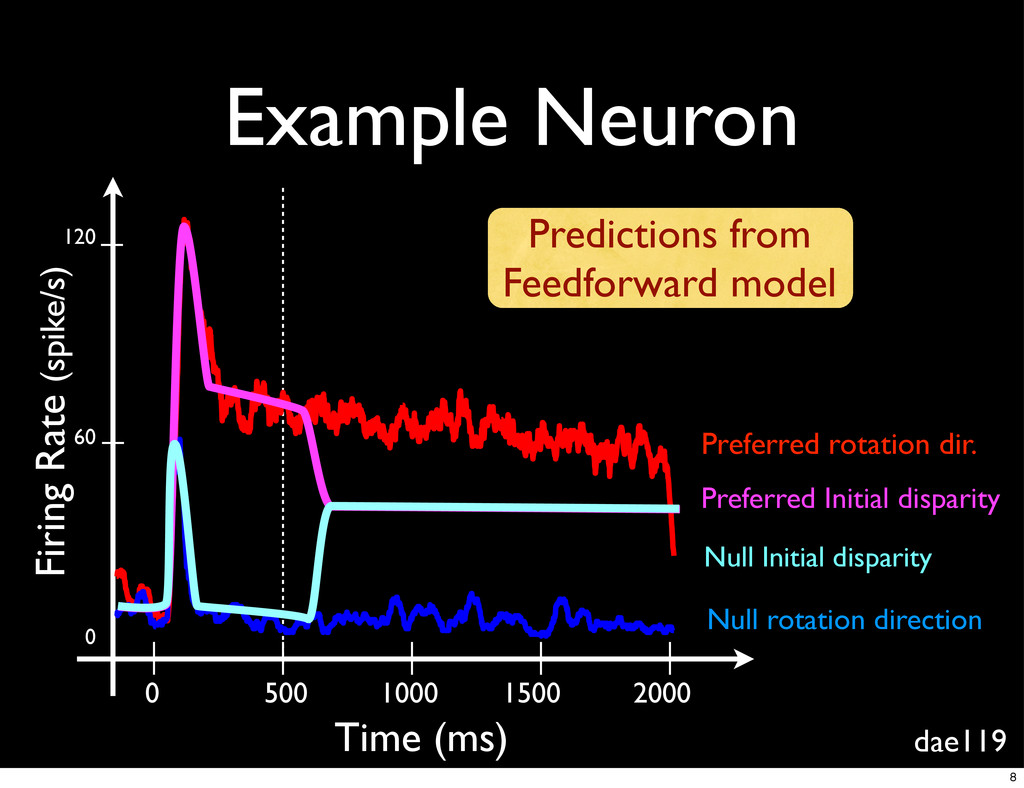
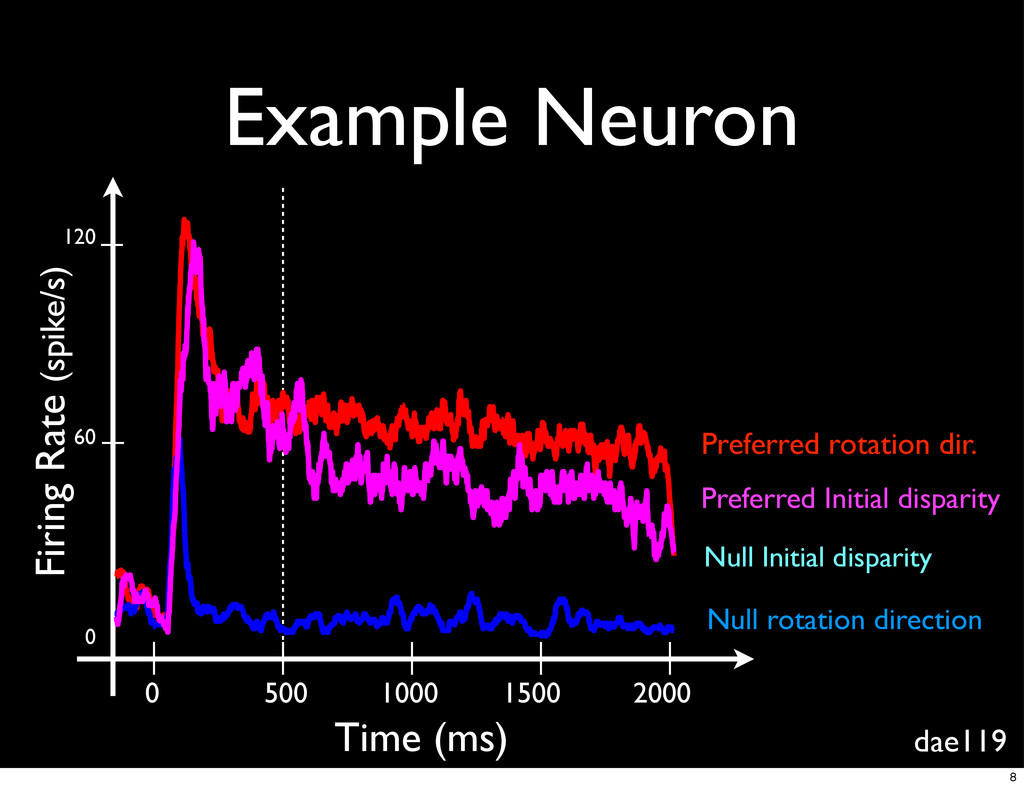
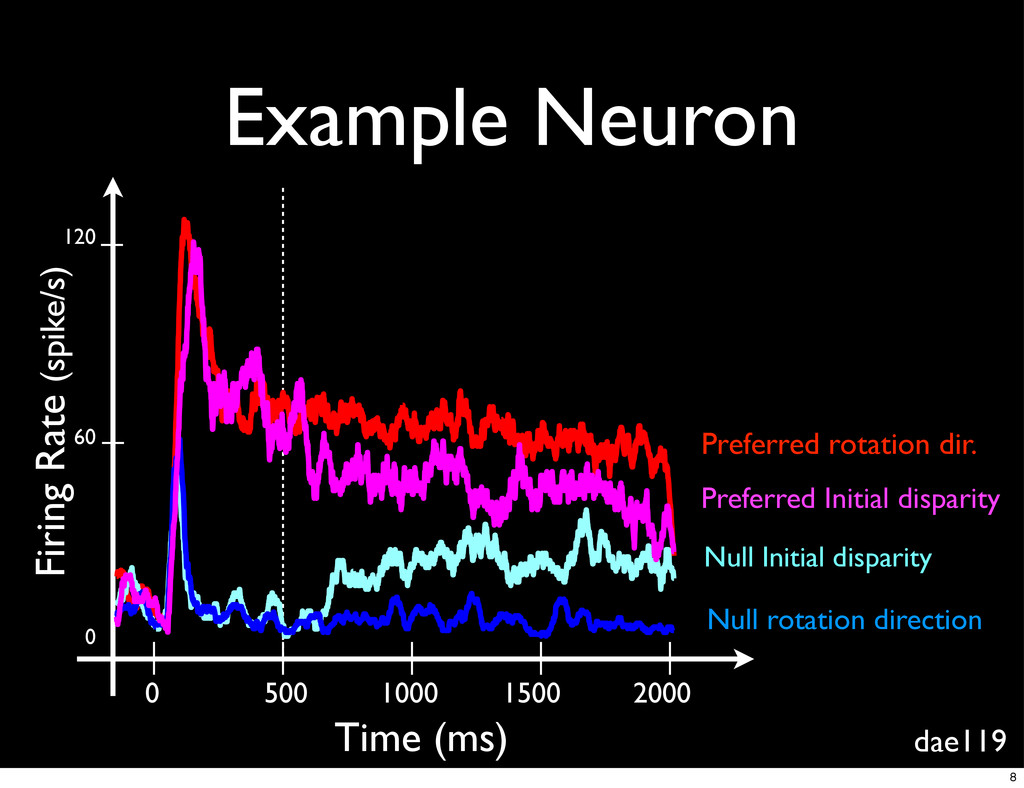
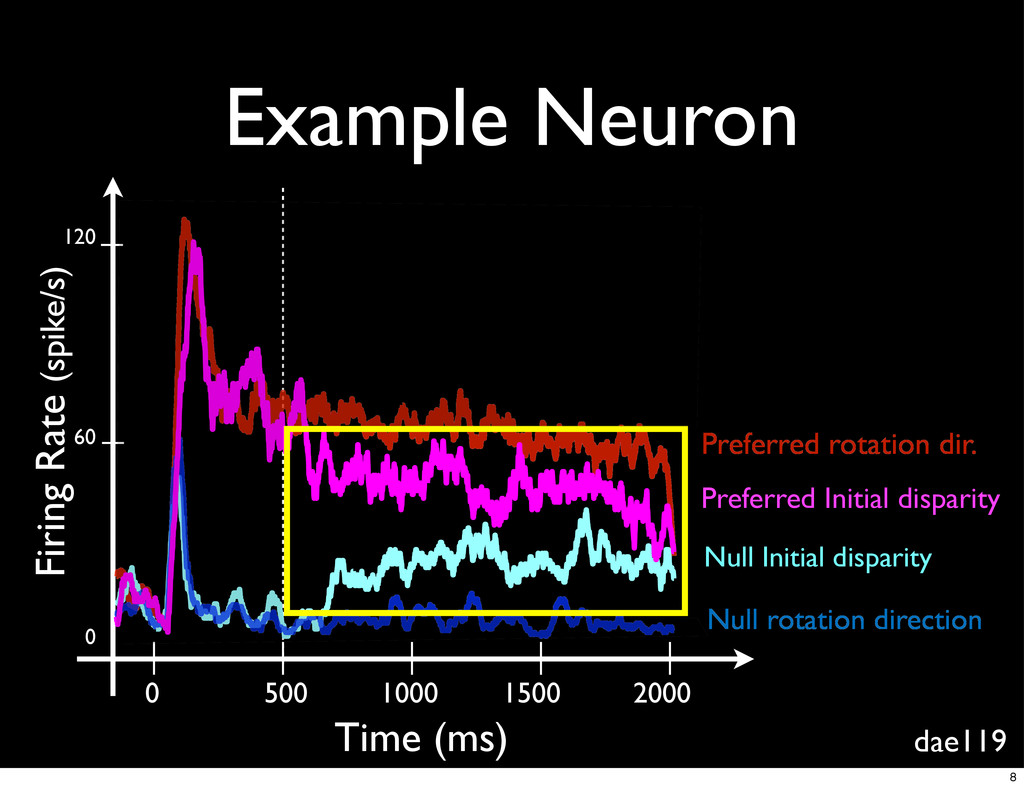
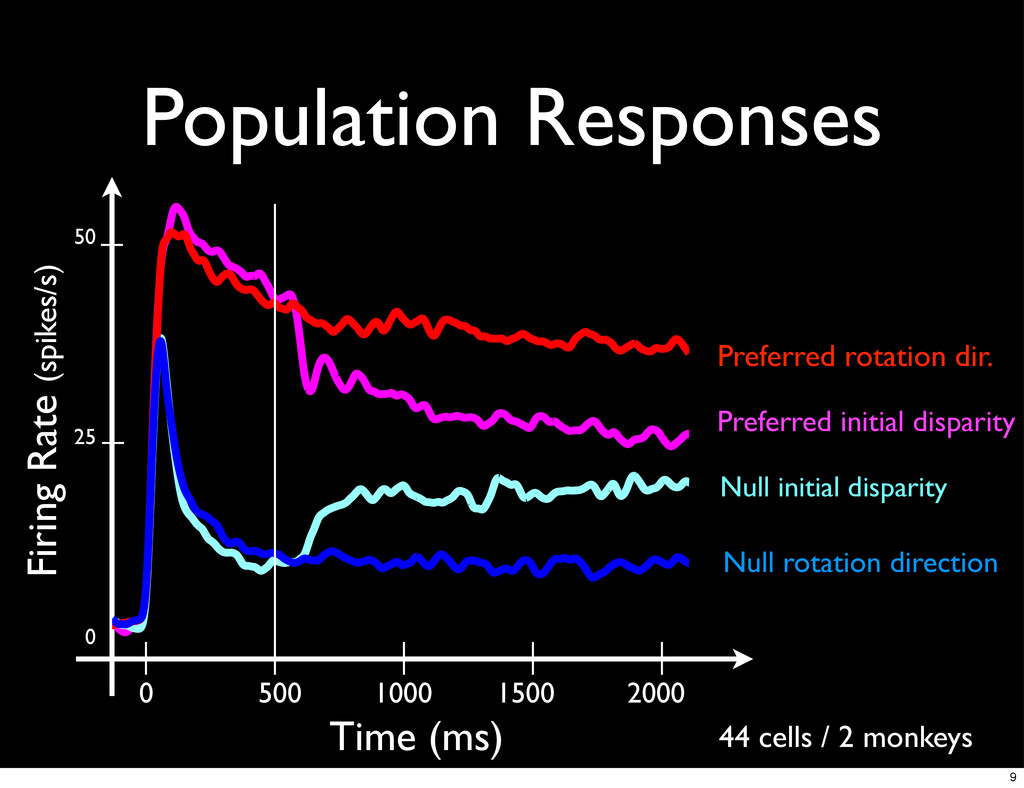
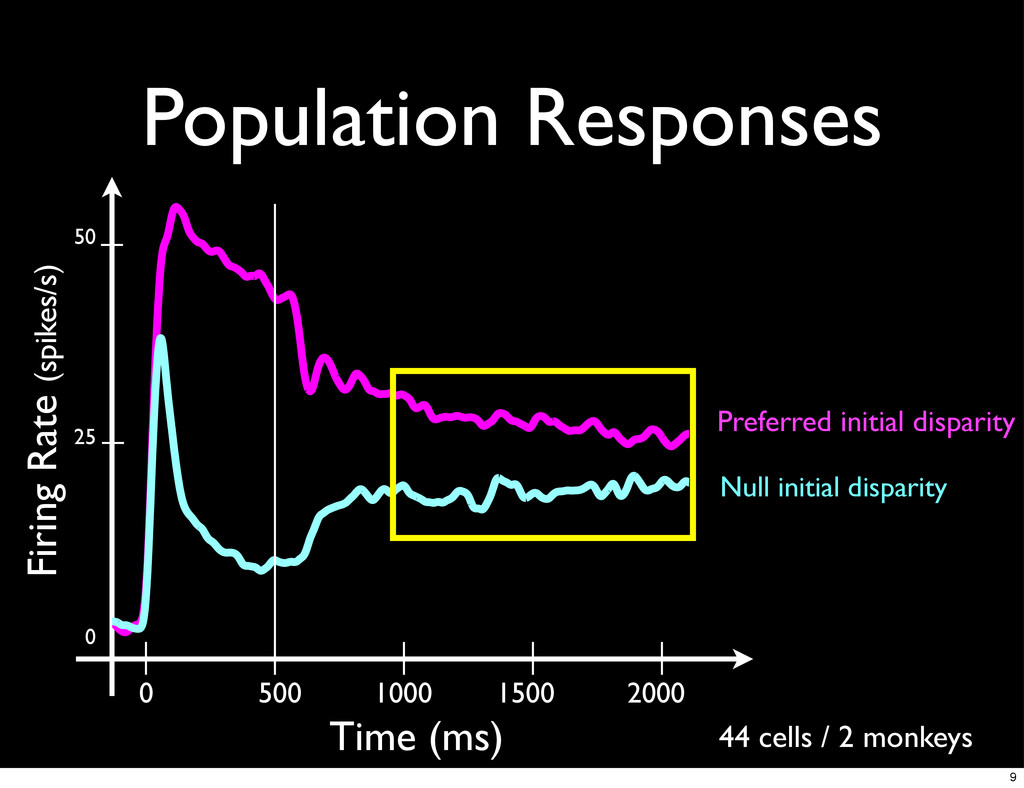
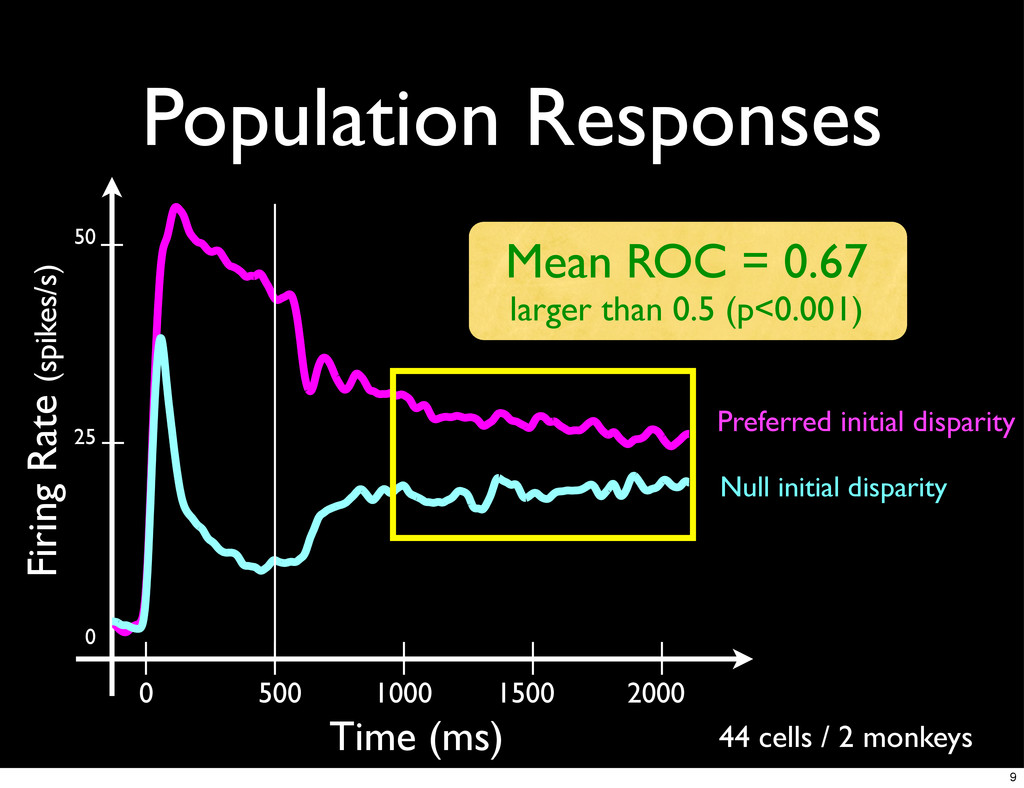
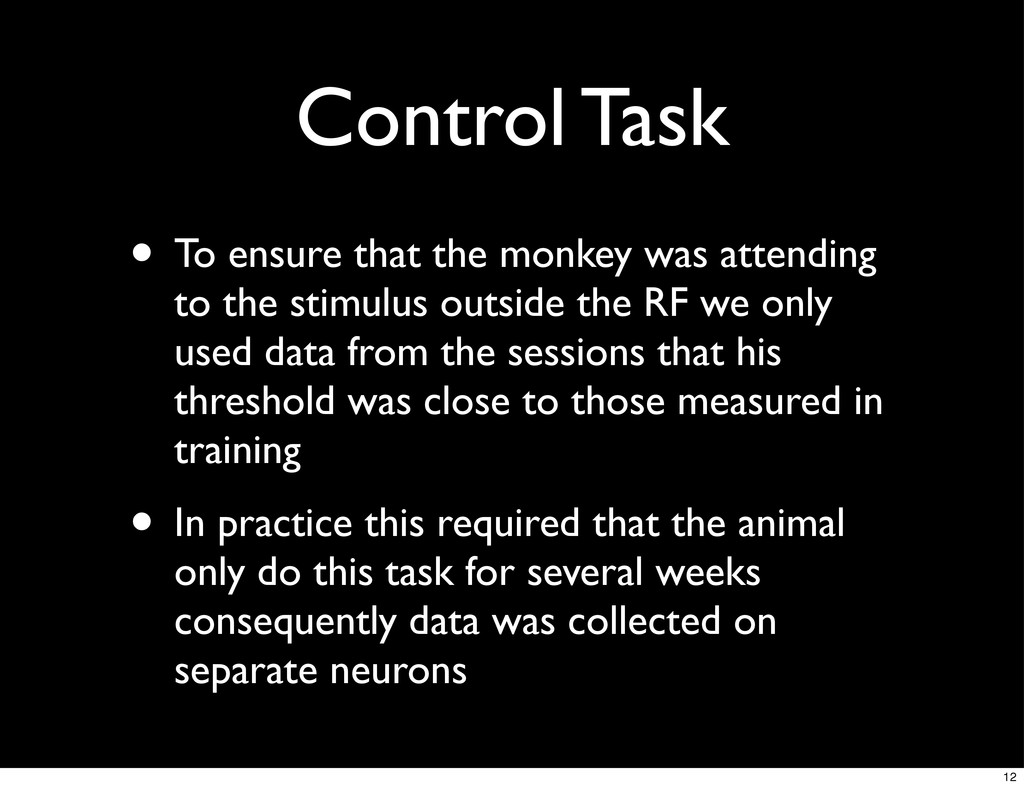
    to the stimulus outside the RF we only used data from the sessions that his threshold was close to those measured in training • In practice this required that the animal only do this task for several weeks consequently data was collected on separate neurons 12
  36. Population Responses Time (ms) Firing Rate 20 cells / 1

    monkey Preferred Initial disparity Null Initial disparity 0 500 1000 1500 2000 13
  37. Population Responses Time (ms) Firing Rate 20 cells / 1

    monkey Preferred Initial disparity Null Initial disparity 0 500 1000 1500 2000 Mean ROC = 0.55 smaller than main effect (p<0.001) No purely feedforward model is sufficient to explain the main effect 13
  38. Conclusions • This directly demonstrates a top-down signal that contributes

    to the correlation between choices and firing rates in MT • This top-down signal is large enough to generate the reported choice probabilities of MT neurons 14