Upgrade to Pro — share decks privately, control downloads, hide ads and more …

An Introduction to Graph Theory for OSINT

Andrew Hay
July 28, 2017

An Introduction to Graph Theory for OSINT

This session aims to gently introduce graph theory and the applied use of graphs for people who, like the speaker, consider themselves lacking the often perceived advanced math, science, and computer programming knowledge needed to harness their power.

The session will include live attendee interaction to help explain the general concepts of graph theory in a safe and inclusive way that should help solidify basic knowledge.

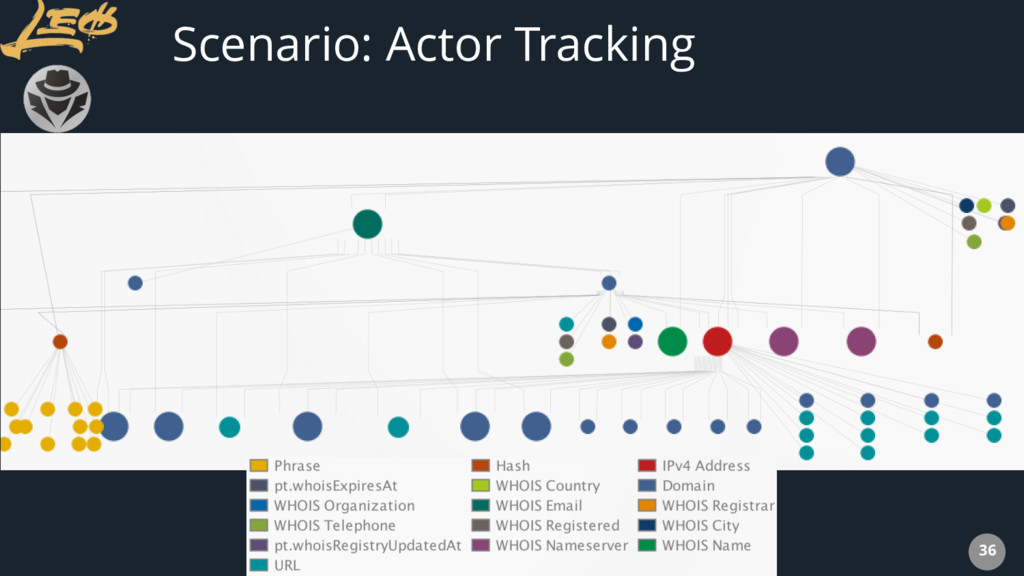
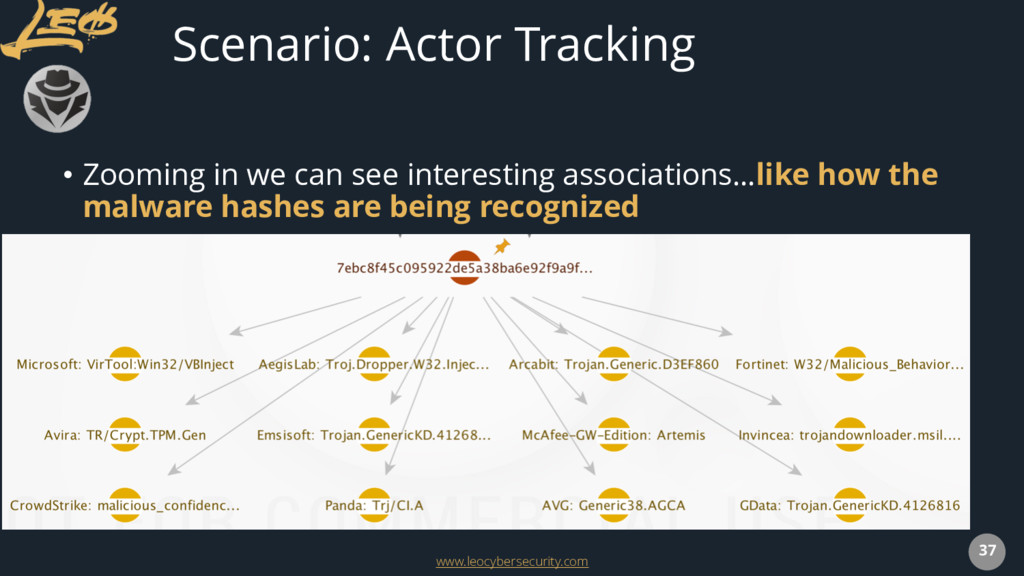
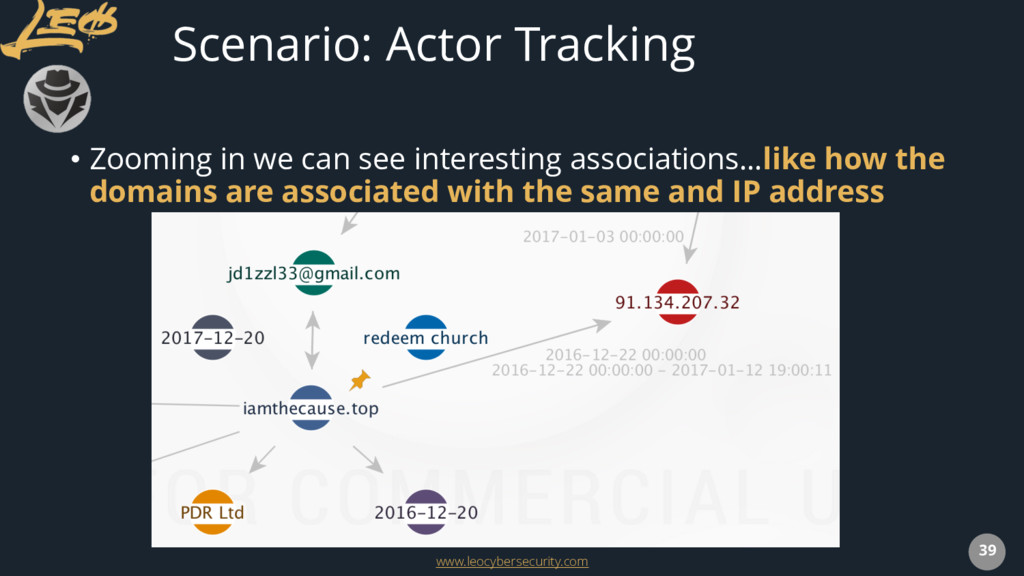
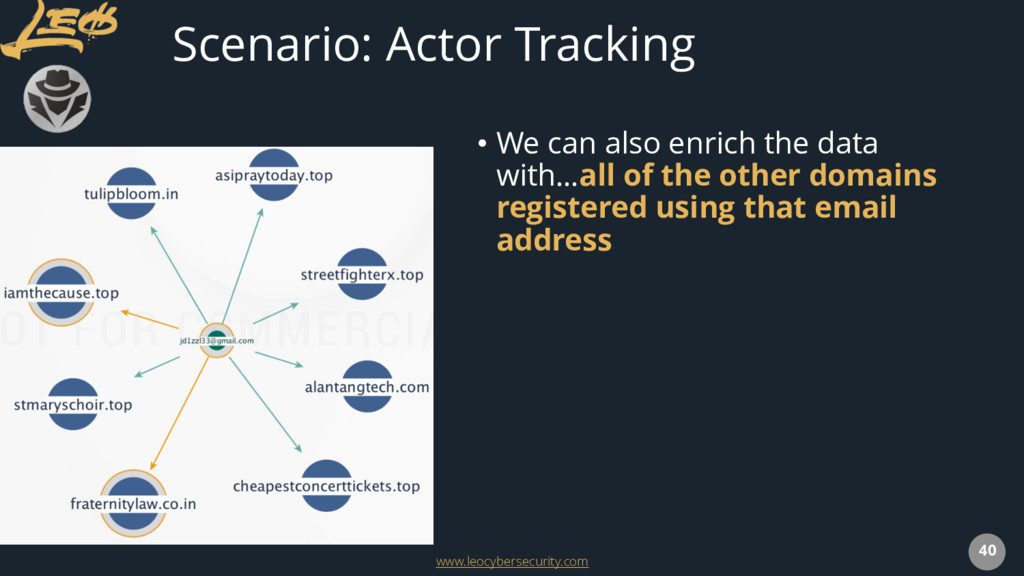
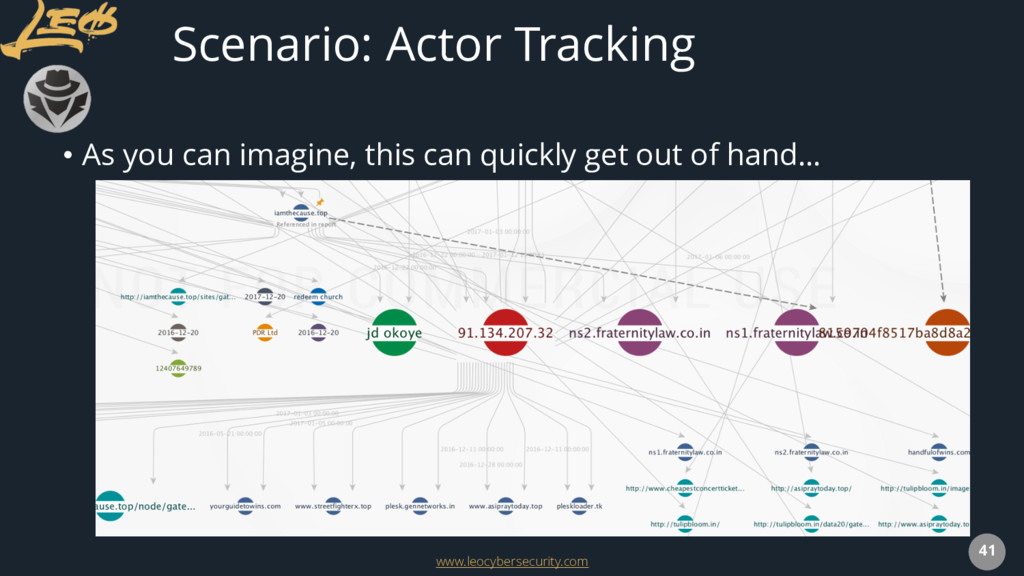
Once everyone understands what a graph can be used for we will discuss its applied use with several use cases including the tracking of security threats, construction of attacker profiles, and even using graphs to better understand organizational risk based the introduction of new tools, processes, or legal requirements.

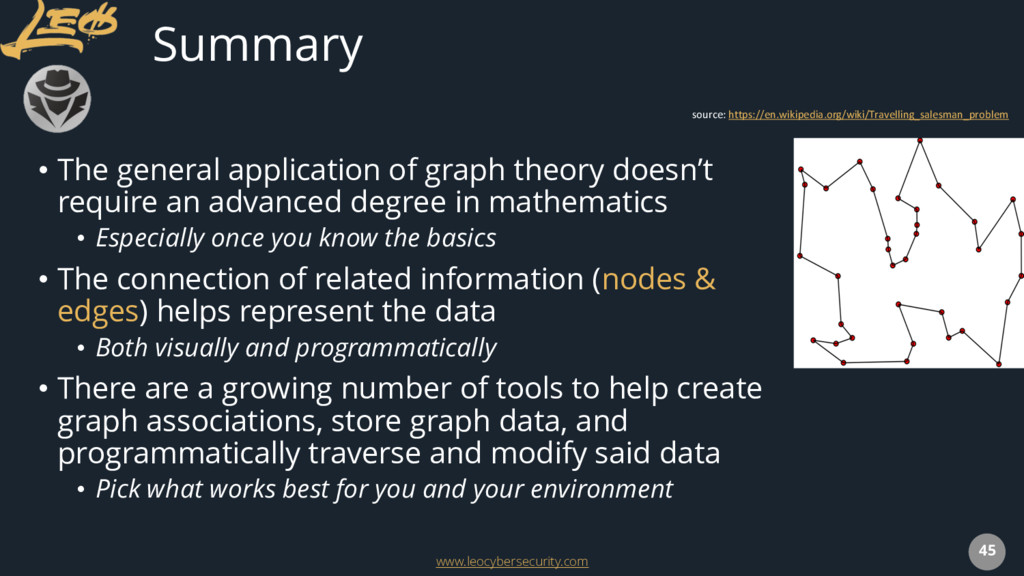
Attendees may not leave with a Ph.D. but they’ll certainly walk away with a firm understanding of graph theory and how to construct, deploy, and maintain graphs for security and compliance initiatives within their organization.

Andrew Hay

July 28, 2017
Tweet

More Decks by Andrew Hay

Other Decks in Research

Transcript

  1. www.leocybersecurity.com 1 An Introduction to Graph Theory for OSINT (For

    Hacker People Who Can’t Math Good) Andrew Hay Andrew Hay, CTO, LEO Cyber Security +1.650.532.3555 [email protected] leocybersecurity.com @andrewsmhay
  2. www.leocybersecurity.com 2 Session Overview • A gentle introduction to graph

    theory • Graphs in every day life • Freely available tools • The application of graphs in an OSINT context • Summary
  3. www.leocybersecurity.com 4 A Graph Is… • A graph is a

    collection of • vertices (i.e. nodes, dots) • where a vertex is an entity which represents some object (e.g. a person, a place, etc.) • edges (i.e. relationships, lines) • where an edge represents the relationship between two vertices source: http://tinkerpop.apache.org/
  4. www.leocybersecurity.com 5 • Diagram above shows a graph with two

    vertices • One with a unique identifier of 1 • Another with a unique identifier of 3 • There is an edge connecting the two with a unique identifier of 9 • It is important to consider that the edge has a direction which goes out from vertex 1 and in to vertex 3 source: http://tinkerpop.apache.org/ A Graph Is (continued)…
  5. www.leocybersecurity.com 6 • To give some meaning to this basic

    structure, vertices and edges can each be given labels to categorize them • You can now see that a vertex 1 is a person and vertex 3 is a software vertex source: http://tinkerpop.apache.org/ A Graph Is (continued)…
  6. www.leocybersecurity.com 7 • They are joined by a created edge

    which allows you to see that a person created software • The label and the id are reserved attributes of vertices and edges, but you can add your own arbitrary properties as well source: http://tinkerpop.apache.org/ A Graph Is (continued)…
  7. www.leocybersecurity.com 10 • You’ll often hear the words network and

    graph used interchangeably…and there is nothing wrong with that • If the edges in a network are directed (i.e. pointing in only one direction) the network is called a directed network or a directed graph, sometimes digraph for short • When drawing a directed network, the edges are typically drawn as arrows indicating the direction source: http://mathinsight.org/definition/network A Little More Advanced Graph Theory
  8. www.leocybersecurity.com 11 • If all edges are bidirectional, or undirected,

    the network is an undirected network (or undirected graph) A Little More Advanced Graph Theory source: http://mathinsight.org/definition/network
  9. www.leocybersecurity.com 12 A Little More Advanced Graph Theory • A

    small directed network where the edges and nodes have different weights, as indicated by their sizes • Variations • A small undirected network where the nodes and edges have different types, as indicated by their colors and line styles source: http://mathinsight.org/image/small_undirected_node_edge_types_network source: http://mathinsight.org/image/small_directed_weighted_nodes_edges_network
  10. www.leocybersecurity.com 14 Graphs in Every Day Life: Internet • Everyone

    has seen a visual representation of the Internet • Often, colors indicate operator of network, country, etc. • Structure determined by sending a storm of IP packets out randomly across the network • Each packet is programmed to self-destruct after a delay, and when this happens, the packet failure notice reports back the path the packet took before it died source: http://mathinsight.org/image/internet_map_jurvetson_2004
  11. www.leocybersecurity.com 15 Graphs in Every Day Life: More Examples… •

    Mapping • Google maps, self-driving cars, etc. • “Hey, Siri, how do I get to 1 Main Street?” • Perception/Attitude Analysis • What hashtags are trending right now? • Which Presidential candidate is being talked about most on which social media platform? • And, of course, OSINT! source: https://datasemantics.files.wordpress.com/2013/12/graph3.png
  12. www.leocybersecurity.com 17 Tools: Google Fusion Tables • support.google.com/fusiontables/answer/256 6732?hl=en –

    Network Graph • Basic network mapping tool • Some useful filter functionality • Lacks the deep customization options and analysis functionality • Can produce insightful visualizations • developers.google.com/fusiontables • Create, update, and delete tables and table data • Issue SQL-like queries
  13. www.leocybersecurity.com 18 Tools: Graphviz • www.graphviz.org • Open source graph

    visualization software • The Graphviz layout programs take descriptions of graphs in a simple text language, and make diagrams in useful formats • Images, SVG, PDF, Postscript , interactive graph browser • Many useful features for diagrams • options for colors, fonts, tabular node layouts, line styles, hyperlinks, and custom shapes source: http://www.graphviz.org/content/profile
  14. www.leocybersecurity.com 19 Tools: Visual Investigate Scenarios (VIS) • vis.occrp.org •

    Designed to assist investigative journalists, activists and others in mapping complex business or crime networks • Help investigators understand and explain corruption, organized crime and other wrongdoings and to translate complex narratives into simple, universal visual language • Customizable, dynamic html5 visualization templates • Illustrate entities, networks and complex configurations of data
  15. www.leocybersecurity.com 20 Tools: Gephi • gephi.org • Desktop tool for

    performing powerful network analysis and creating network visualizations • Described as being like Photoshop™ but for graph data • The user interacts with the representation, manipulate the structures, shapes and colors to reveal hidden patterns • Designed to help data analysts to make hypothesis, intuitively discover patterns, isolate structure singularities or faults during data sourcing source: https://gephi.org/screenshots/
  16. www.leocybersecurity.com 21 Tools: OpenGraphiti • www.opengraphiti.com • OpenGraphiti is a

    free and open source 3D data visualization engine created by Thibault Reuille of OpenDNS • Designed for data scientists to visualize semantic networks and to work with them It offers an easy-to-use API with several associated libraries to create custom- made datasets
  17. www.leocybersecurity.com 22 Tools: Maltego • www.paterva.com/web7/buy/malte go-clients/maltego-ce.php • Maltego CE

    is the community editio • Available for free for everyone after a quick registration • Interactive data mining tool • Renders directed graphs for link analysis • Used in online investigations for finding relationships between pieces of information from various sources located on the Internet source: www.paterva.com
  18. www.leocybersecurity.com 23 Tools: Maltego (continued…) • www.paterva.com/web7/buy/maltego- clients/casefile.php • CaseFile

    is Paterva's answer to the offline intelligence problem • Allows for analysts to examine links between offline data • Same graphing application as Maltego without the ability to run transforms • CaseFile gives you the ability to quickly add, link and analyze data source: www.paterva.com
  19. www.leocybersecurity.com 24 Graph Databases: neo4j • neo4j.com • Graph database

    management system developed by Neo Technology, Inc • ACID-compliant transactional database with native graph storage and processing • Implemented in Java • Accessible from software written in other languages using the Cypher Query Language • Exposes a transactional HTTP endpoint source: https://neo4j.com/
  20. www.leocybersecurity.com 25 Graph Databases: OrientDB • orientdb.com • Open source

    NoSQL database management system • Written in Java • Multi-model database, supporting graph, document, key/value, and object models • Relationships are managed as in graph databases with direct connections between records • Supports schema-less, schema-full, and schema-mixed modes source: http://orientdb.com/orientdb/
  21. www.leocybersecurity.com 26 Graph Databases: Titan • titan.thinkaurelius.com • Scalable graph

    database optimized for • Storing and querying graphs • Containing hundreds of billions of vertices and edges • Distributed across a multi-machine cluster • Support for various storage backends • Support for global graph data analytics, reporting, and ETL through integration with big data platforms • Native integration with the TinkerPop graph stack source: http://titan.thinkaurelius.com/
  22. www.leocybersecurity.com 27 Graph Stack: Apache TinkerPop • tinkerpop.apache.org • Open

    source Graph Computing Framework • Goal is to make it easy for developers to create graph applications by providing APIs and tools that simplify their endeavors • Abstraction layer over different graph databases and different graph processors • As an abstraction layer, TinkerPop provides a way to avoid vendor lock-in to a specific database or processor source: https://tinkerpop.apache.org/
  23. www.leocybersecurity.com 28 Development Modules • NetworkX • networkx.github.io • Package

    for the creation, manipulation, and study of the structure, dynamics, and functions of complex networks • Graph-tool • graph-tool.skewed.de • Manipulation and statistical analysis of graphs • SNAP for Python • snap.stanford.edu/snappy/ • General purpose, high performance system for analysis and manipulation of large networks • Written in C++ and optimized for maximum performance and compact graph representation • Scales to massive networks with hundreds of millions of nodes, and billions of edges
  24. www.leocybersecurity.com 29 Development Modules • semanticnet • github.com/ThibaultReuille/semant icnet •

    Small python library to create semantic graphs in JSON • Datasets can then be visualized with OpenGraphiti • Plotly for Python • plot.ly/ipython-notebooks/network- graphs • Store position as node attribute data • Add, change, delete nodes, node color, connections, etc.
  25. www.leocybersecurity.com 30 Development Modules • vis.js • visjs.org • Designed

    to be easy to use, to handle large amounts of dynamic data, and to enable manipulation of and interacti on with the data • sigmajs • sigmajs.org • Allows developers to integrate network exploration in rich Web applications • JSNetworkX • jsnetworkx.org • JavaScript port of the NetworkX graph library • Cytoscape.js • js.cytoscape.org • Fully featured graph library written in pure JS • Designed for users first, for both front facing app and developer use cases
  26. www.leocybersecurity.com 32 Scenario: Actor Tracking • “New Phishing Campaign Targets

    South-East Asia”* • http://www.minerva-labs.com/post/new-phishing-campaign-targets- south-east-asia • Malware variant that was distributed via phishing emails in south-east Asia. • The binary mimicked Navicat and had multiple info-stealing capabilities - and possibly a later stage POS oriented module. * source: https://app.threatconnect.com/auth/incident/incident.xhtml?incident=3440670
  27. www.leocybersecurity.com 33 • Let’s load the indicators of compromise (IOC)

    from the blog post into a tool • This time, we’ll use Maltego Community Edition (CE) source: www.paterva.com Scenario: Actor Tracking
  28. www.leocybersecurity.com 34 • Add the various elements that you want

    to track • Hashes • Domains • IP addresses • Email addresses • etc. Scenario: Actor Tracking
  29. www.leocybersecurity.com 35 • Use the transforms to enrich the data

    • VirusTotal Public • ThreatCrowd • PassiveTotal • Get Passive DNS with Time • Get Whois Details • Whois Search by Email Address • Avoid running “All Transforms” Scenario: Actor Tracking
  30. www.leocybersecurity.com 37 • Zooming in we can see interesting associations…like

    how the malware hashes are being recognized Scenario: Actor Tracking
  31. www.leocybersecurity.com 38 • Zooming in we can see interesting associations…like

    how the domains are associated with the same registrant email address Scenario: Actor Tracking
  32. www.leocybersecurity.com 39 • Zooming in we can see interesting associations…like

    how the domains are associated with the same and IP address Scenario: Actor Tracking
  33. www.leocybersecurity.com 40 • We can also enrich the data with…all

    of the other domains registered using that email address Scenario: Actor Tracking
  34. www.leocybersecurity.com 41 • As you can imagine, this can quickly

    get out of hand… Scenario: Actor Tracking
  35. www.leocybersecurity.com 42 • Just because you CAN graph or run

    a transform on something… • Consider using only the data you need for a particular task or project • If you want to experiment with different transforms, data points, nodes, edges, etc… General Suggestions
  36. www.leocybersecurity.com 43 • Just because you CAN graph or run

    a transform on something… • Consider using only the data you need for a particular task or project • If you want to experiment with different transforms, data points, nodes, edges, etc… General Suggestions USE A NEW GRAPH AND DON’T TINKER WITH THE MAIN ONE
  37. www.leocybersecurity.com 45 Summary • The general application of graph theory

    doesn’t require an advanced degree in mathematics • Especially once you know the basics • The connection of related information (nodes & edges) helps represent the data • Both visually and programmatically • There are a growing number of tools to help create graph associations, store graph data, and programmatically traverse and modify said data • Pick what works best for you and your environment source: https://en.wikipedia.org/wiki/Travelling_salesman_problem
  38. www.leocybersecurity.com 46 An Introduction to Graph Theory for OSINT (For

    Hacker People Who Can’t Math Good) Andrew Hay Andrew Hay, CTO, LEO Cyber Security +1.650.532.3555 [email protected] leocybersecurity.com @andrewsmhay FIN