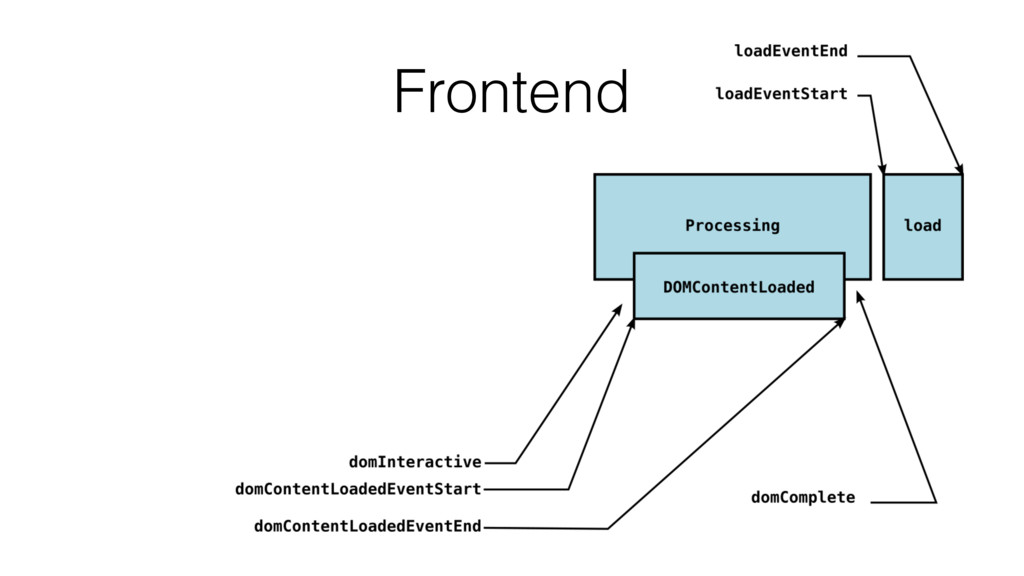
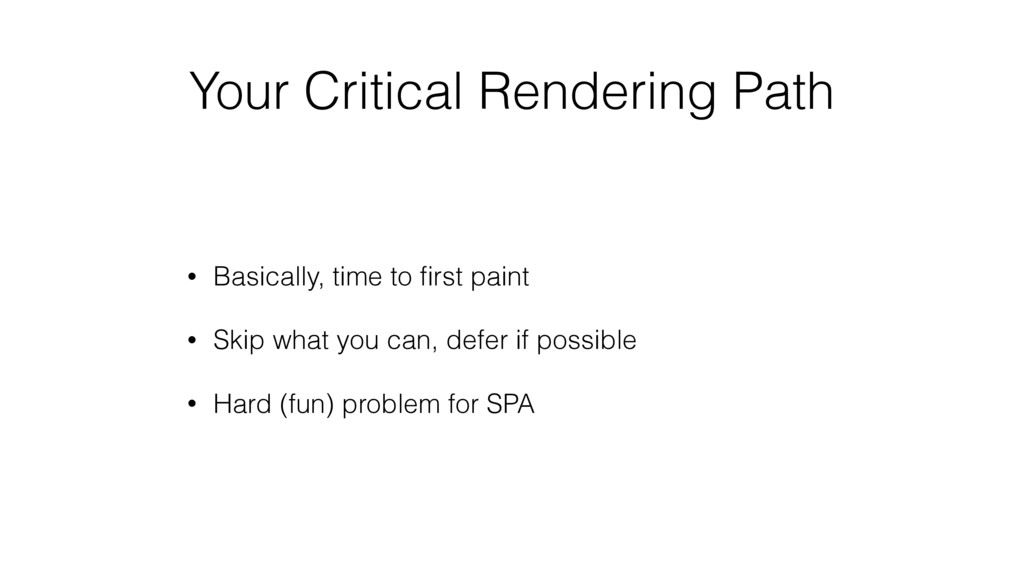
as response bytes come in • Any CSS or synchronous scripts will cause other resources to be loaded, while stalling the page load process • Browser may render parts of your page before any of these events fire (may lead to flash of unstyled text)
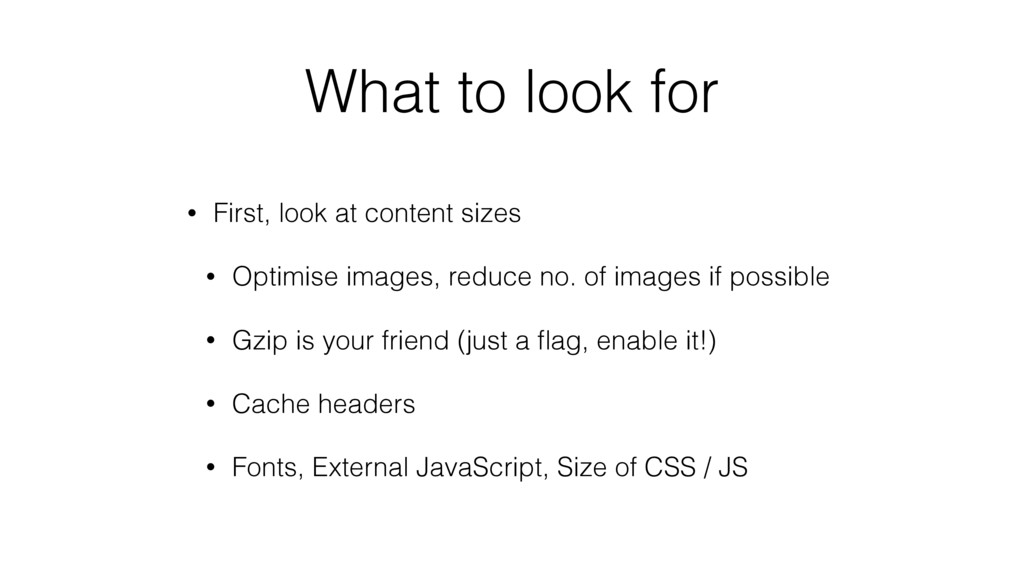
• Optimise images, reduce no. of images if possible • Gzip is your friend (just a flag, enable it!) • Cache headers • Fonts, External JavaScript, Size of CSS / JS
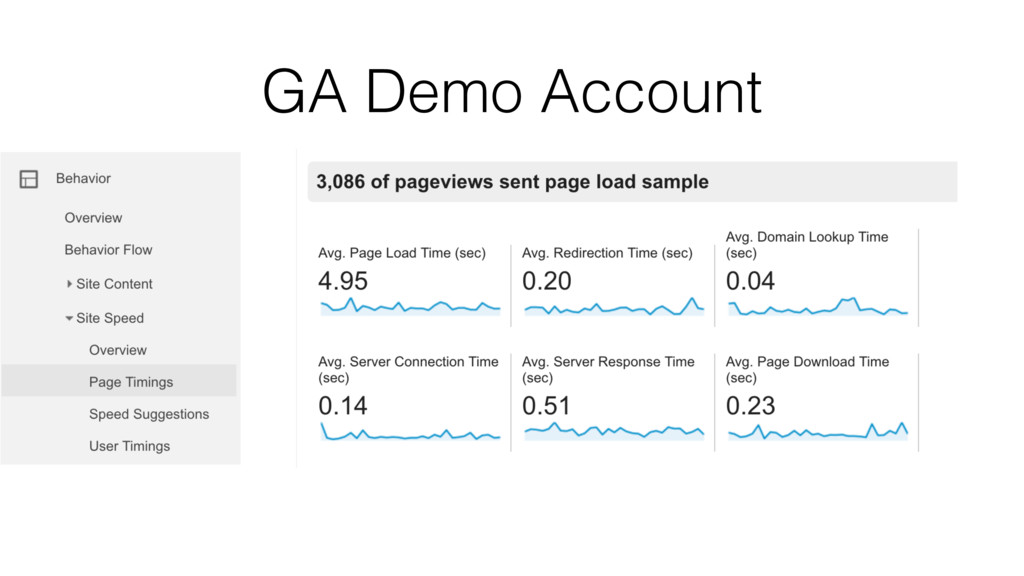
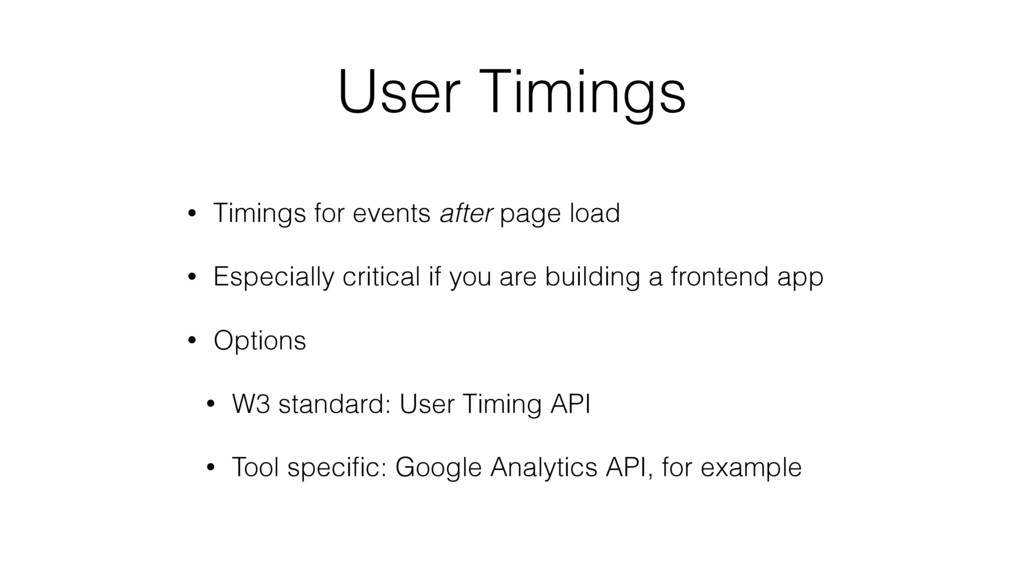
by default by Google Analytics • But it’s in sampling mode by default (1% of sessions only) • You can set to 100% if need be ga('create', 'UA-XXX-Y', {'siteSpeedSampleRate':100});
data • Difficult to debug individual cases (follow a single user’s journey) • Sometimes best to get on a remote desktop session with the user, if at all possible
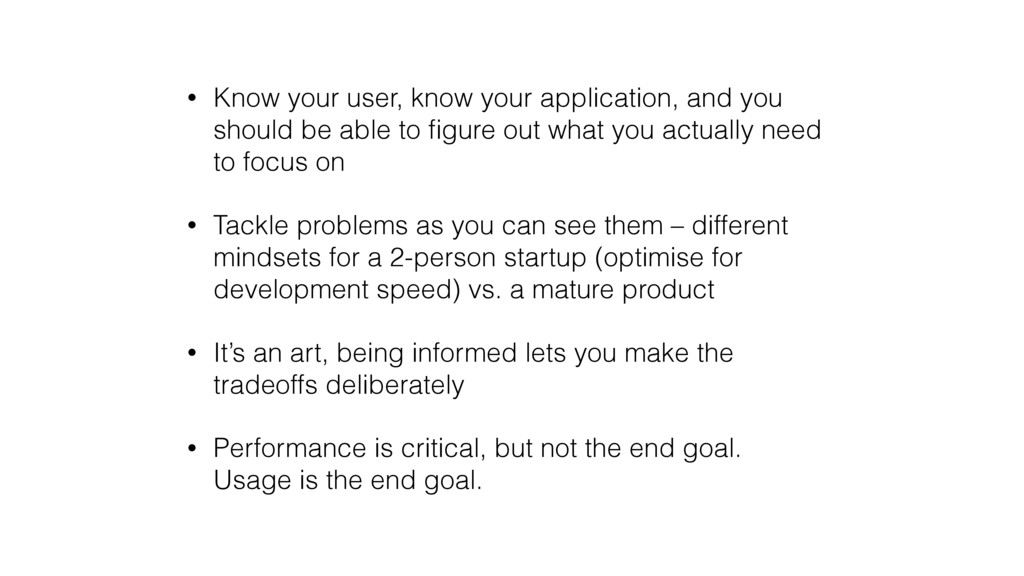
be able to figure out what you actually need to focus on • Tackle problems as you can see them – different mindsets for a 2-person startup (optimise for development speed) vs. a mature product • It’s an art, being informed lets you make the tradeoffs deliberately • Performance is critical, but not the end goal. Usage is the end goal.
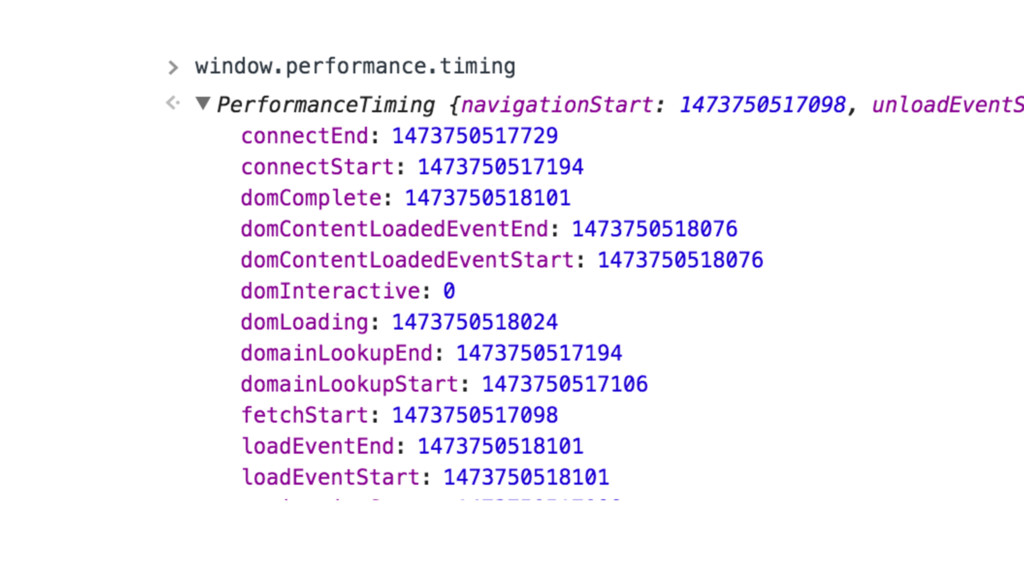
![• Supported on all modern browsers [caniuse.com/#feat=nav-timing] • Enabled](https://files.speakerdeck.com/presentations/c724f01c35b84ce0954f9bbe49f10e6b/slide_24.jpg)
![User Timings in GA • ga('send', 'timing', [timingCategory], [timingVar], [timingValue]);](https://files.speakerdeck.com/presentations/c724f01c35b84ce0954f9bbe49f10e6b/slide_34.jpg)