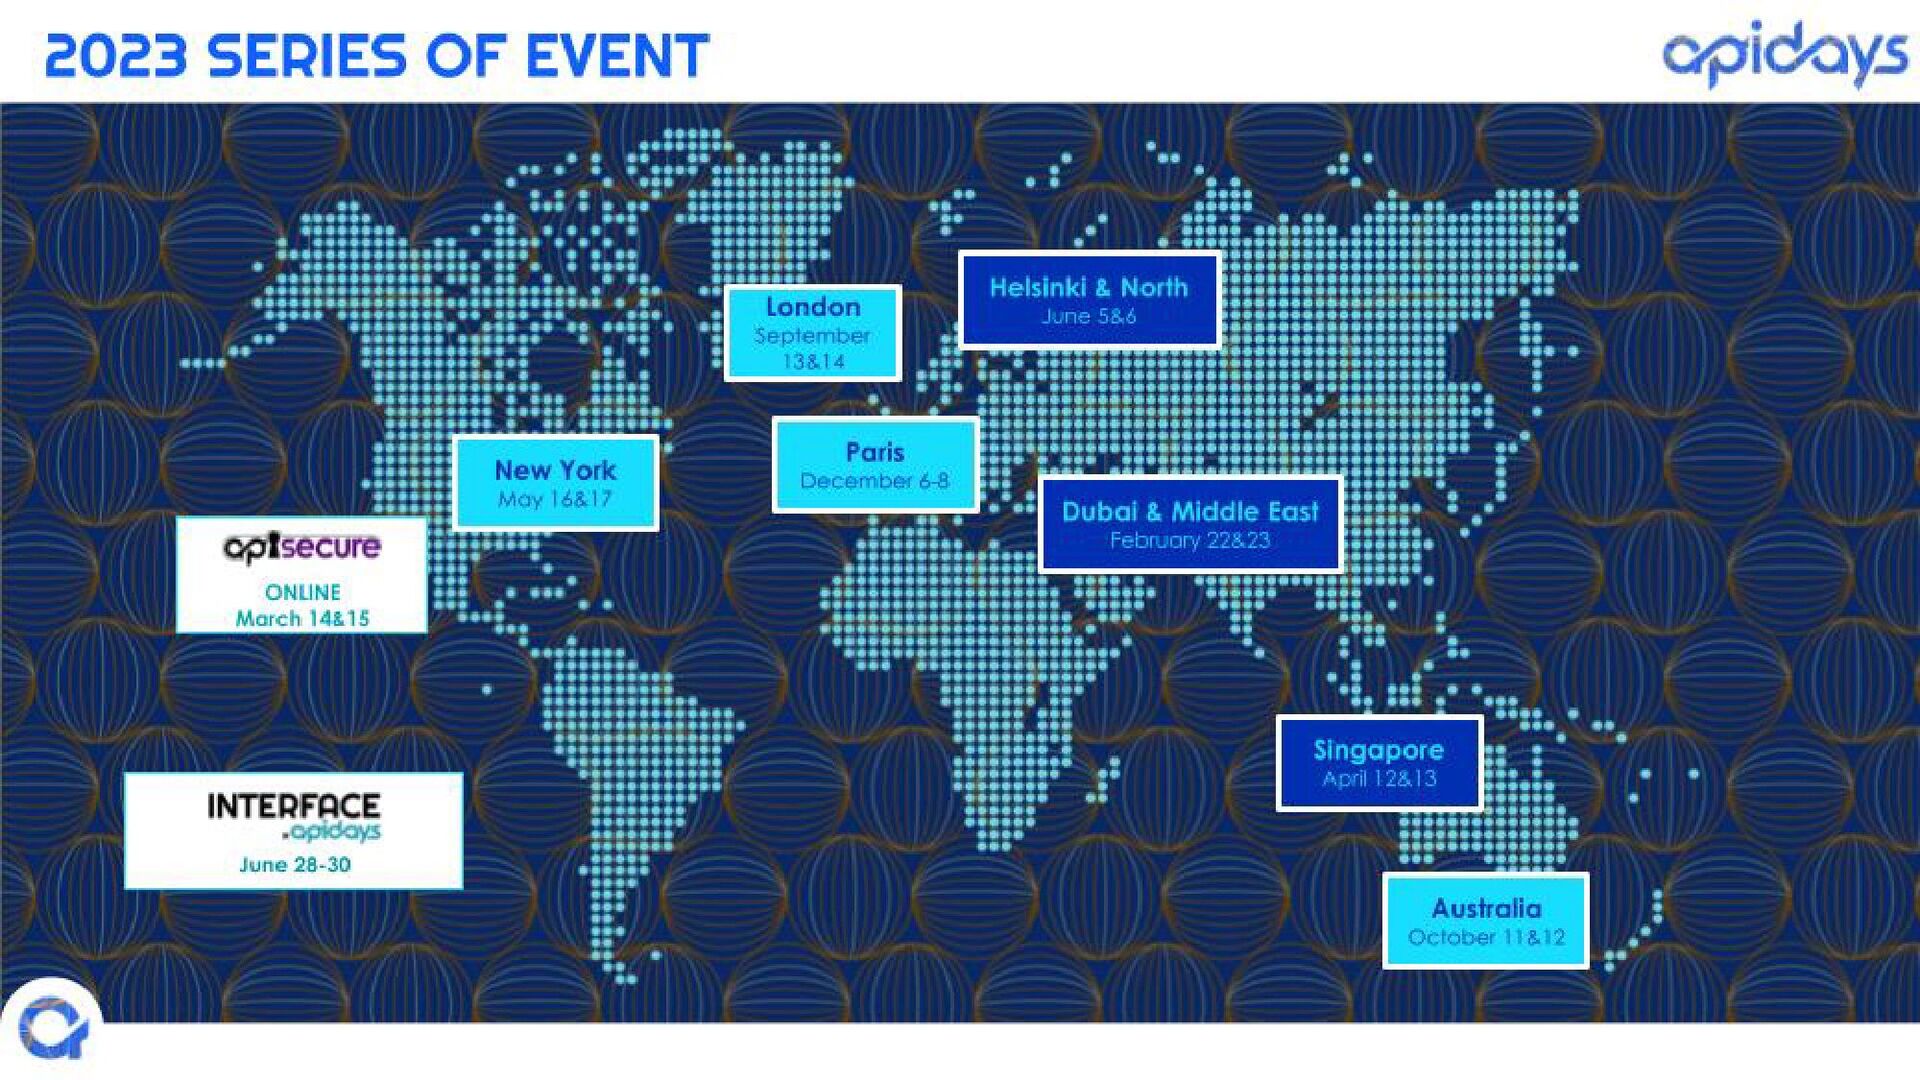
apidays Helsinki & North 2023
API Ecosystems - Connecting Physical and Digital
June 5 & 6, 2023
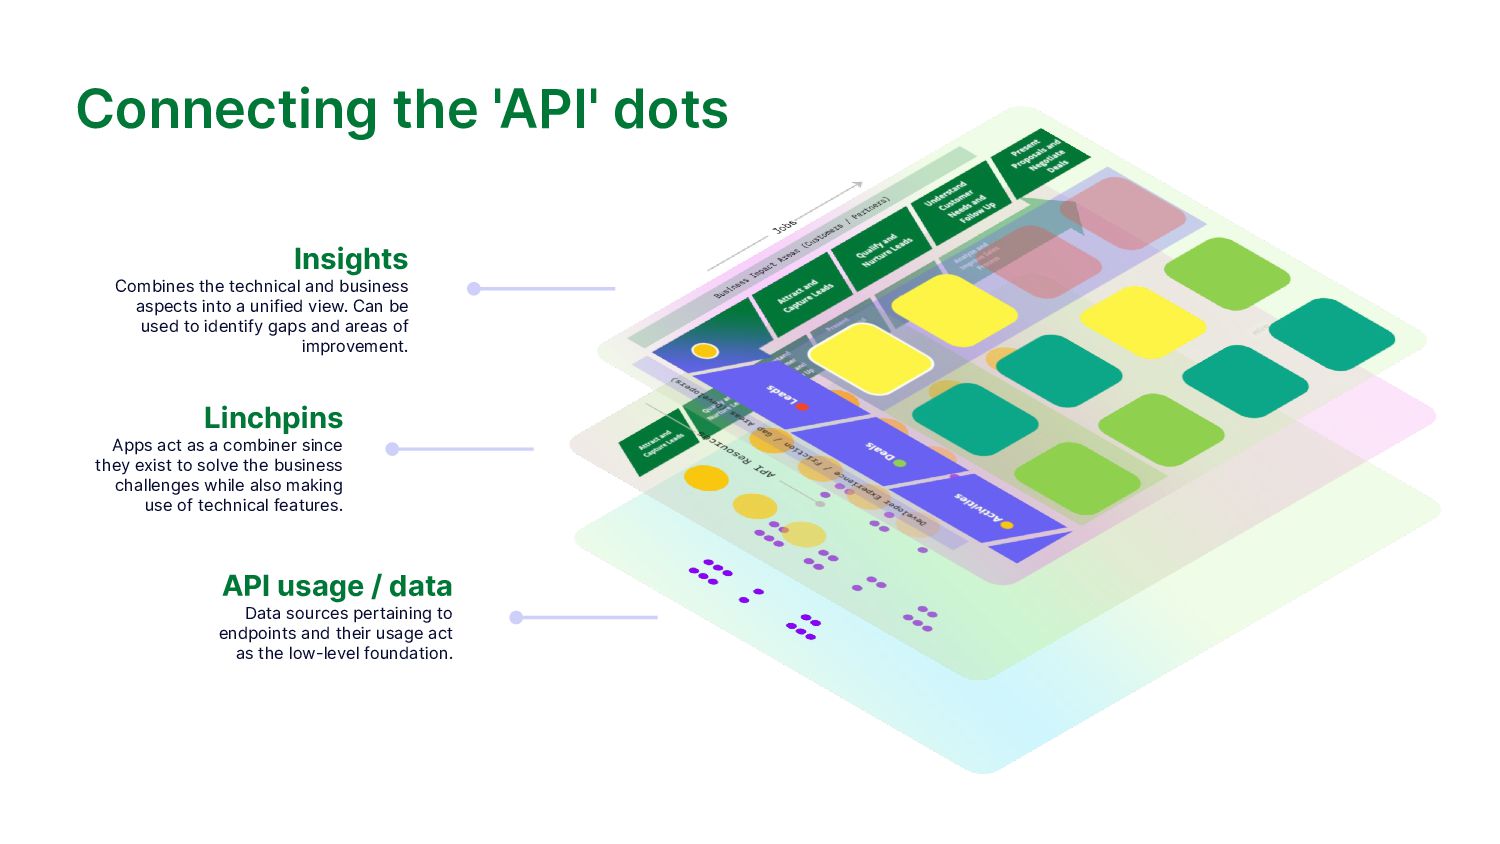
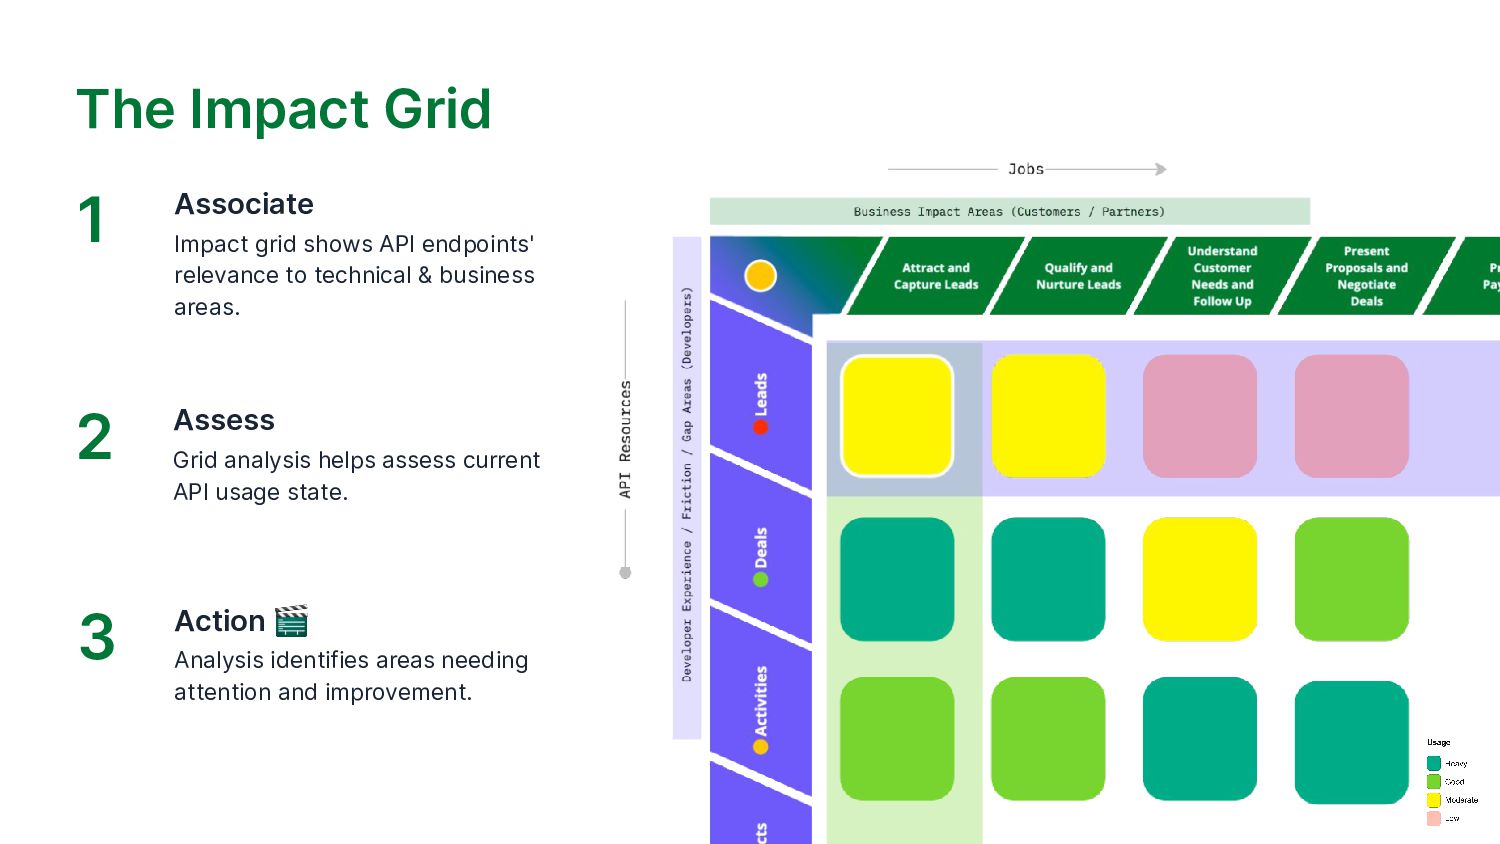
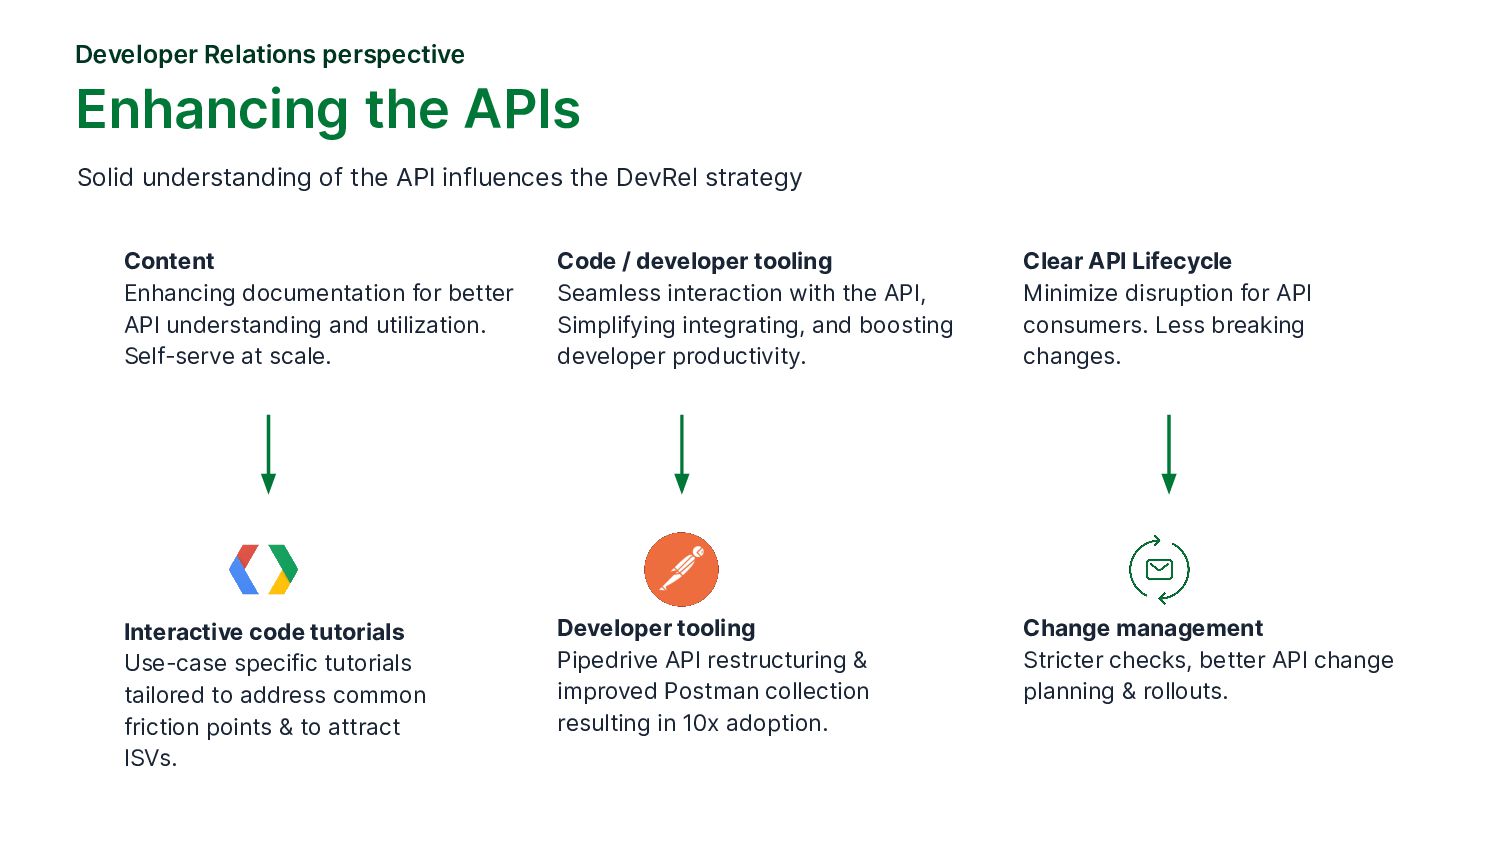
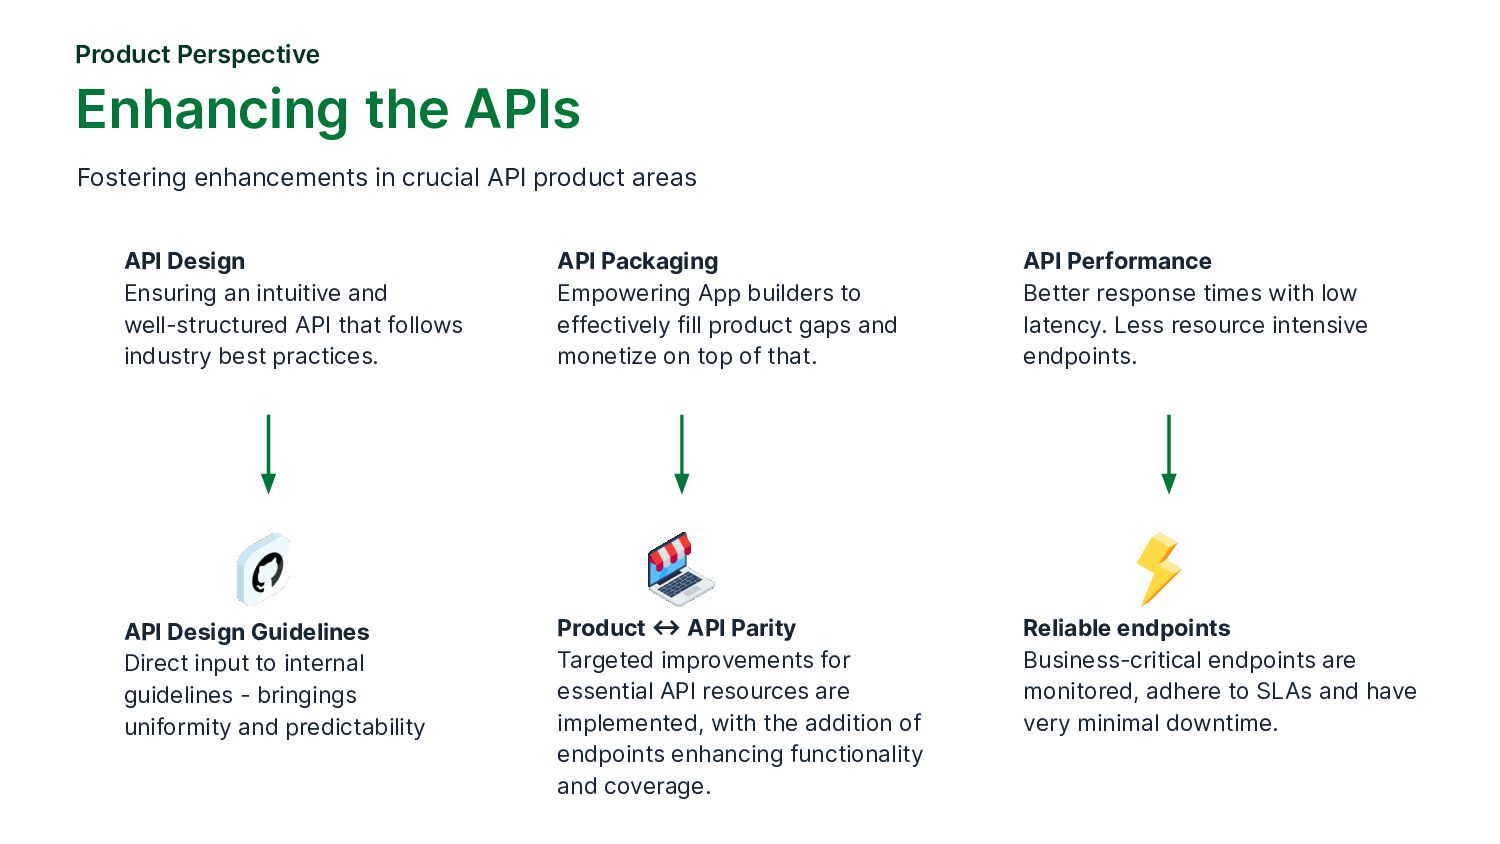
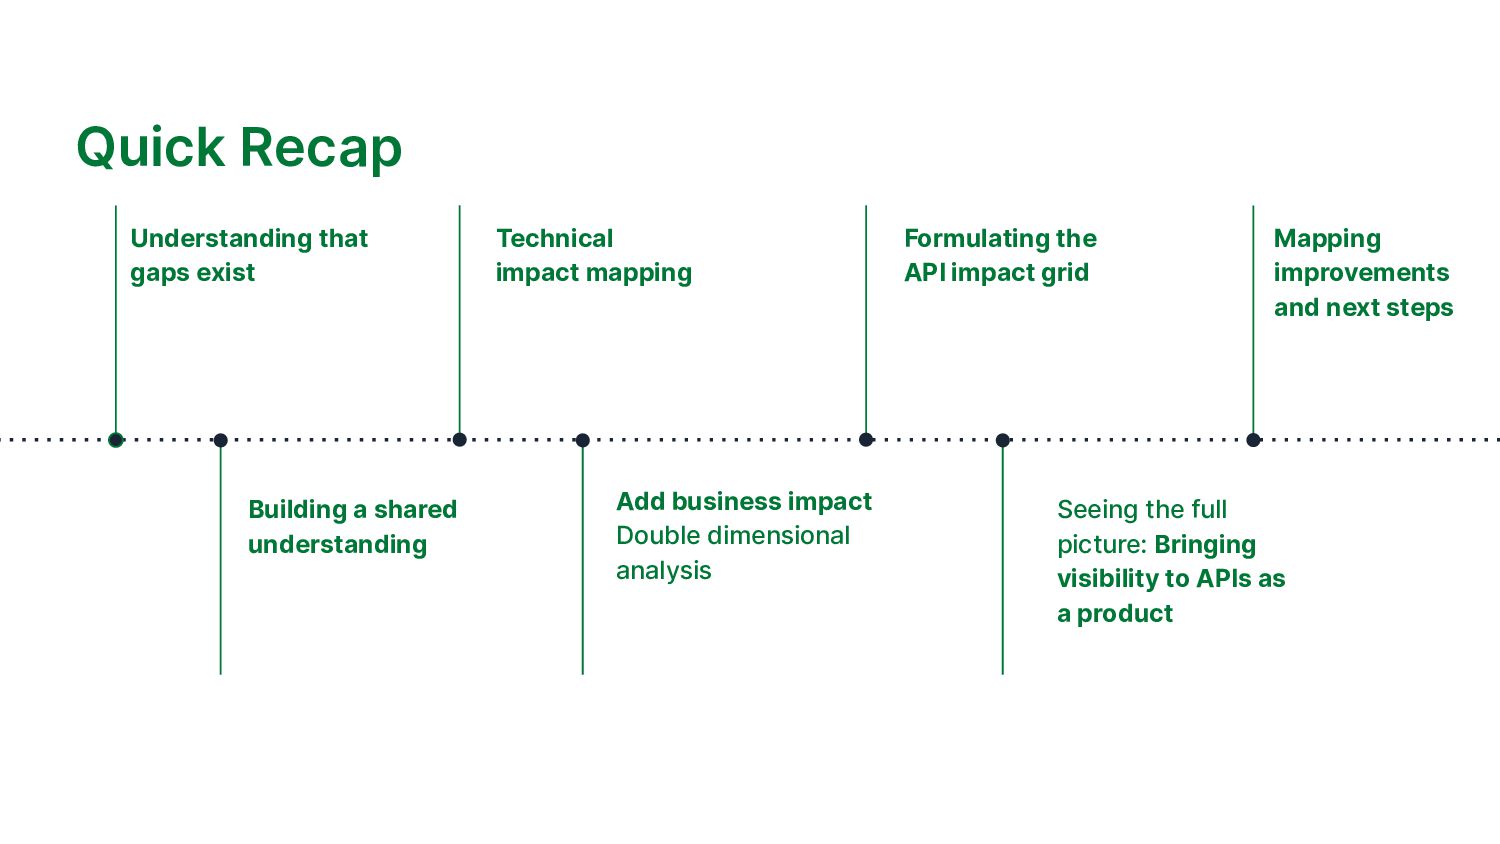
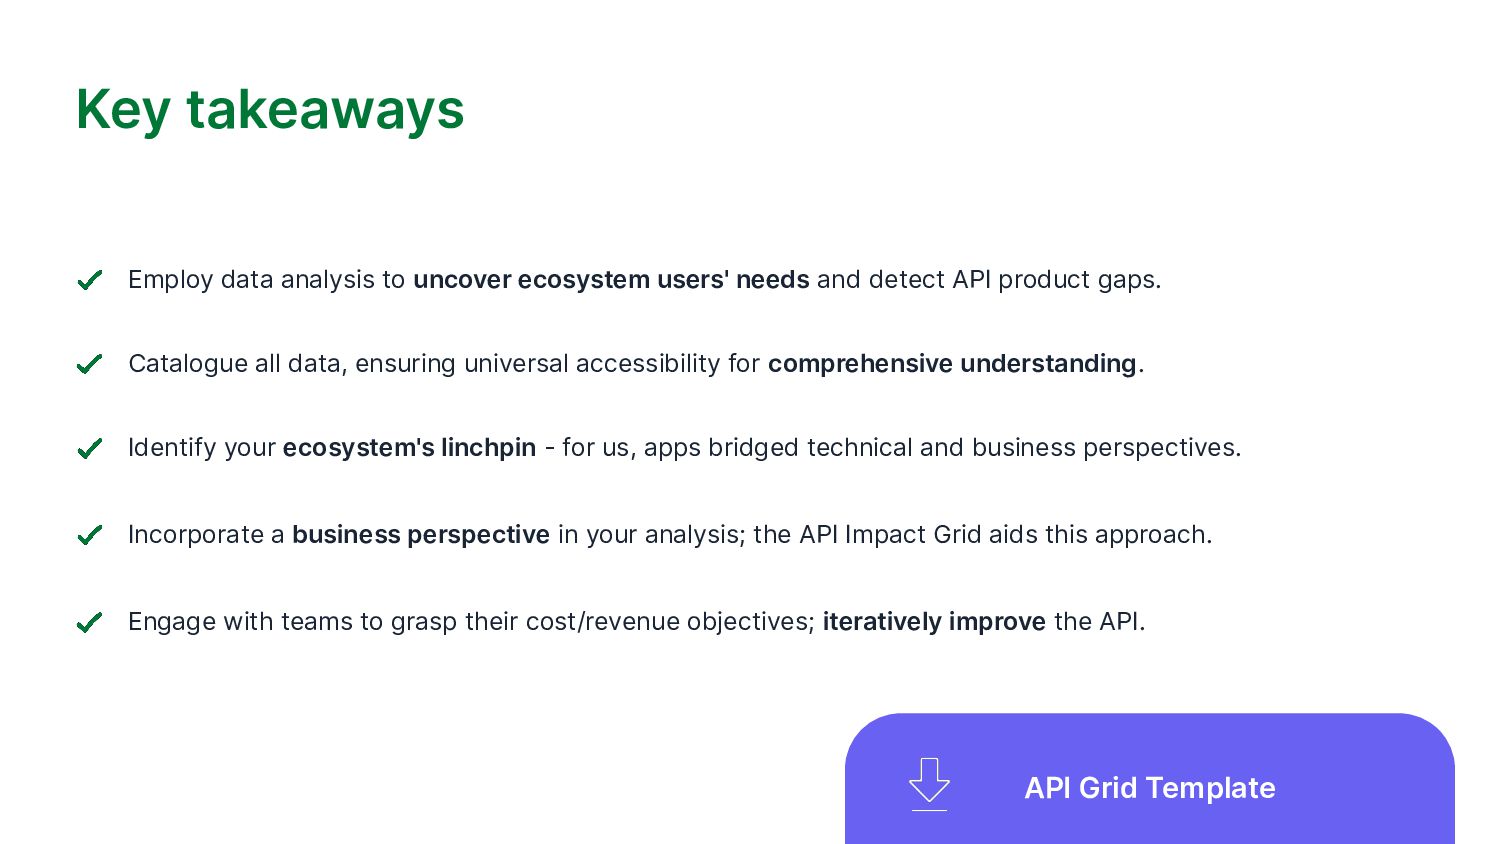
How can data-driven DevRel help identify gaps and enhance APIs?
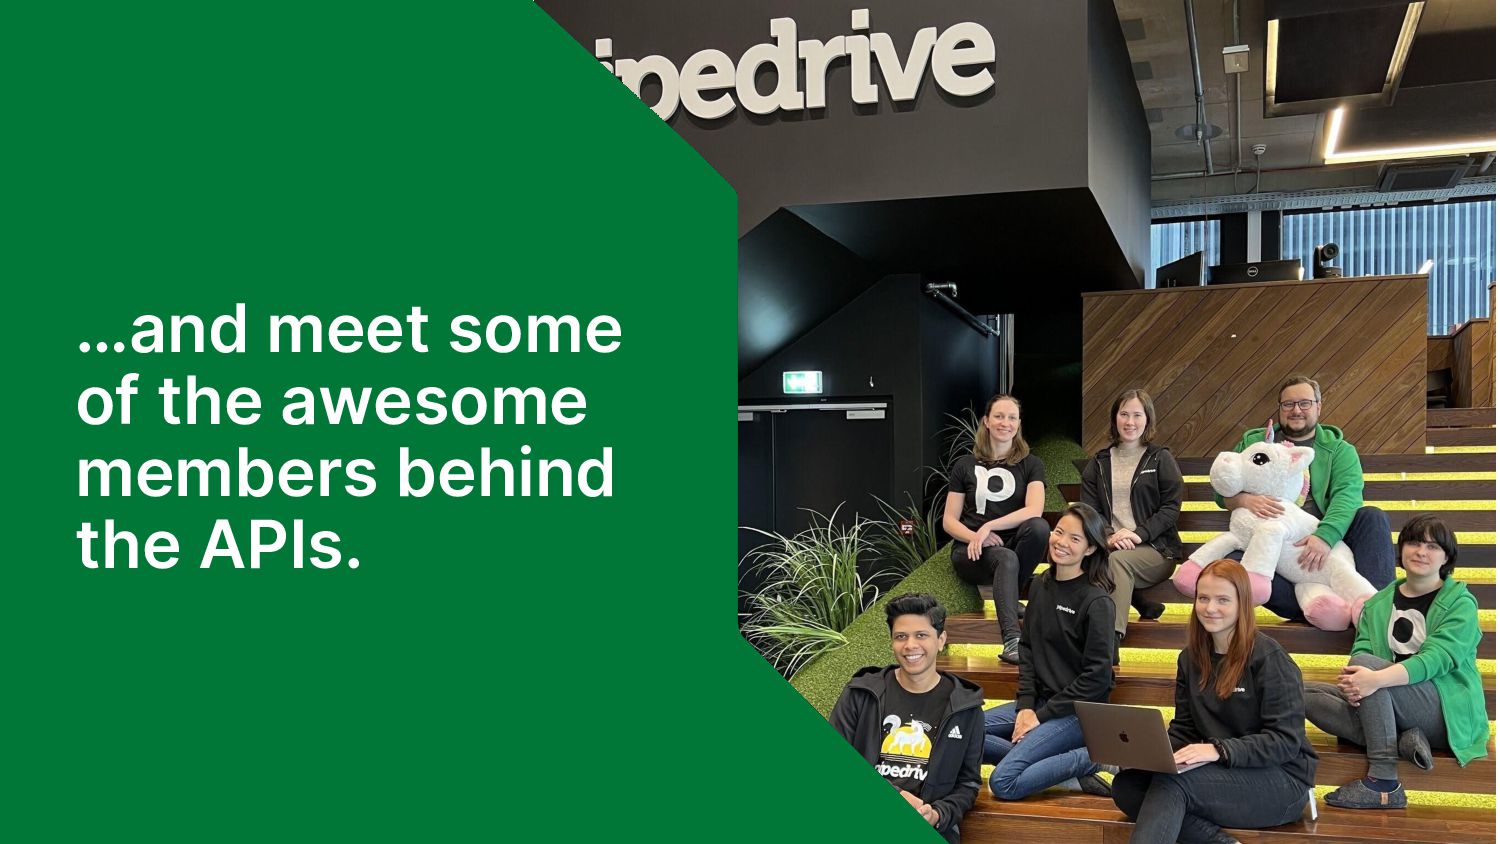
Hemchander Sundaraveloo, Sr. Developer Advocate at Pipedrive
------
Check out our conferences at https://www.apidays.global/
Do you want to sponsor or talk at one of our conferences?
https://apidays.typeform.com/to/ILJeAaV8
Learn more on APIscene, the global media made by the community for the community:
https://www.apiscene.io
Explore the API ecosystem with the API Landscape:
https://apilandscape.apiscene.io/