Streams • Scaling & Analytics • @armon Studied at Univ. of Washington. I’ve always had an interest in event streams, especially around the processing and extraction of analytics. I’ve been working at Kiip for the last two years as the primary scaling and analytics engineer. I’m @armon on various places in the internet.
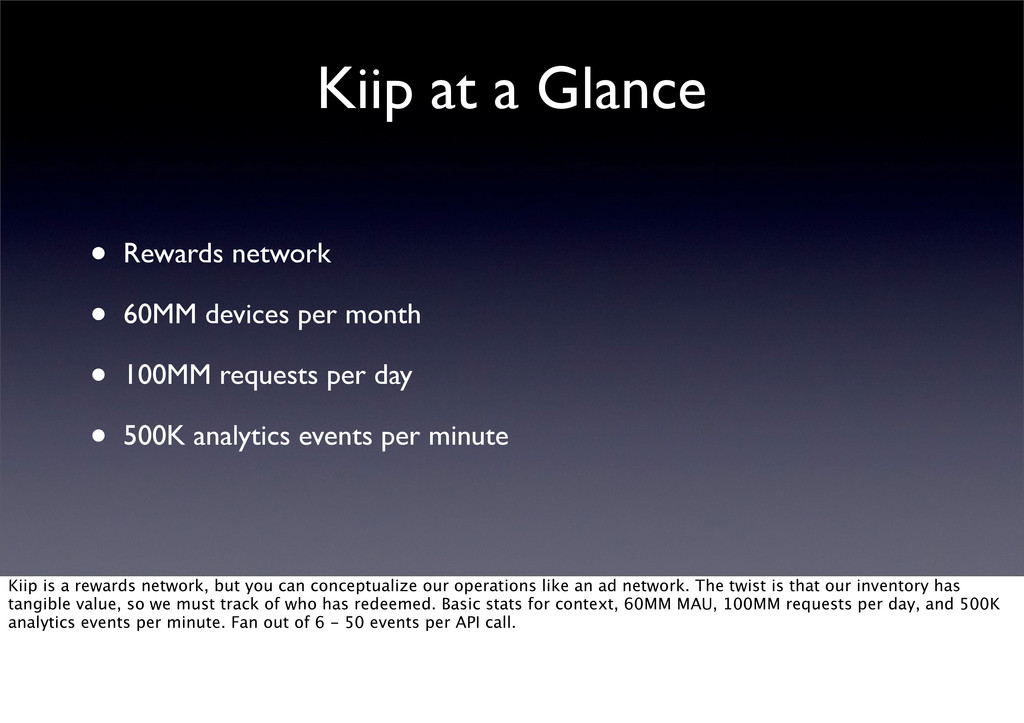
per month • 100MM requests per day • 500K analytics events per minute Kiip is a rewards network, but you can conceptualize our operations like an ad network. The twist is that our inventory has tangible value, so we must track of who has redeemed. Basic stats for context, 60MM MAU, 100MM requests per day, and 500K analytics events per minute. Fan out of 6 - 50 events per API call.
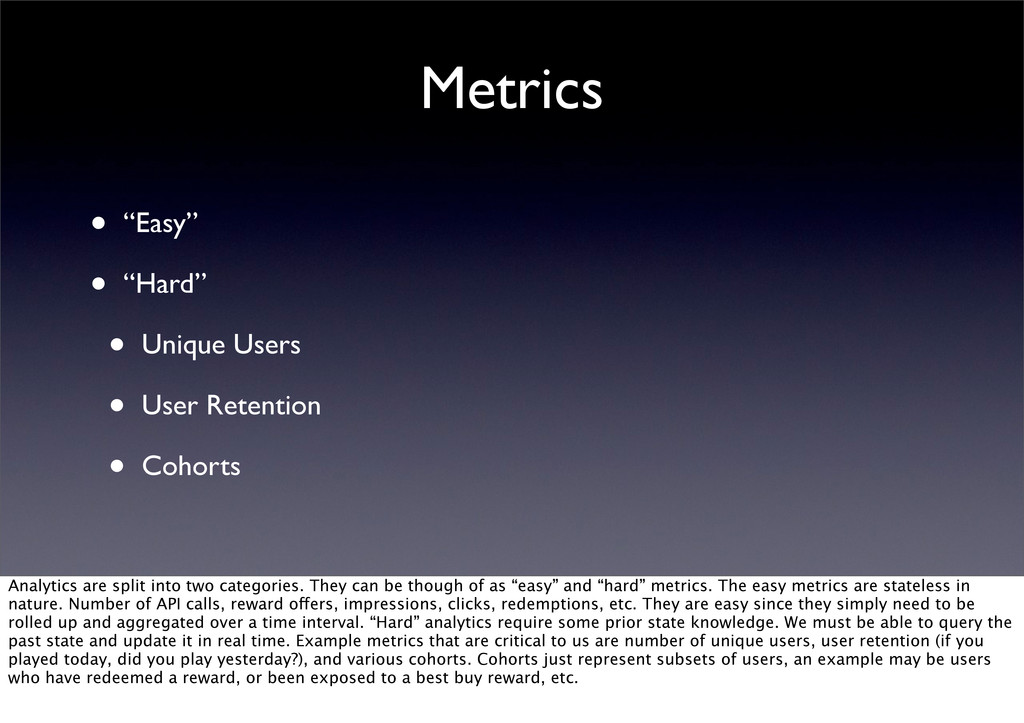
Retention • Cohorts Analytics are split into two categories. They can be though of as “easy” and “hard” metrics. The easy metrics are stateless in nature. Number of API calls, reward offers, impressions, clicks, redemptions, etc. They are easy since they simply need to be rolled up and aggregated over a time interval. “Hard” analytics require some prior state knowledge. We must be able to query the past state and update it in real time. Example metrics that are critical to us are number of unique users, user retention (if you played today, did you play yesterday?), and various cohorts. Cohorts just represent subsets of users, an example may be users who have redeemed a reward, or been exposed to a best buy reward, etc.
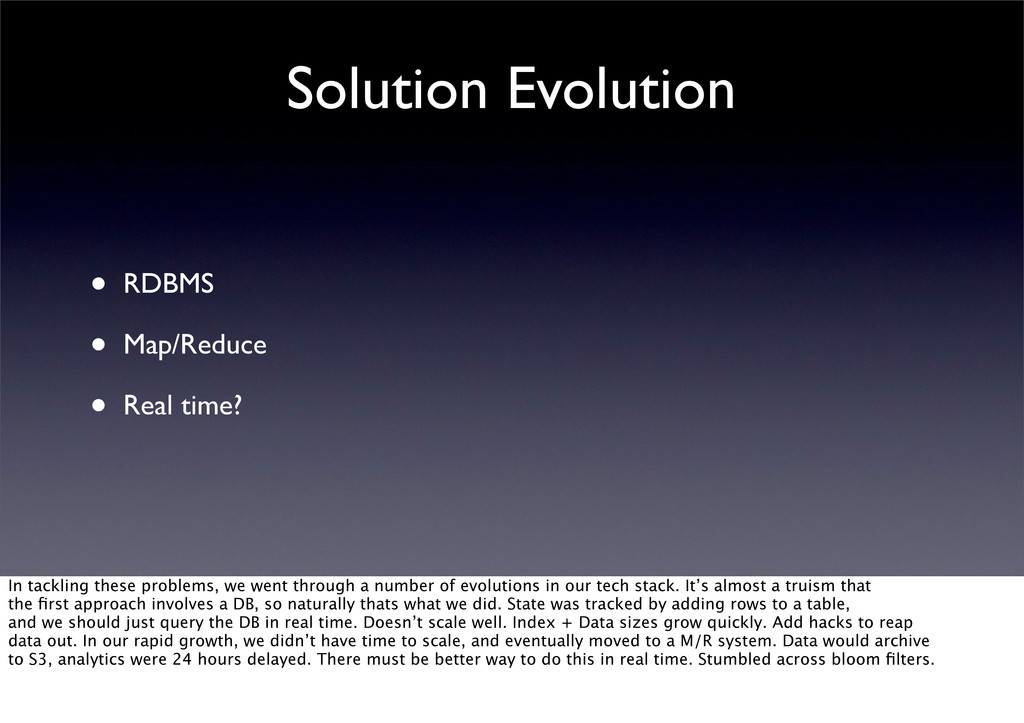
tackling these problems, we went through a number of evolutions in our tech stack. It’s almost a truism that the first approach involves a DB, so naturally thats what we did. State was tracked by adding rows to a table, and we should just query the DB in real time. Doesn’t scale well. Index + Data sizes grow quickly. Add hacks to reap data out. In our rapid growth, we didn’t have time to scale, and eventually moved to a M/R system. Data would archive to S3, analytics were 24 hours delayed. There must be better way to do this in real time. Stumbled across bloom filters.
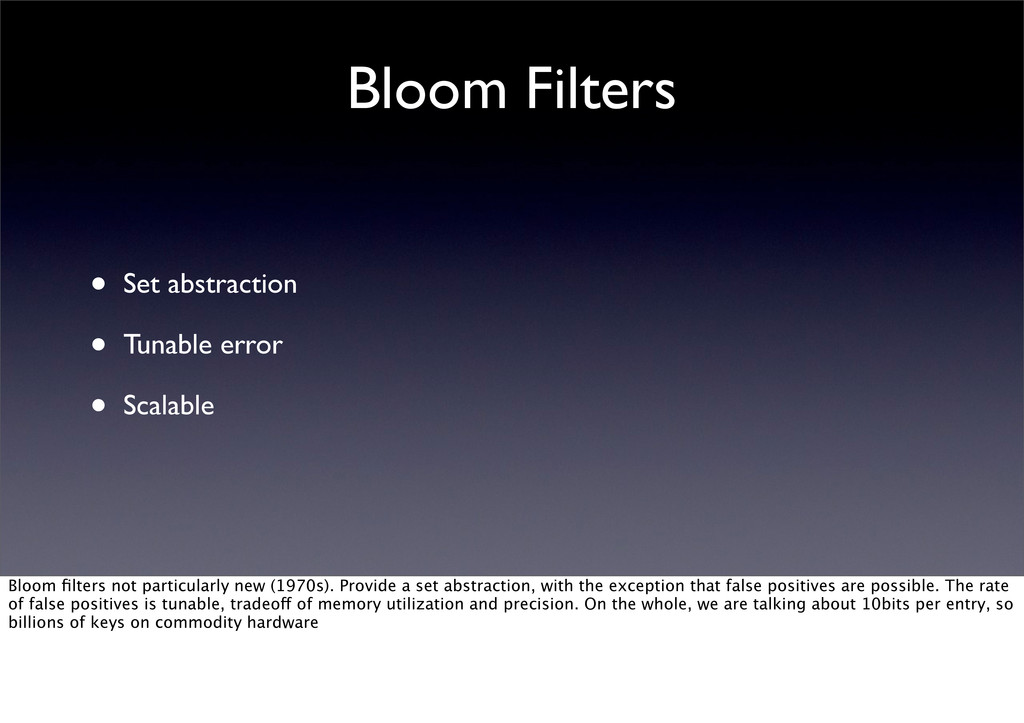
Bloom filters not particularly new (1970s). Provide a set abstraction, with the exception that false positives are possible. The rate of false positives is tunable, tradeoff of memory utilization and precision. On the whole, we are talking about 10bits per entry, so billions of keys on commodity hardware
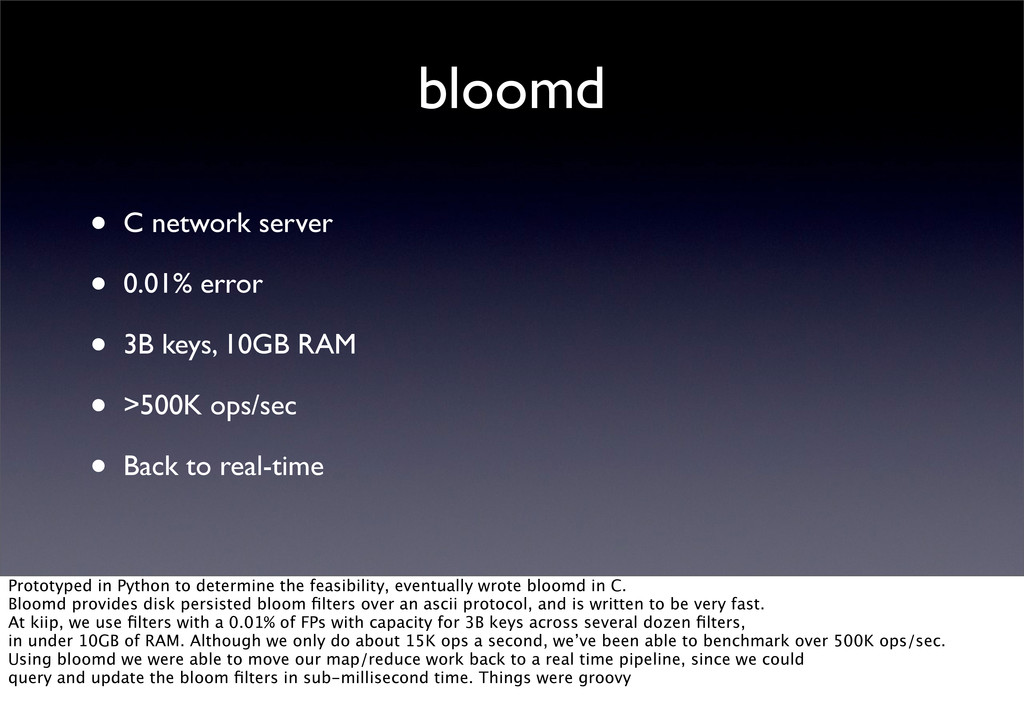
keys, 10GB RAM • >500K ops/sec • Back to real-time Prototyped in Python to determine the feasibility, eventually wrote bloomd in C. Bloomd provides disk persisted bloom filters over an ascii protocol, and is written to be very fast. At kiip, we use filters with a 0.01% of FPs with capacity for 3B keys across several dozen filters, in under 10GB of RAM. Although we only do about 15K ops a second, we’ve been able to benchmark over 500K ops/sec. Using bloomd we were able to move our map/reduce work back to a real time pipeline, since we could query and update the bloom filters in sub-millisecond time. Things were groovy
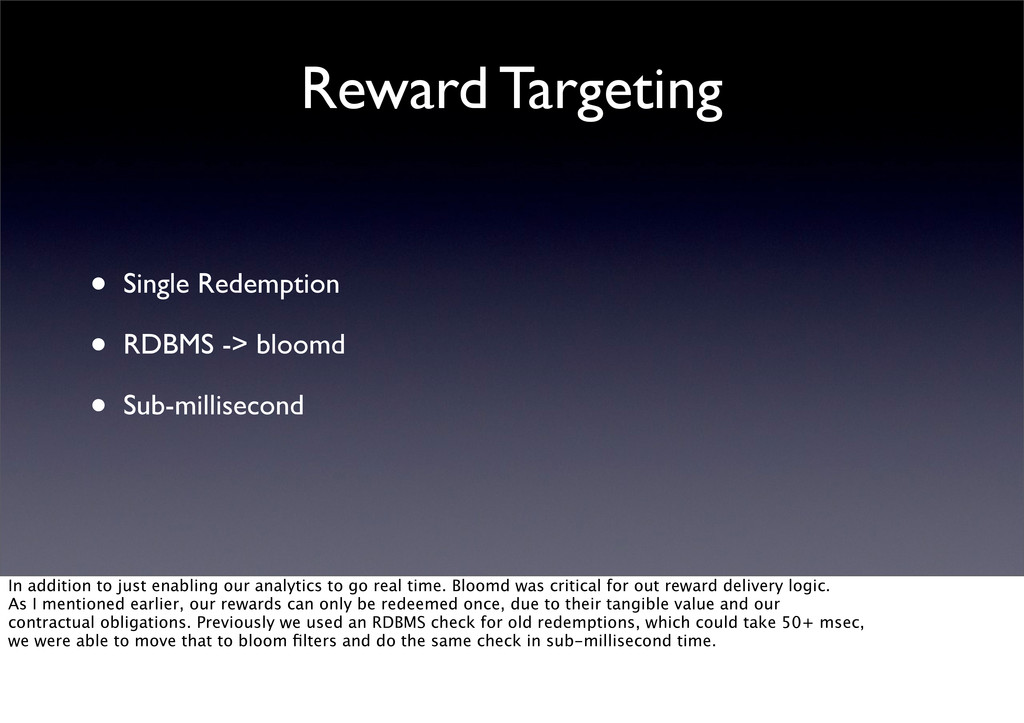
Sub-millisecond In addition to just enabling our analytics to go real time. Bloomd was critical for out reward delivery logic. As I mentioned earlier, our rewards can only be redeemed once, due to their tangible value and our contractual obligations. Previously we used an RDBMS check for old redemptions, which could take 50+ msec, we were able to move that to bloom filters and do the same check in sub-millisecond time.
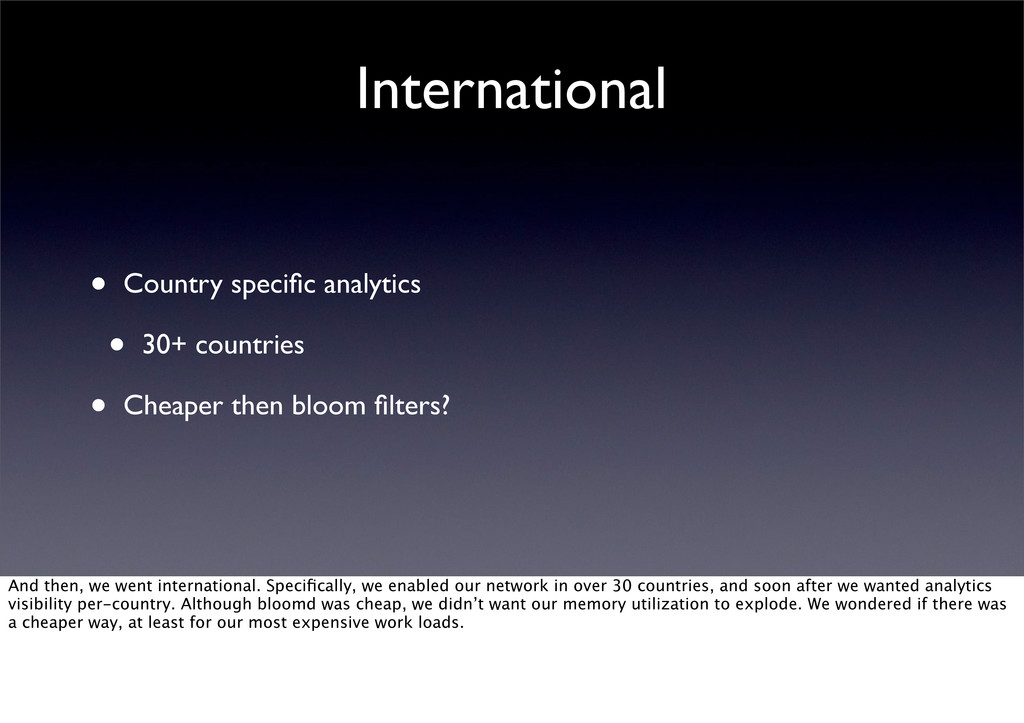
then bloom filters? And then, we went international. Specifically, we enabled our network in over 30 countries, and soon after we wanted analytics visibility per-country. Although bloomd was cheap, we didn’t want our memory utilization to explode. We wondered if there was a cheaper way, at least for our most expensive work loads.
• Fast This is when we found HyperLogLogs. HLL are used for cardinality estimation, which is just a count of unique entries, semantics we need for counting unique users. The absolutely incredible part is the memory utilization scales with the log log of the entries. 5 bits -> 2^32. The algorithm relies only on a hash function and a index update, fast to implement.
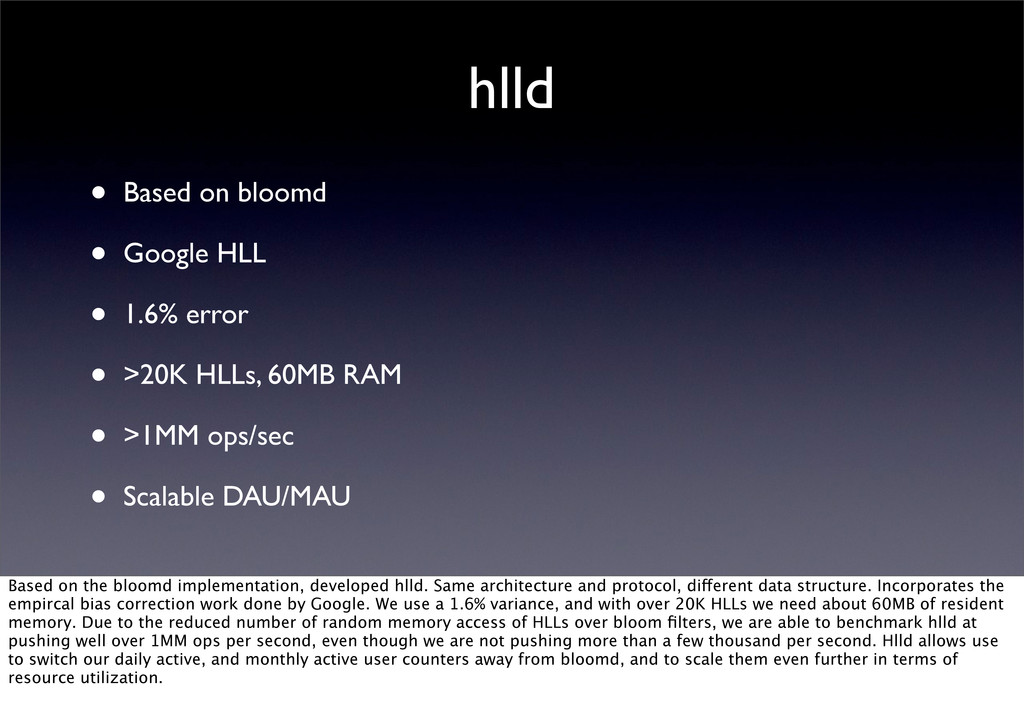
error • >20K HLLs, 60MB RAM • >1MM ops/sec • Scalable DAU/MAU Based on the bloomd implementation, developed hlld. Same architecture and protocol, different data structure. Incorporates the empircal bias correction work done by Google. We use a 1.6% variance, and with over 20K HLLs we need about 60MB of resident memory. Due to the reduced number of random memory access of HLLs over bloom filters, we are able to benchmark hlld at pushing well over 1MM ops per second, even though we are not pushing more than a few thousand per second. Hlld allows use to switch our daily active, and monthly active user counters away from bloomd, and to scale them even further in terms of resource utilization.
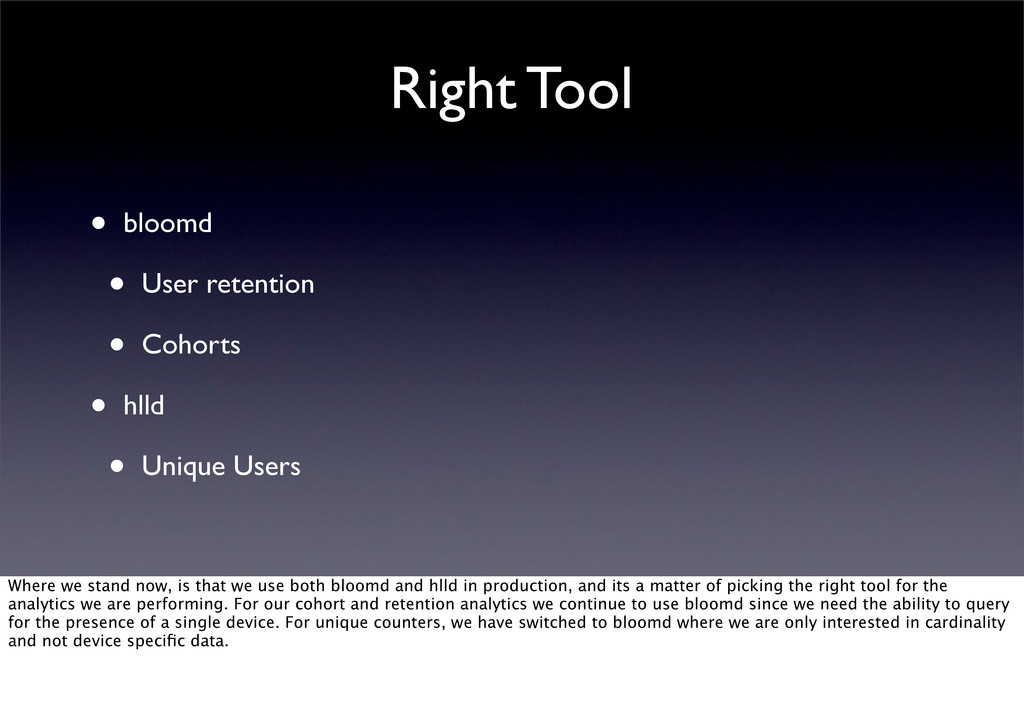
hlld • Unique Users Where we stand now, is that we use both bloomd and hlld in production, and its a matter of picking the right tool for the analytics we are performing. For our cohort and retention analytics we continue to use bloomd since we need the ability to query for the presence of a single device. For unique counters, we have switched to bloomd where we are only interested in cardinality and not device specific data.
• Open Source (github.com/armon) In conclusion, sketching data structures have been key to enabling us to perform our real time analytics at scale. The low memory utilization and high throughput allow low latency decision making and reward targeting to be built on top. Without systems like bloomd we simply be unable to deliver rewards as quickly. There are of course trade offs with everything. In this case we have traded exact results for an approximation, but we have also traded a system that would not scale for one that does. Since we control the error, we ensure that the bounds are appropriate for our application. For the use cases that require that exactness, we still rely on batch Map/Reduce systems. This split in out metrics allow us to get real time results to our dash boards, and then use precise but slower systems for things like billing. Lastly, wanted to mention that most of our systems at kiip are open sourced, but the various sketching systems are on my github at this URL. Thanks.