Monitoring is not optional but a necessity in a Microservices Architecture. This talk shows how to setup a local monitoring stack and replicate it on production. This is part of the 31st Large scale engineering meetup at Walmart Labs.
2. Pillars of Observability 3. What is Prometheus? 4. What is Grafana? 5. How to setup local monitoring stack? 6. Demo Pull Metrics 7. Demo Push Metrics 8. How is Monitoring done in Oracle? 9. Questions
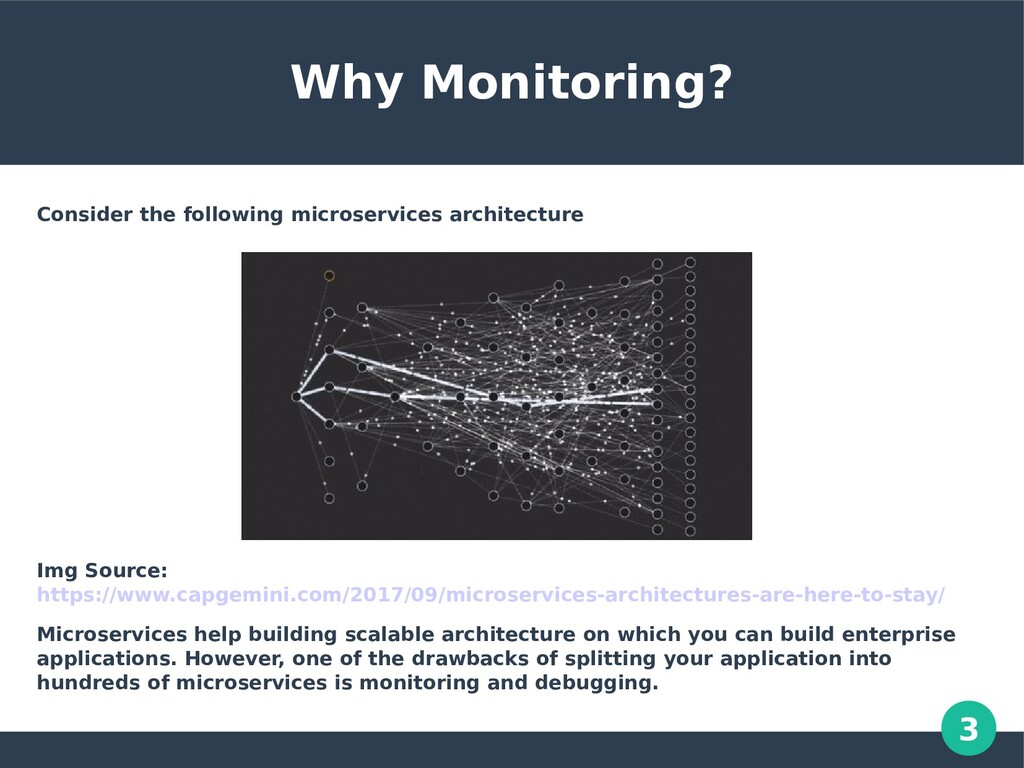
https://www.capgemini.com/2017/09/microservices-architectures-are-here-to-stay/ Microservices help building scalable architecture on which you can build enterprise applications. However, one of the drawbacks of splitting your application into hundreds of microservices is monitoring and debugging.
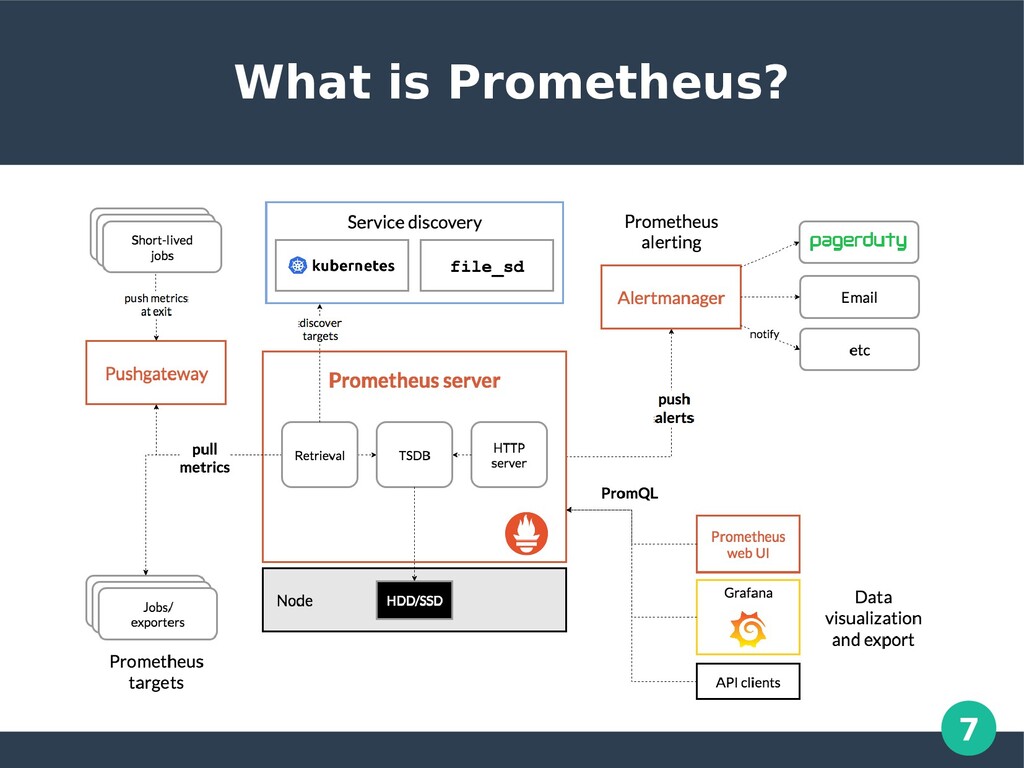
can use to monitor always running services as well as one-time jobs (batch jobs) Built on Go, by Soundcloud It persists these metrics in time-series db and you can query the metrics. Time series are defined by its metric names and values. Each metric can have multiple labels. Querying a particular combination of labels for a metric, produces a unique time-series. Metric is represented as- <metric name>{<label name>=<label value>, …}
Pull - Here it is responsibility of Prometheus to pull metrics. An agent will periodically scrap metrics off configured end-point micro-services. Push - Here it is responsibility of the end-points to push metrics to an agent of Prometheus called Pushgateway. This is usually used for one time batch jobs
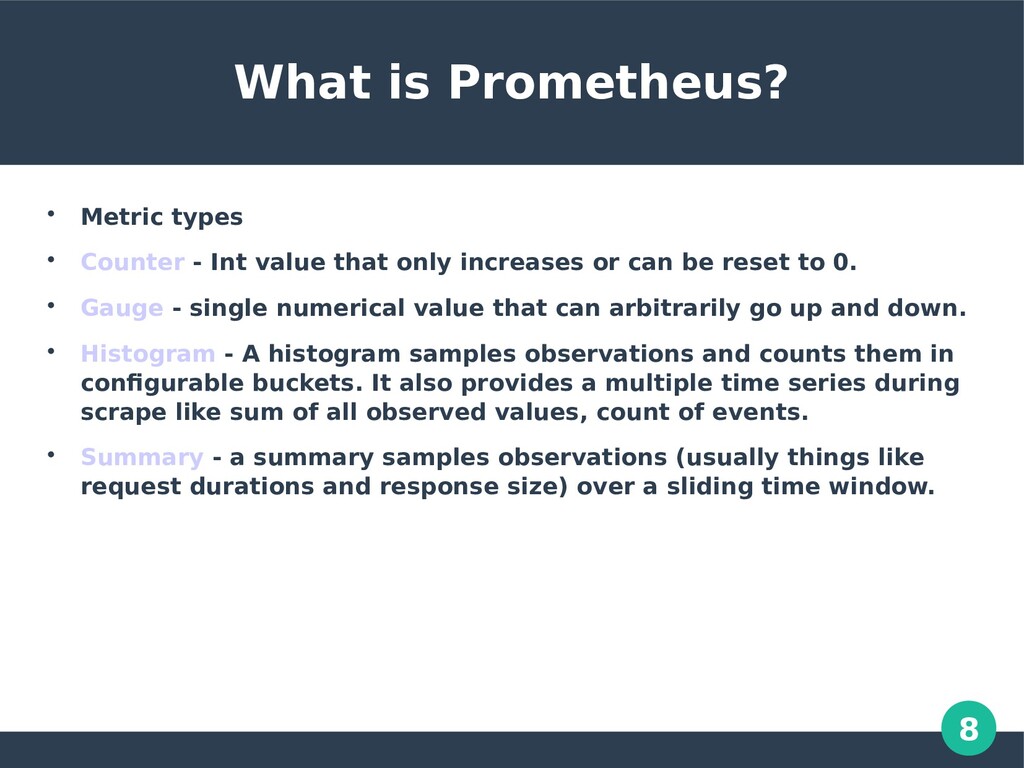
Int value that only increases or can be reset to 0. Gauge - single numerical value that can arbitrarily go up and down. Histogram - A histogram samples observations and counts them in configurable buckets. It also provides a multiple time series during scrape like sum of all observed values, count of events. Summary - a summary samples observations (usually things like request durations and response size) over a sliding time window.
observations, typically request durations or response sizes. They track the number of observations and the sum of the observed values, allowing you to calculate the average of the observed values
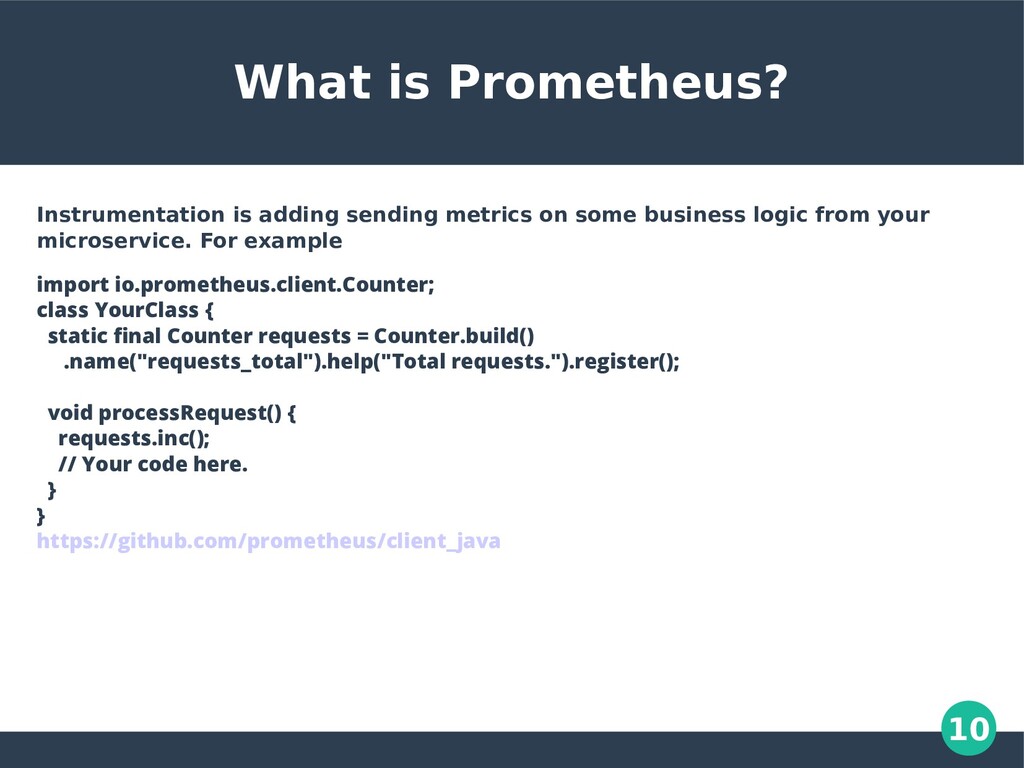
some business logic from your microservice. For example import io.prometheus.client.Counter; class YourClass { static final Counter requests = Counter.build() .name("requests_total").help("Total requests.").register(); void processRequest() { requests.inc(); // Your code here. } } https://github.com/prometheus/client_java
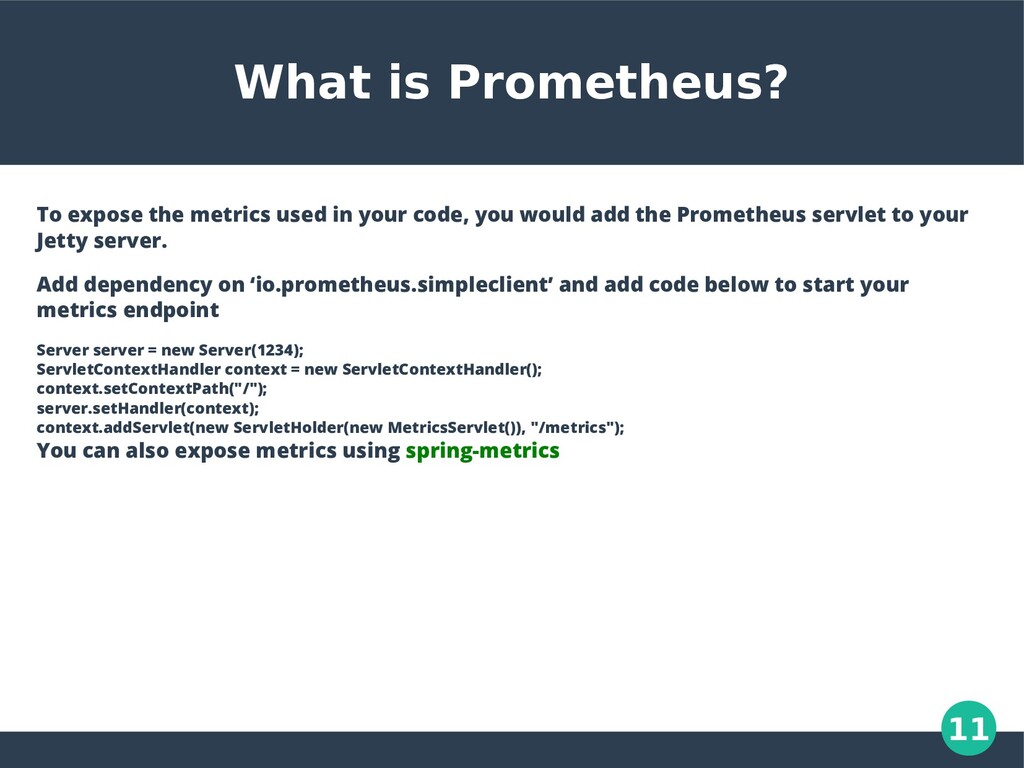
your code, you would add the Prometheus servlet to your Jetty server. Add dependency on ‘io.prometheus.simpleclient’ and add code below to start your metrics endpoint Server server = new Server(1234); ServletContextHandler context = new ServletContextHandler(); context.setContextPath("/"); server.setHandler(context); context.addServlet(new ServletHolder(new MetricsServlet()), "/metrics"); You can also expose metrics using spring-metrics
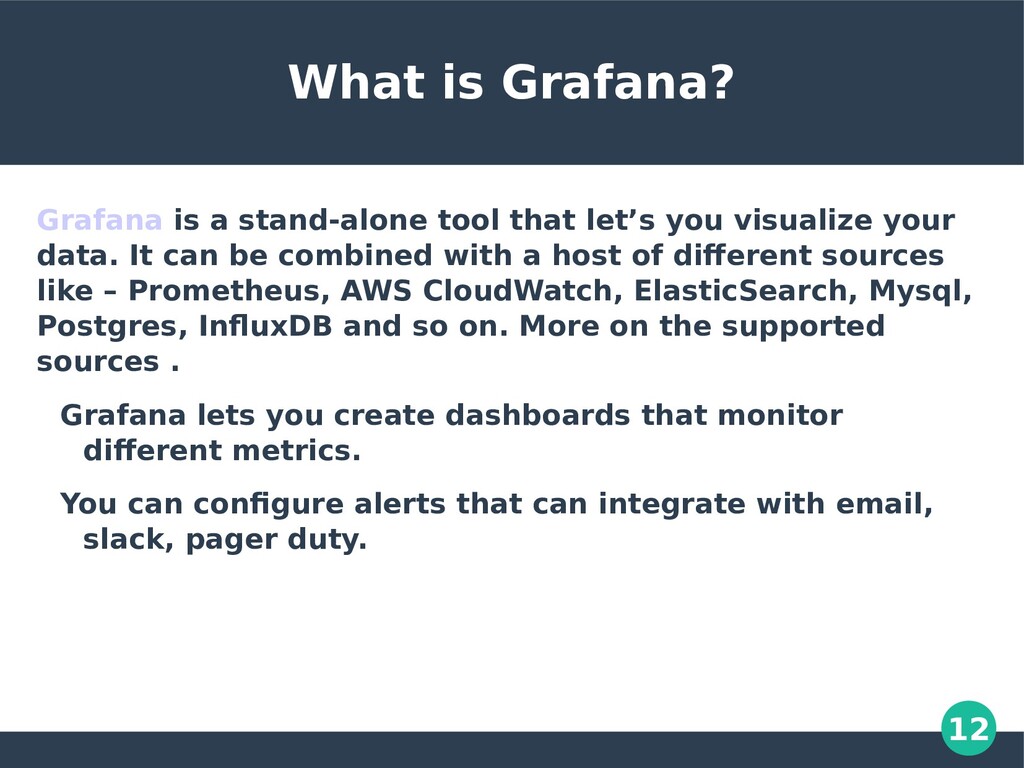
let’s you visualize your data. It can be combined with a host of different sources like – Prometheus, AWS CloudWatch, ElasticSearch, Mysql, Postgres, InfluxDB and so on. More on the supported sources . Grafana lets you create dashboards that monitor different metrics. You can configure alerts that can integrate with email, slack, pager duty.
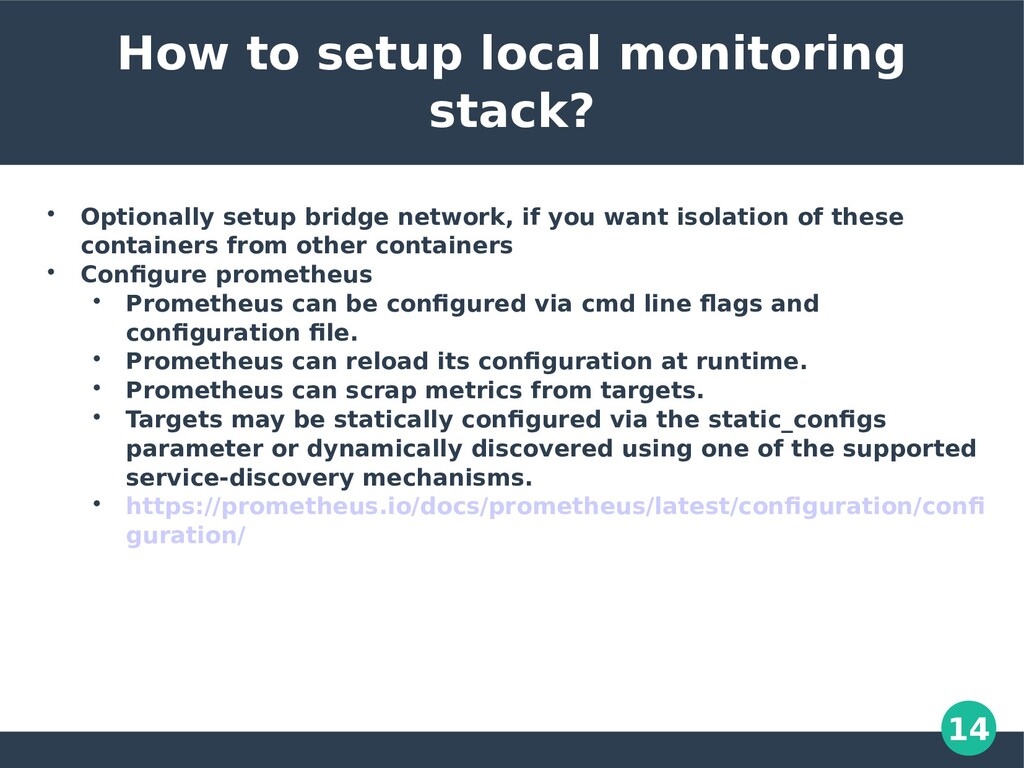
bridge network, if you want isolation of these containers from other containers Configure prometheus Prometheus can be configured via cmd line flags and configuration file. Prometheus can reload its configuration at runtime. Prometheus can scrap metrics from targets. Targets may be statically configured via the static_configs parameter or dynamically discovered using one of the supported service-discovery mechanisms. https://prometheus.io/docs/prometheus/latest/configuration/confi guration/
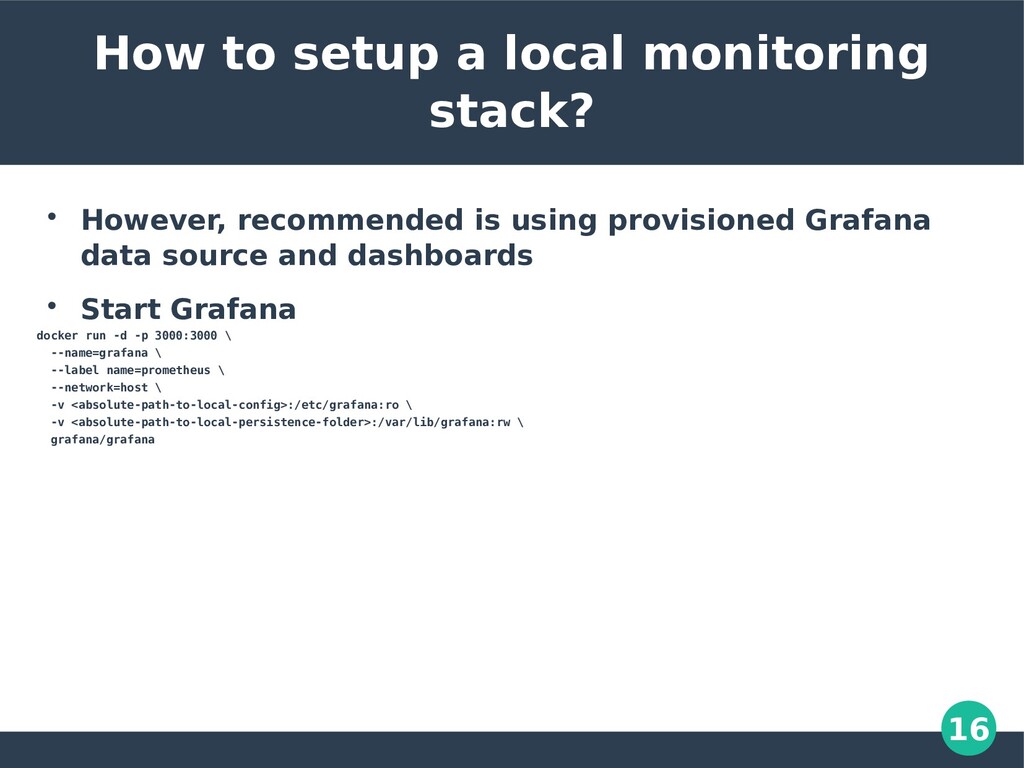
can start Grafana on docker by using simply running- docker run -d -p 3000:3000 grafana/grafana -v grafana-storage:/var/lib/grafana grafana/grafana You will need to configure your data source (Prometheus) and your graphs first time. This will then persist on the docker volume. Disadvantages of this is, to deploy this on production you will need to clone this docker volume
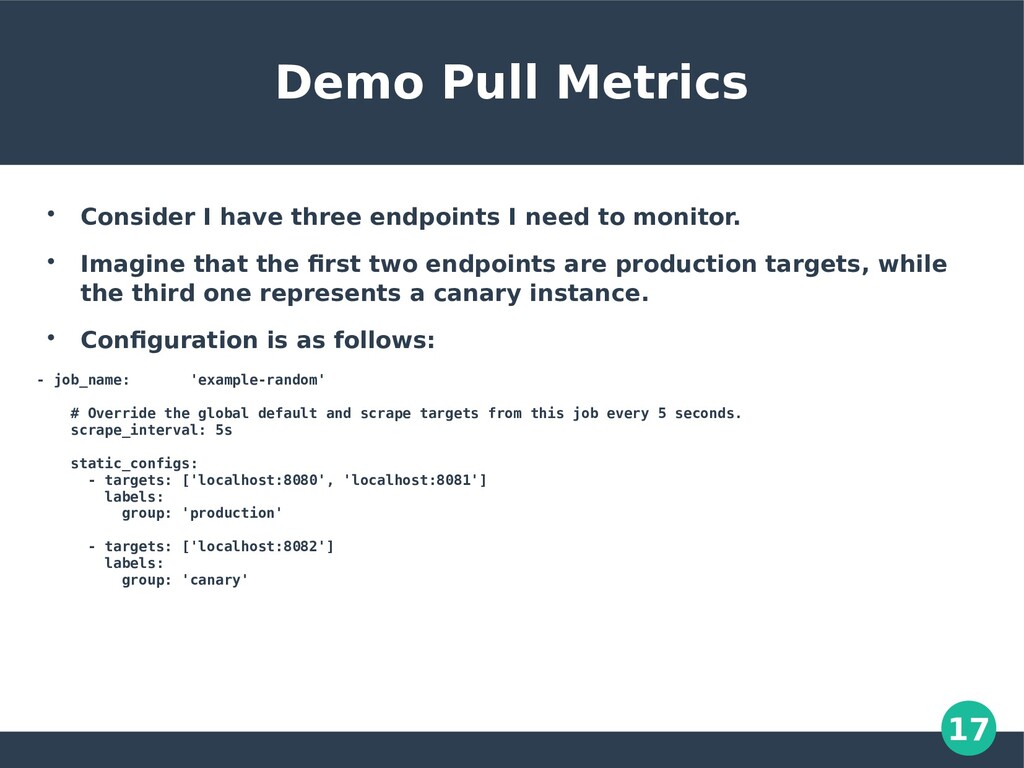
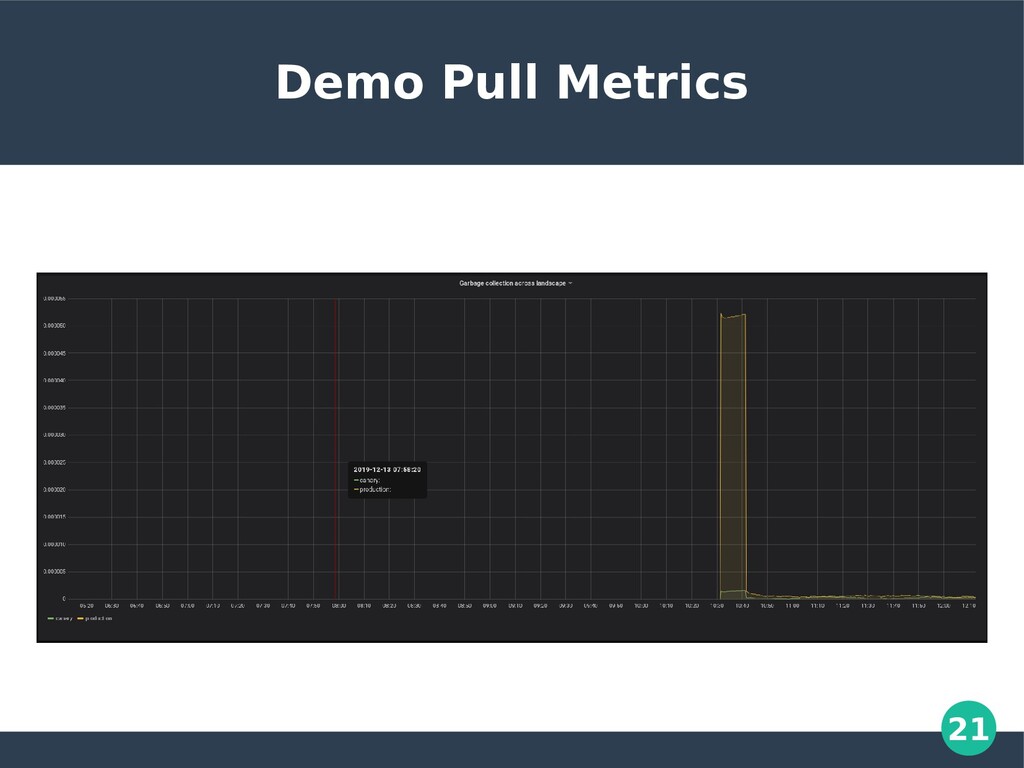
I need to monitor. Imagine that the first two endpoints are production targets, while the third one represents a canary instance. Configuration is as follows: - job_name: 'example-random' # Override the global default and scrape targets from this job every 5 seconds. scrape_interval: 5s static_configs: - targets: ['localhost:8080', 'localhost:8081'] labels: group: 'production' - targets: ['localhost:8082'] labels: group: 'canary'
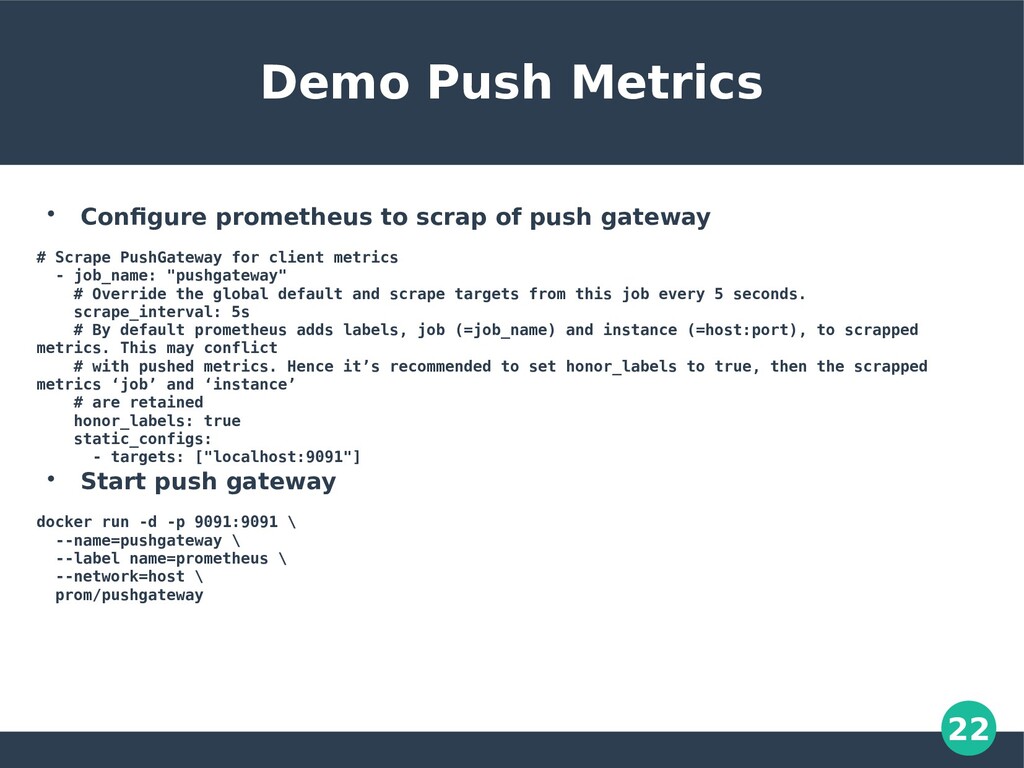
push gateway # Scrape PushGateway for client metrics - job_name: "pushgateway" # Override the global default and scrape targets from this job every 5 seconds. scrape_interval: 5s # By default prometheus adds labels, job (=job_name) and instance (=host:port), to scrapped metrics. This may conflict # with pushed metrics. Hence it’s recommended to set honor_labels to true, then the scrapped metrics ‘job’ and ‘instance’ # are retained honor_labels: true static_configs: - targets: ["localhost:9091"] Start push gateway docker run -d -p 9091:9091 \ --name=pushgateway \ --label name=prometheus \ --network=host \ prom/pushgateway
Oracle cloud we use a variety of tools: Metrics, we used Prometheus, but now we are moving to T2, that is an custom built time series monitoring tool similar to Prometheus. Logging, lumberjack Alerting, Pagerduty