Upgrade to Pro — share decks privately, control downloads, hide ads and more …

Umbrella Inc. Forecast - 2019

asantana
September 09, 2020

Umbrella Inc. Forecast - 2019

asantana

September 09, 2020
Tweet

More Decks by asantana

Other Decks in Business

Transcript

  1. 2018 Employee Financial Overview ⇢ Base salary for all employees

    is $72M ⇢ Commission total of $97M based on 20k Closed Accounts Defining Attributes $700M $530k Average Net Revenue Per Employee $169M Total Compensation Umbrella Inc. ⇢ Total Gross Revenue $530M ⇢ Total Net Revenue 1,000 0 200 400 600 800 1,000 1,200 Number of Employees for FY 2018
  2. ⇢ Surpassed Target Gross Revenue by over 110% ⇢ Overall

    employee morale consistent with growth ⇢ Every employee exceeded their quota by at least 60% $699,144,198 $621,050,000 $500,000,000 $550,000,000 $600,000,000 $650,000,000 $700,000,000 $750,000,000 Gross Revenue Target Gross Revenue Total Gross Revenue Compared to Target Gross Revenue Umbrella Inc. Exceeded 2018 Revenue Expectations
  3. Strategy Realization For 2019 Umbrella Inc. ⇢ Optimization of our

    workforce and operational systems ⇢ Synchronization of the efficacy of our workforce and the goal of $1B in revenue ⇢ Current employee and customer satisfaction To Achieve: ⇢ Plan for increases or reductions in the workforce ⇢ Adjust quotas, commission structures or growth rate ⇢ Maintain the best possible work environment and provide great products to our customers We Have To:
  4. Strategy One – Increasing Book of Business Umbrella Inc. $908,887,457

    $699,144,198 $400,000,000 $500,000,000 $600,000,000 $700,000,000 $800,000,000 $900,000,000 $1,000,000,000 Assumed Gross Revenue Gross Revenue Assumed Gross Revenue Compared to 2018 Gross Revenue ⇢ Gross Revenue reaches $900M ⇢ A step in the right direction
  5. Strategy One – By The Numbers Umbrella Inc. Growth Rate

    of 30% ⇢ Client base increase New Accounts Closed – 26k ⇢ Better employee incentives ⇢ Increase from $530M to $710M Total Net Revenue ⇢ Increase from $530k to $710k Average Net Revenue Per Employee ⇢ Increase from $169M to $198M Total Employee Compensation ⇢ Increase in customer satisfaction Applied Variable
  6. Strategy Two – Increasing Headcount Umbrella Inc. $838,973,038 $699,144,198 $400,000,000

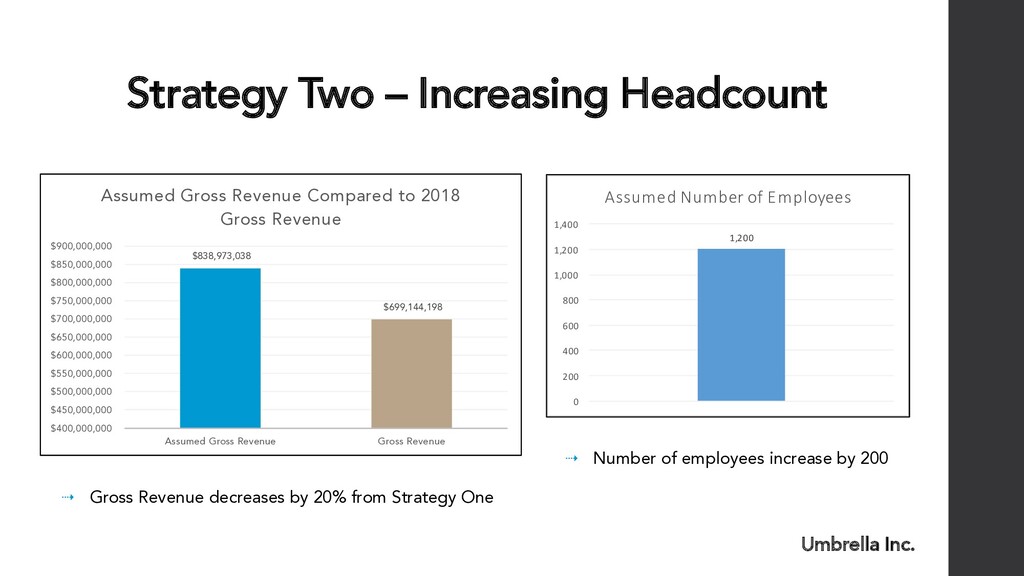
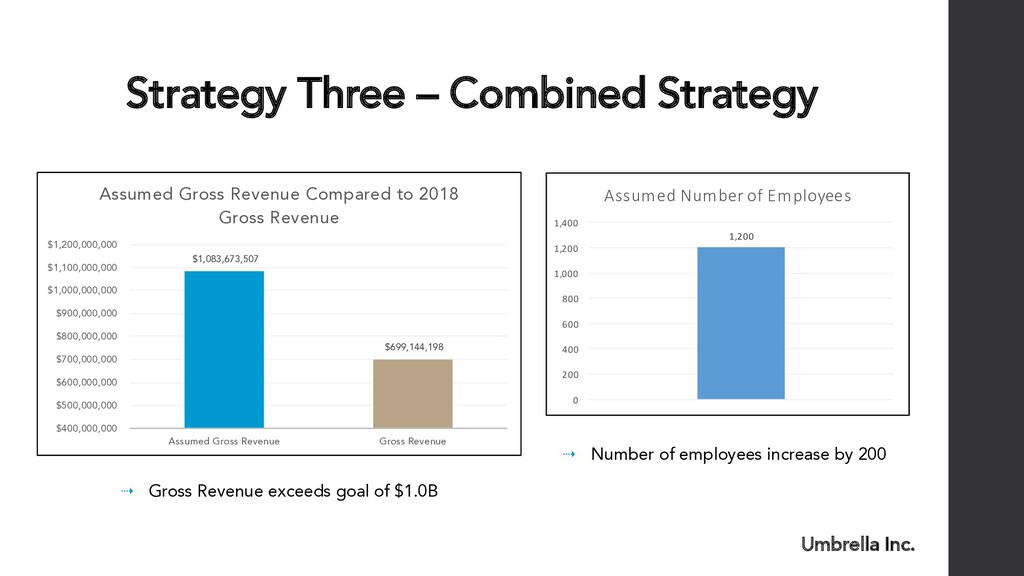
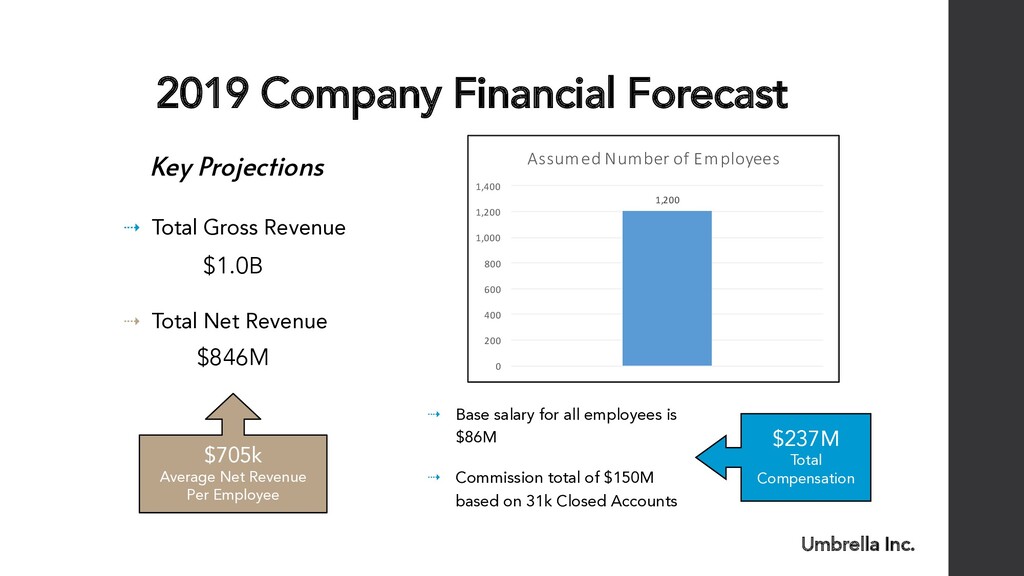
    $450,000,000 $500,000,000 $550,000,000 $600,000,000 $650,000,000 $700,000,000 $750,000,000 $800,000,000 $850,000,000 $900,000,000 Assumed Gross Revenue Gross Revenue Assumed Gross Revenue Compared to 2018 Gross Revenue 1,200 0 200 400 600 800 1,000 1,200 1,400 Assumed Number of Employees ⇢ Gross Revenue decreases by 20% from Strategy One ⇢ Number of employees increase by 200
  7. Strategy Two – By The Numbers Umbrella Inc. ⇢ Same

    as 2018 – $530k Average Net Revenue Per Employee Total Employee Compensation ⇢ Increase from $169M to $203M ⇢ Client base increase New Accounts Closed – 24k ⇢ Increase from $530M to $636M; less than Strategy One Total Net Revenue ⇢ Increase in customer satisfaction ⇢ Fewer closed accounts; less than Strategy One Growth Rate of 30% Applied Variable
  8. Commission Structure Comparison Umbrella Inc. ⇢ Commission ⇢ Base Salary

    2018 Strategy One Strategy Two ⇢ Commission Per Account $72M $72M $86M $97M $5k $127M $5k $117M $5k
  9. Strategy Three – Combined Strategy Umbrella Inc. $1,083,673,507 $699,144,198 $400,000,000

    $500,000,000 $600,000,000 $700,000,000 $800,000,000 $900,000,000 $1,000,000,000 $1,100,000,000 $1,200,000,000 Assumed Gross Revenue Gross Revenue Assumed Gross Revenue Compared to 2018 Gross Revenue 1,200 0 200 400 600 800 1,000 1,200 1,400 Assumed Number of Employees ⇢ Gross Revenue exceeds goal of $1.0B ⇢ Number of employees increase by 200
  10. Strategy Three – By The Numbers Umbrella Inc. ⇢ Client

    base increase New Accounts Closed – 31k ⇢ Best employee incentives ⇢ Increase from $530M to $846M Total Net Revenue ⇢ Increase from $530k to $705k Average Net Revenue Per Employee ⇢ Increase from $169M to $237M Total Employee Compensation ⇢ Increase in customer satisfaction Growth Rate of 35% Applied Variable
  11. Commission Structure Comparison Umbrella Inc. ⇢ Commission ⇢ Base Salary

    2018 Strategy One Strategy Two ⇢ Commission Per Account $72M $72M $86M $97M $5k $127M $5k $117M $5k Strategy Three $86M $150M $5k Combined Strategy
  12. 2019 Company Financial Forecast ⇢ Base salary for all employees

    is $86M ⇢ Commission total of $150M based on 31k Closed Accounts Key Projections $1.0B $705k Average Net Revenue Per Employee $237M Total Compensation Umbrella Inc. ⇢ Total Gross Revenue $846M ⇢ Total Net Revenue 1,200 0 200 400 600 800 1,000 1,200 1,400 Assumed Number of Employees