Upgrade to Pro — share decks privately, control downloads, hide ads and more …

Assessing Modularity using Co-Change Clusters (Modularity 2014) - Best Paper Award

Assessing Modularity using Co-Change Clusters (Modularity 2014) - Best Paper Award

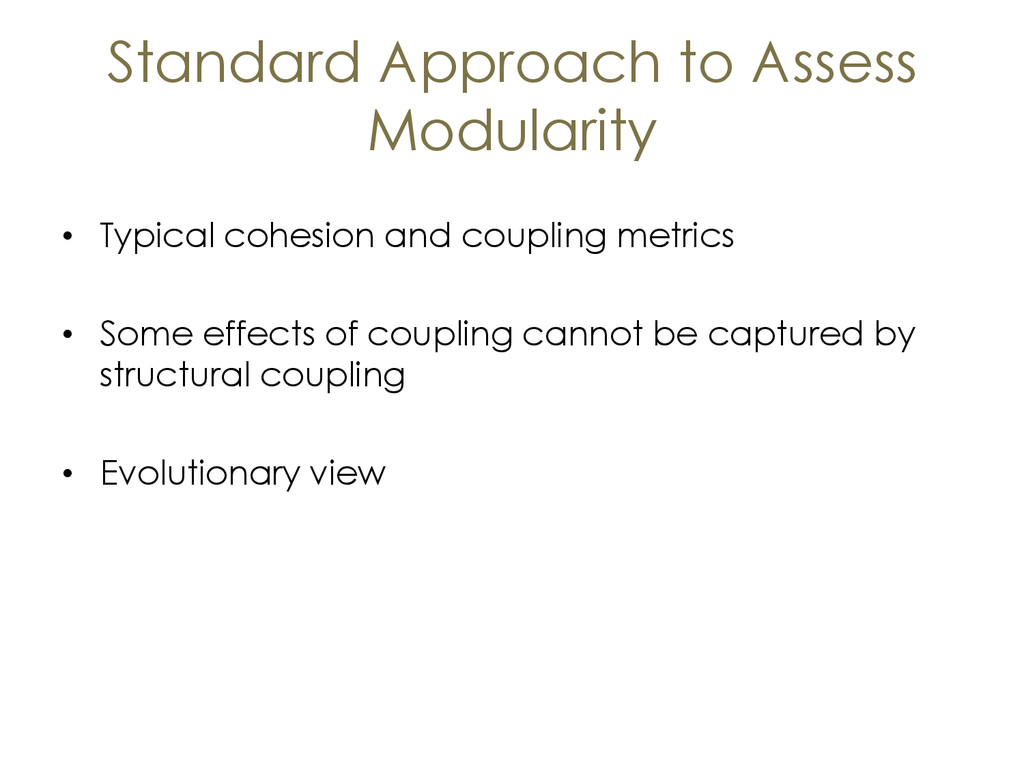
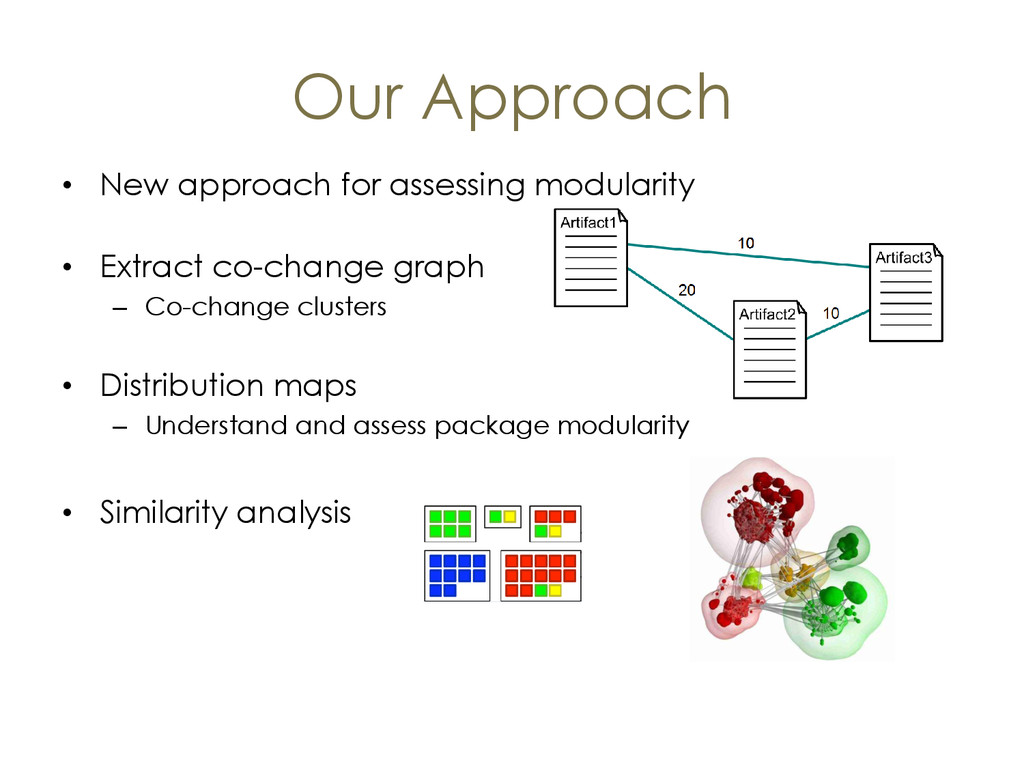
The traditional modular structure defined by the package hierarchy suffers from the dominant decomposition problem and it is widely accepted that alternative forms of modularization are necessary to increase developer’s productivity. In this paper, we propose an alternative form to understand and assess package modularity based on co-change clusters, which are highly inter-related classes considering co-change relations. We evaluate how co-change clusters relate to the package decomposition of three real-world systems. The results show that the projection of co-change clusters to packages follow different patterns in each system. Therefore, we claim that modular views based on co-change clusters can improve developers’ understanding on how well-modularized are their systems, considering that modularity is the ability to confine changes and evolve components in parallel.

ASERG, DCC, UFMG

April 23, 2014
Tweet

More Decks by ASERG, DCC, UFMG

Other Decks in Research

Transcript

  1. Assessing Modularity using
    Co-Change Clusters
    Luciana Lourdes Silva, Marco Túlio Valente, and Marcelo Maia
    Federal University of Minas Gerais, Brazil
    http://aserg.labsoft.dcc.ufmg.br/
    ACM Modularity, Lugano, Switzerland, April 22-25, 2014

    View Slide

  2. Motivation
    Modules should hide important design decisions or
    decisions that are likely to change
    [Parnas, 1972] .

    View Slide

  3. Motivation
    A module represents a responsibility assignment.
    [Parnas, 1972] .

    View Slide

  4. Standard Approach to Assess
    Modularity
    • Typical cohesion and coupling metrics
    • Some effects of coupling cannot be captured by
    structural coupling
    • Evolutionary view

    View Slide

  5. Our Approach
    • New approach for assessing modularity
    • Extract co-change graph
    – Co-change clusters
    • Distribution maps
    – Understand and assess package modularity
    • Similarity analysis

    View Slide

  6. Proposed Approach

    View Slide

  7. Proposed Approach
    mapping
    Co-change
    Extraction
    Issue Tracker
    & VCS
    Metrics &
    Views

    View Slide

  8. Proposed Approach
    mapping
    Co-change
    Extraction
    Issue Tracker
    & VCS
    Metrics &
    Views

    View Slide

  9. Pre-Processing Tasks
    #1 – not associated to maintenance issues
    #2 – not changing classes
    #3 – merge commits
    #4 – tangled changes
    #5 – highly scattered commits

    View Slide

  10. #1 – Not Associated to
    Maintenance issues
    Commit #10:
    changes two different maintenance tasks
    Commit #20 - contains an unfinished task
    Commit #21 - the rest of the previous task

    View Slide

  11. #2 – Not Changing Classes
    • There are commits that only change artifacts
    like:
    – Configuration files;
    – Documentation;
    – Script files.
    • We also eliminate unit testing classes

    View Slide

  12. #3 – Merge Commits

    View Slide

  13. #4 – Tangled Changes

    View Slide

  14. #5 – Highly Scattered Commits

    View Slide

  15. Proposed Approach
    mapping
    Co-change
    Extraction
    Issue Tracker
    & VCS
    Metrics &
    Views

    View Slide

  16. Proposed Approach
    mapping
    Co-change
    Extraction
    Issue Tracker
    & VCS
    Metrics &
    Views

    View Slide

  17. Co-Change Graph
    Class #3
    Class #6
    Class #7
    Class #5
    Class #2
    Class #4
    Class #1
    Class #7
    1
    10
    20
    6
    8
    1
    1
    12
    9
    Min_Weight = 2 co-changes

    View Slide

  18. Co-Change Graph
    Post-Processing
    Class #3
    Class #6
    Class #7
    Class #5
    Class #2
    Class #4
    Class #1
    Class #7
    1 10
    20
    6
    8
    1
    1
    12
    9

    View Slide

  19. Co-Change Graph
    Post-Processing
    Class #3
    Class #6
    Class #7
    Class #5
    Class #2
    Class #4
    Class #1
    Class #7
    10
    20
    6
    8
    12
    9

    View Slide

  20. Graph Clustering
    mapping
    Co-Change Clusters
    VCS
    Issue
    Reports
    Chameleon Algorithm

    View Slide

  21. Semantic Similarity
    Analysis
    Distribution Maps
    Measure Results
    Co-change clusters
    Co-change
    Graph
    Issue Reports
    Commit
    Proposed Approach

    View Slide

  22. Results

    View Slide

  23. Target Systems
    NOP = Number of Packages
    NOC = Number of Classes
    LOC = Line of Codes

    View Slide

  24. Target Systems
    NOP = Number of Packages
    NOC = Number of Classes
    LOC = Line of Codes

    View Slide

  25. Threshold Selection
    Max_Scattering = 10 packages
    Min_Weight = 2 co-changes
    Min_Cluster_Size = 4 classes

    View Slide

  26. Pre-Processing Tasks

    View Slide

  27. Co-Change Graph
    Post-Processing
    Min_Weight = 2 co-changes
    D = Graph Density

    View Slide

  28. Co-Change Graph
    Post-Processing
    Min_Weight = 2 co-changes
    D = Graph Density

    View Slide

  29. Co-Change Graph
    Post-Processing
    Min_Weight = 2 co-changes
    D = Graph Density

    View Slide

  30. Co-Change Graph
    Post-Processing
    Min_Weight = 2 co-changes
    D = Graph Density

    View Slide

  31. #Co-change Clusters
    NOP = Number of Packages
    The #clusters is smaller than the #packages

    View Slide

  32. Modularity Analysis
    • Goal:
    – How co-change clusters can be used to assess
    the quality of package decompositions?
    • We rely on distribution maps:
    – Focus
    – Spread

    View Slide

  33. Distribution Map
    Focus = 1
    Spread = 4

    View Slide

  34. Modularity Analysis
    Geronimo
    Focus
    Spread
    Focus
    Spread
    Lucene
    JDT Core
    Focus
    Spread

    View Slide

  35. Distribution Map for Geronimo
    • Clusters well-encapsulated in a single package

    View Slide

  36. Distribution Map for Geronimo
    • Partially encapsulated but touching other packages

    View Slide

  37. Distribution Map for Lucene

    View Slide

  38. Distribution Map for Lucene
    • Clusters well-confined in packages (spread = 1)

    View Slide

  39. Distribution Map for JDT Core

    View Slide

  40. Distribution Map for JDT Core
    Co-change clusters with crosscutting behavior

    View Slide

  41. Distribution Map for JDT Core
    Partially encapsulated but touching other packages
    Problem?

    View Slide

  42. Summing Up
    Well Encapsulated Clusters
    – Geronimo: 45%
    Crosscutting Clusters
    – Lucene: 24.5%
    – JDT Core: 42%
    Clusters Partially Encapsulated
    – Suggests a possible ripple effect
    – Geronimo: 4 clusters, Lucene: 5 clusters

    View Slide

  43. Similarity Analysis
    • Goal:
    – Improve the understanding of cluster’s meaning.
    • We rely on:
    – Pre-processing text
    – LSA – Latent Semantic Analysis
    – Cosine similarity

    View Slide

  44. Semantic Similarity Analysis
    Extract
    Vocabulary
    Filter Issue Text
    LSA +
    Cosine

    View Slide

  45. Semantic Similarity Analysis
    • Spearman Correlation Test
    Geronimo
    The higher is the #similarIssues in a cluster,
    The higher is the focus
    Lucene
    The higher is the #similarIssues in a cluster,
    The lower is the spread

    View Slide

  46. Semantic Similarity Analysis
    • Spearman Correlation Test
    JDT Core
    Induces different properties in the clusters,
    either spread and focus.

    View Slide

  47. Conclusion

    View Slide

  48. Summary
    • Method to extract an alternative view
    • Co-change graphs are sparse
    • But, co-change clusters are dense
    – High internal similarity concerning co-changes
    – Semantic similarity concerning their issue reports
    – Co-change cluster patterns

    View Slide

  49. Further Work
    • Consider co-change at a finer-granularity level
    • Include non-source code artifacts
    • Clusters can be used as an alternative to the
    Package Explorer?

    View Slide

  50. View Slide