Upgrade to Pro — share decks privately, control downloads, hide ads and more …

Uncovering Causal Relationships between Software Metrics and Bugs (CSMR 2012)

Uncovering Causal Relationships between Software Metrics and Bugs (CSMR 2012)

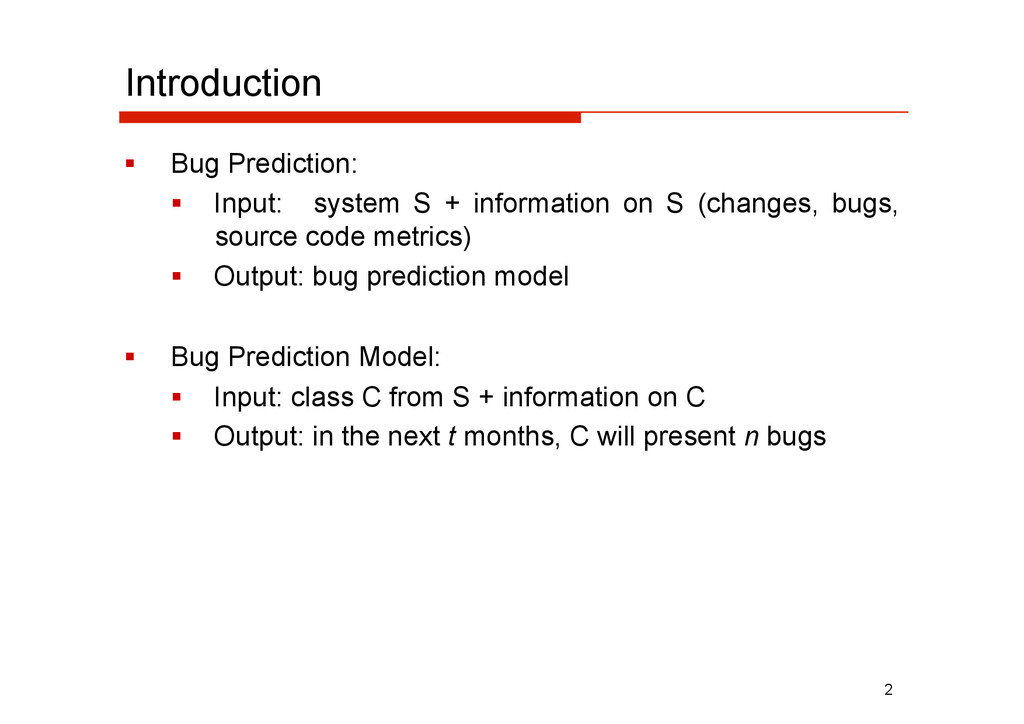
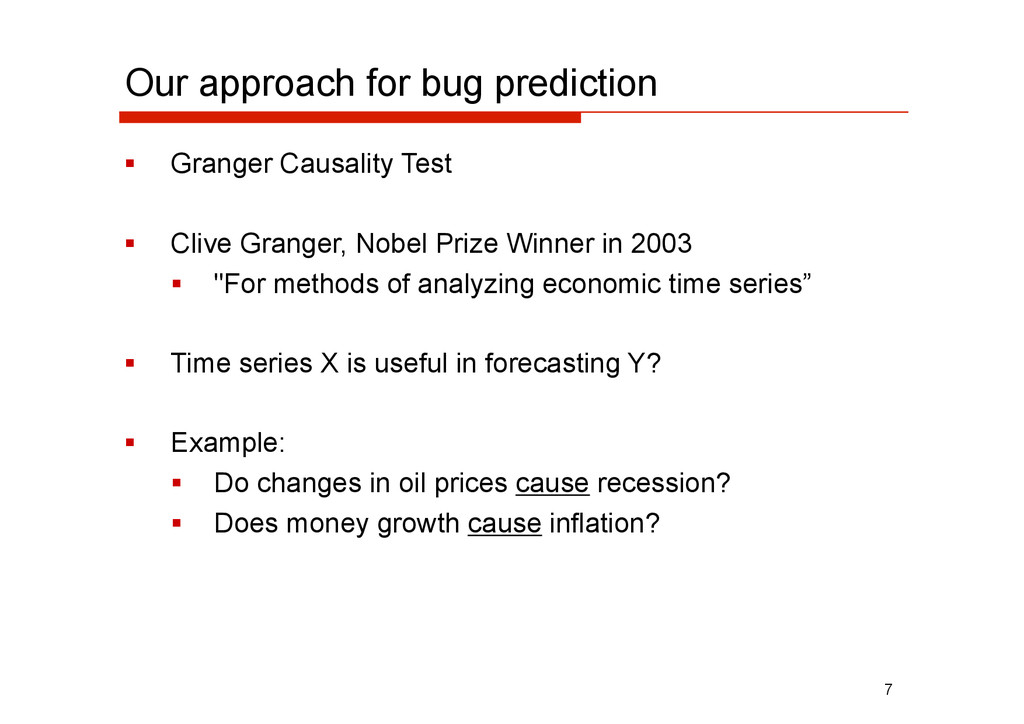
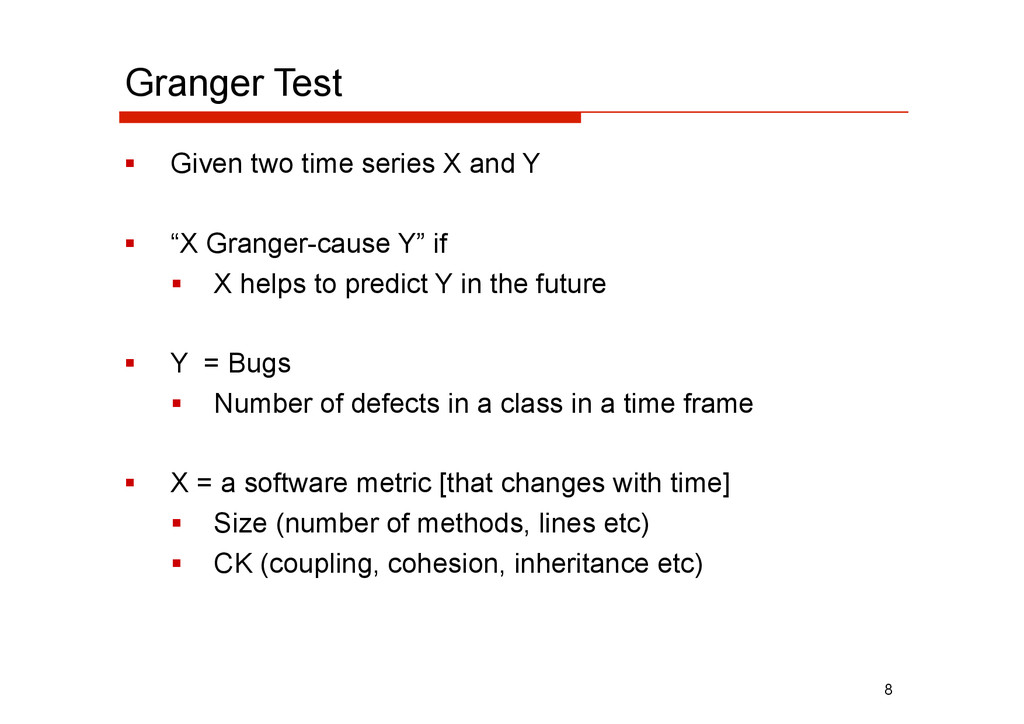
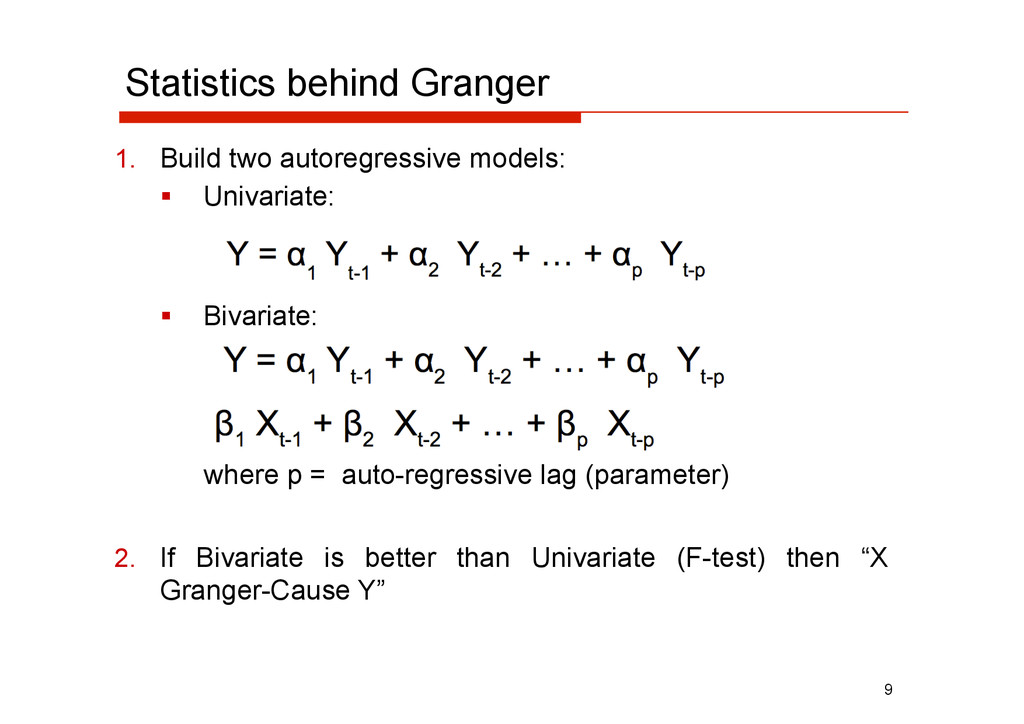
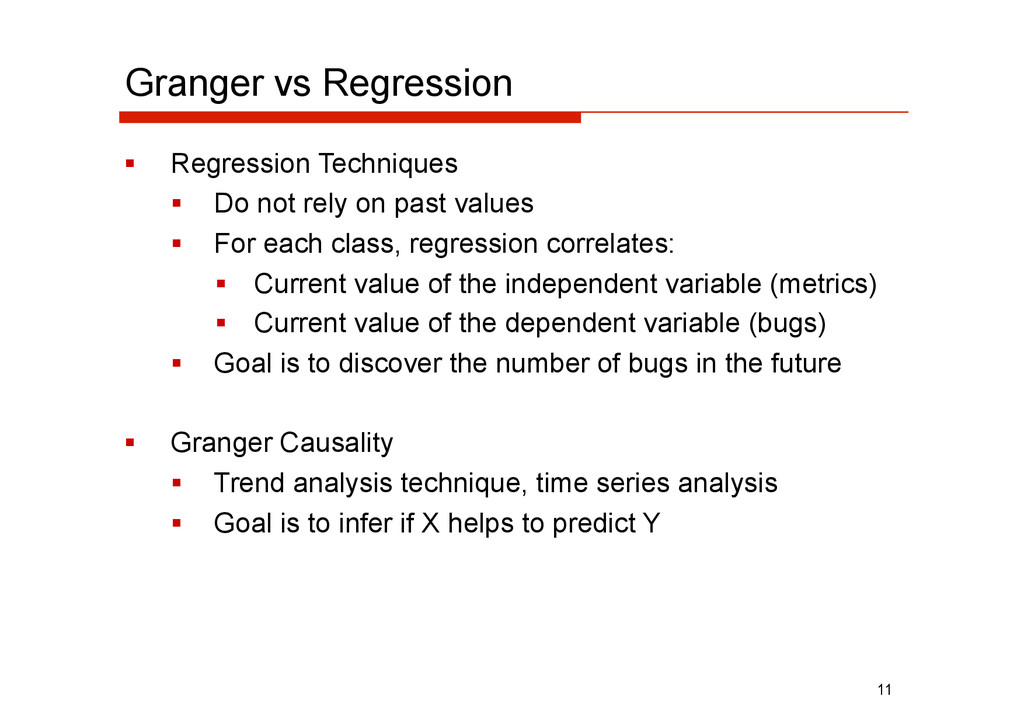
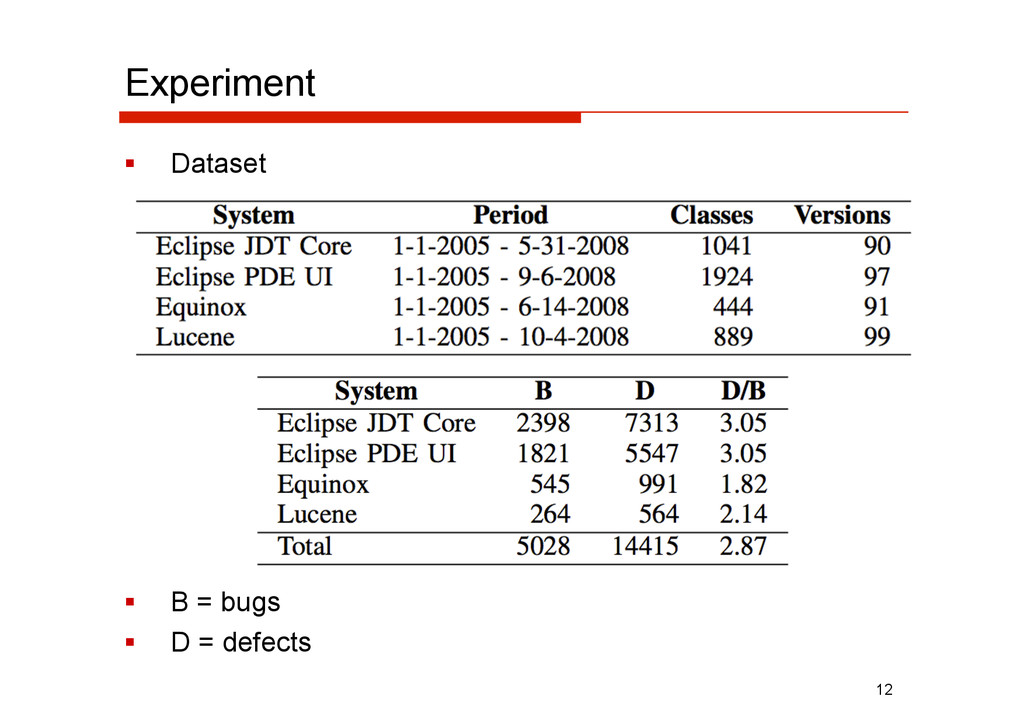
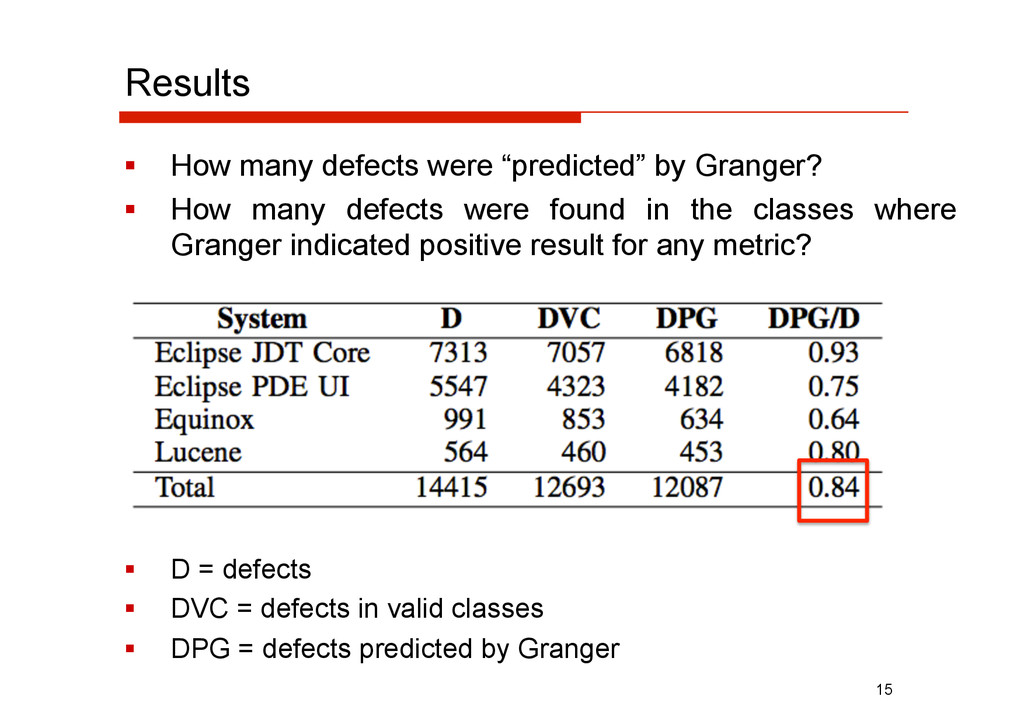
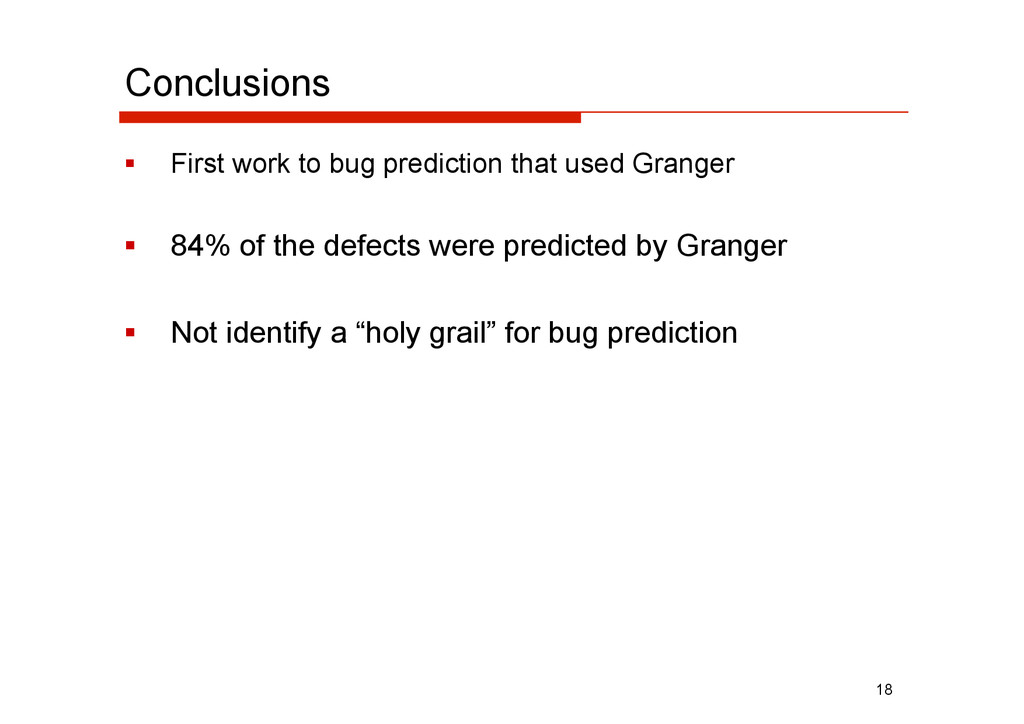
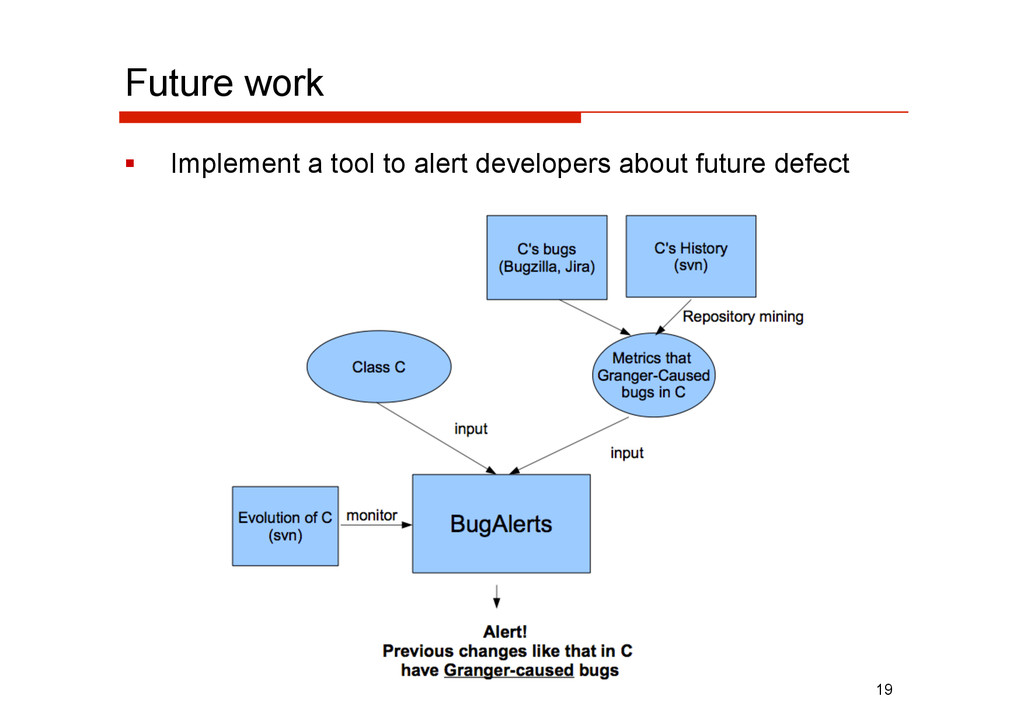
Bug prediction is an important challenge for software engineering research. It consist in looking for possible early indicators of the presence of bugs in a software. However, despite the relevance of the issue, most experiments designed to evaluate bug prediction only investigate whether there is a linear relation between the predictor and the presence of bugs. However, it is well known that standard regression models cannot filter out spurious relations. Therefore, in this paper we describe an experiment to discover more robust evidences towards causality between software metrics (as predictors) and the occurrence of bugs. For this purpose, we have relied on Granger Causality Test to evaluate whether past changes in a given time series are useful to forecast changes in another series. As its name suggests, Granger Test is a better indication of causality between two variables. We present and discuss the results of experiments on four real world systems evaluated over a time frame of almost four years. Particularly, we have been able to discover in the history of metrics the causes – in the terms of the Granger Test – for 64% to 93% of the defects reported for the systems considered in our experiment.

ASERG, DCC, UFMG

March 30, 2012
Tweet

More Decks by ASERG, DCC, UFMG

Other Decks in Research

Transcript

  1. Uncovering Causal Relationships between
    Software Metrics and Bugs
    Nicolas Anquentil
    RMoD Team
    [email protected]
    Cesar Couto, Marco Tulio Valente, Roberto Bigonha
    Department of Computer Science
    {cesarfmc,mtov,bigonha}@dcc.ufmg.br

    View Slide

  2. Introduction
      Bug Prediction:
      Input: system S + information on S (changes, bugs,
    source code metrics)
      Output: bug prediction model
      Bug Prediction Model:
      Input: class C from S + information on C
      Output: in the next t months, C will present n bugs
    2

    View Slide

  3. Introduction
      No questions on the value of this information
      Software Quality
      Preventive Maintenance
      Project Management
      The real question is:
      How reliable is this information?
    3

    View Slide

  4. Most common statistics behind prediction models
      [Linear] regression model
    4
    Class Independent Variable
    (any metric)
    Dependent Variable
    (# of post-release defects)
    C1 5 2
    C2 6 4
    C3 4 1
    … … …
    #defects
    #metric
    y = α + βx

    View Slide

  5. Common predictors
      D'Ambros; Lanza; MSR 2009
    5

    View Slide

  6. Problem: Correlation does not imply causation
      Spurious Correlation
      Business Week 2011
    6

    View Slide

  7. Our approach for bug prediction
      Granger Causality Test
      Clive Granger, Nobel Prize Winner in 2003
      "For methods of analyzing economic time series”
      Time series X is useful in forecasting Y?
      Example:
      Do changes in oil prices cause recession?
      Does money growth cause inflation?
    7

    View Slide

  8. Granger Test
      Given two time series X and Y
      “X Granger-cause Y” if
      X helps to predict Y in the future
      Y = Bugs
      Number of defects in a class in a time frame
      X = a software metric [that changes with time]
      Size (number of methods, lines etc)
      CK (coupling, cohesion, inheritance etc)
    8

    View Slide

  9. Statistics behind Granger
      Univariate:
      Bivariate:
    where p = auto-regressive lag (parameter)
    9
    1.  Build two autoregressive models:
    2.  If Bivariate is better than Univariate (F-test) then “X
    Granger-Cause Y”

    View Slide

  10. Granger Test example
    10

    View Slide

  11. Granger vs Regression
      Regression Techniques
      Do not rely on past values
      For each class, regression correlates:
      Current value of the independent variable (metrics)
      Current value of the dependent variable (bugs)
      Goal is to discover the number of bugs in the future
      Granger Causality
      Trend analysis technique, time series analysis
      Goal is to infer if X helps to predict Y
    11

    View Slide

  12. Experiment
      Dataset
      B = bugs
      D = defects
    12

    View Slide

  13. Experiment
      Metrics
    13

    View Slide

  14. Methodology
      success[c,m,lag]:
      boolean matrix with results for Granger
      Dimensions represents classes, metrics, lags
    14
    for each class c!
    for each metric m!
    for lag = 1 to 4 do!
    if granger(tsm[c,m], tsd[c], lag)!
    then success[c,m,lag] = true!
    else success[c,m,lag] = false!

    View Slide

  15. Results
      How many defects were “predicted” by Granger?
      How many defects were found in the classes where
    Granger indicated positive result for any metric?
      D = defects
      DVC = defects in valid classes
      DPG = defects predicted by Granger
    15

    View Slide

  16. Results
      What are the metrics that most contributed to predict
    defects?
    16

    View Slide

  17. Results
      What are the lag values that most led to positive
    results for Granger?
    17

    View Slide

  18. Conclusions
      First work to bug prediction that used Granger
      84% of the defects were predicted by Granger
      Not identify a “holy grail” for bug prediction
    18

    View Slide

  19. Future work
      Implement a tool to alert developers about future defect
    19

    View Slide

  20. Questions?

    View Slide