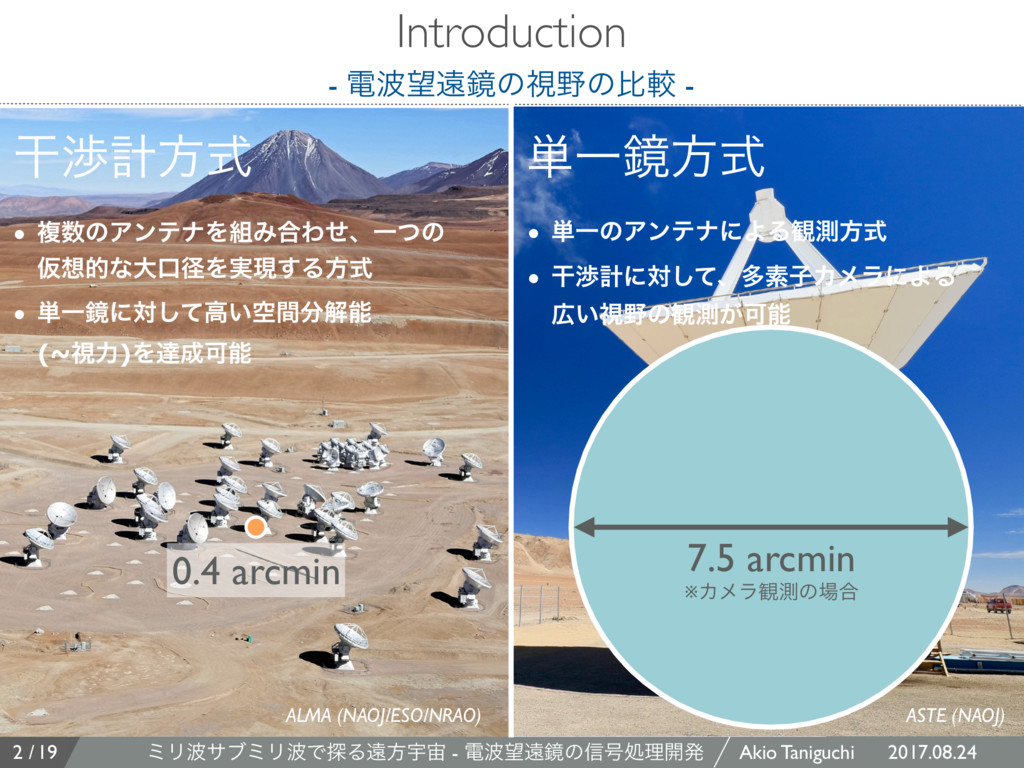
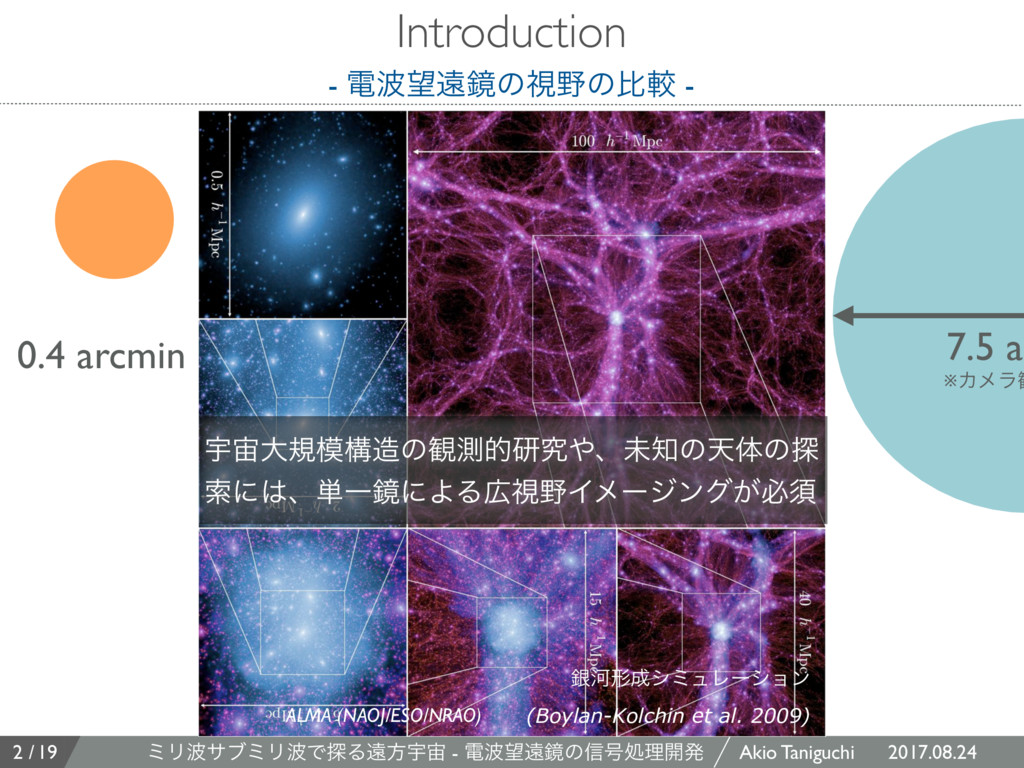
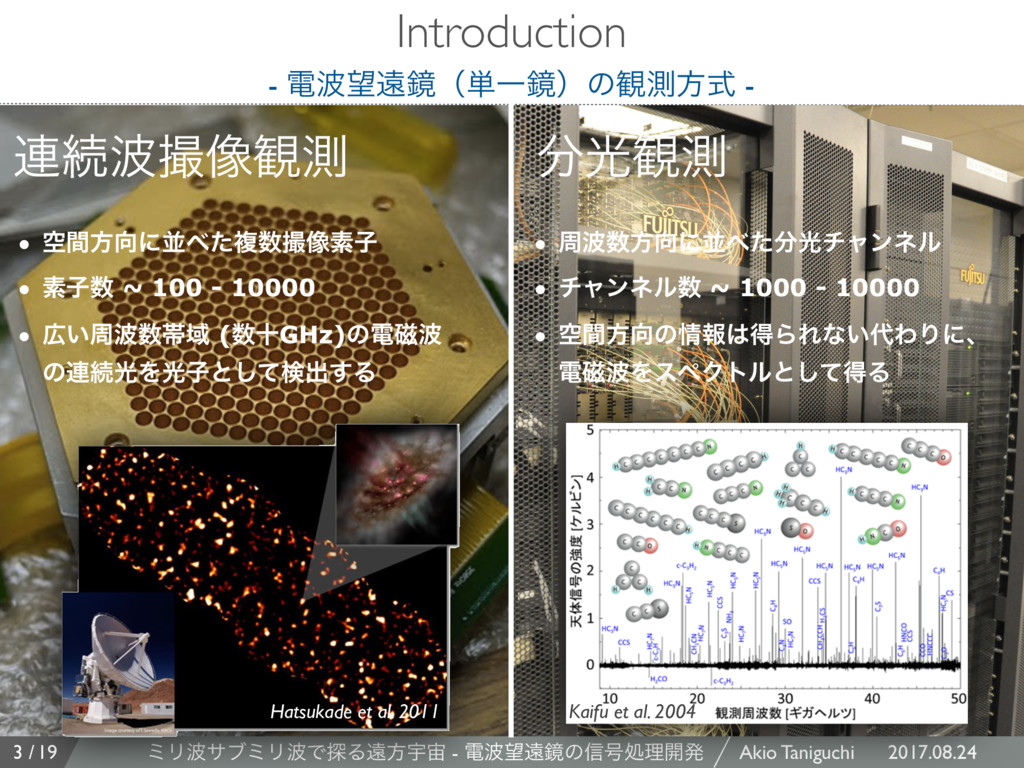
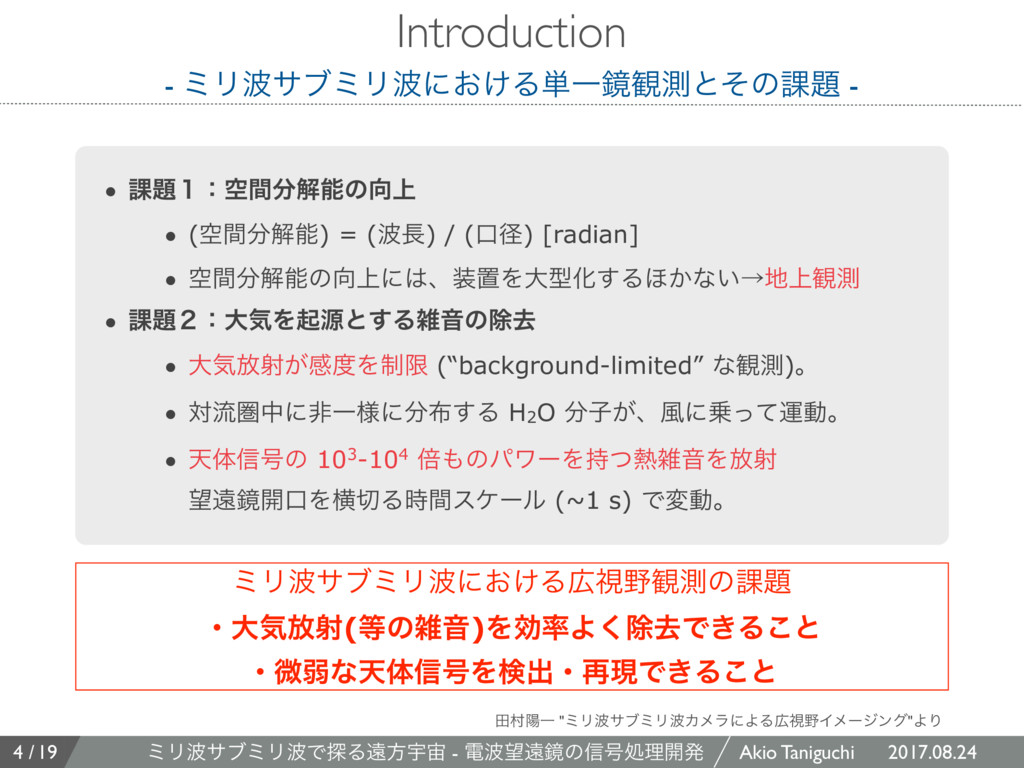
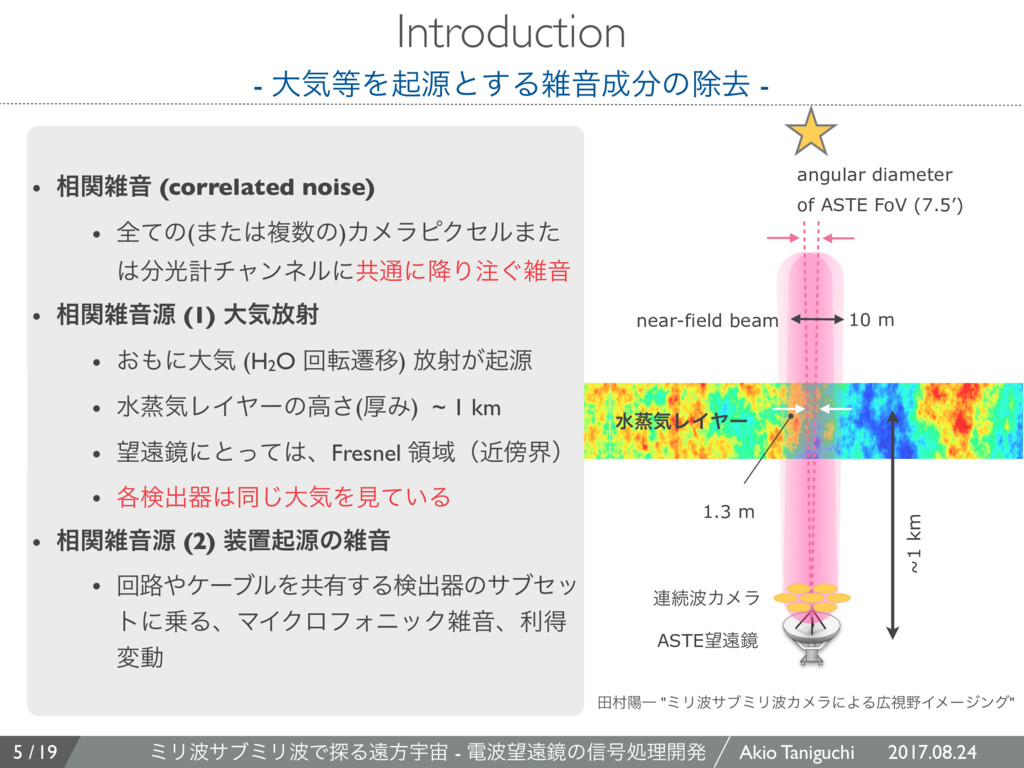
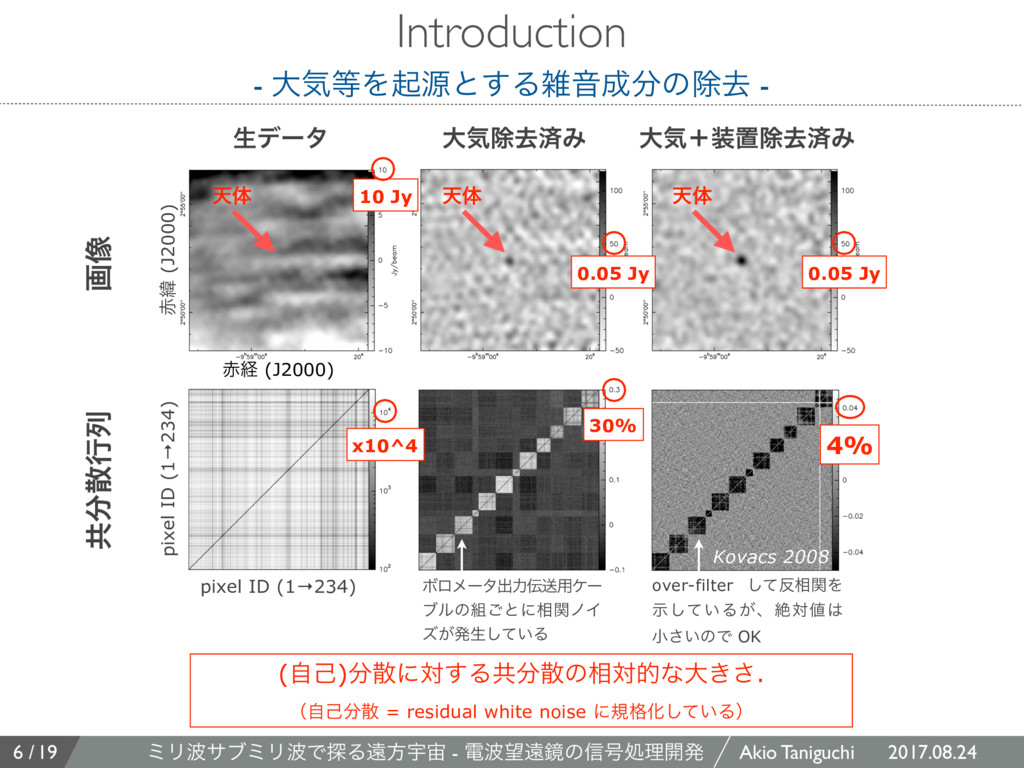
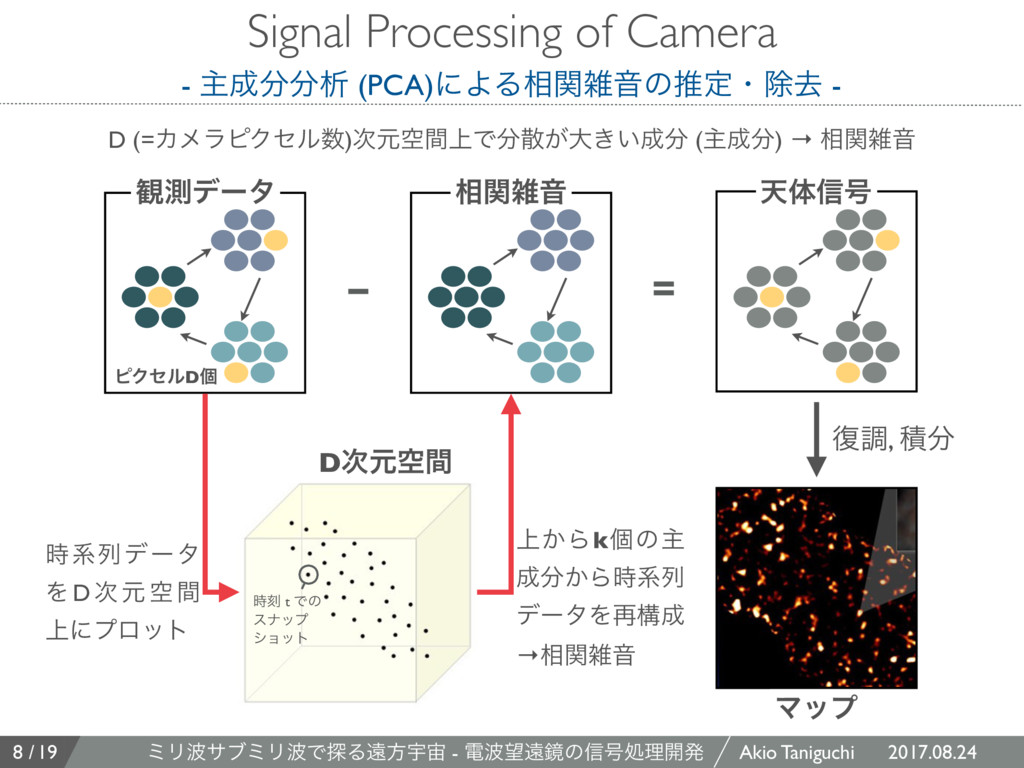
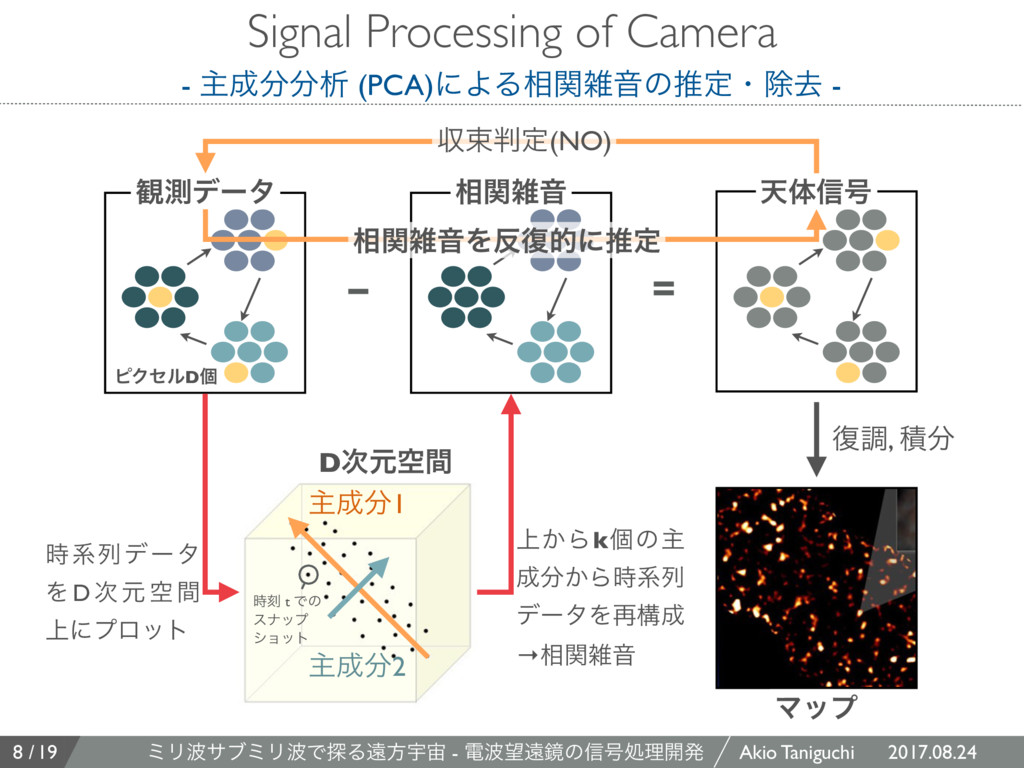
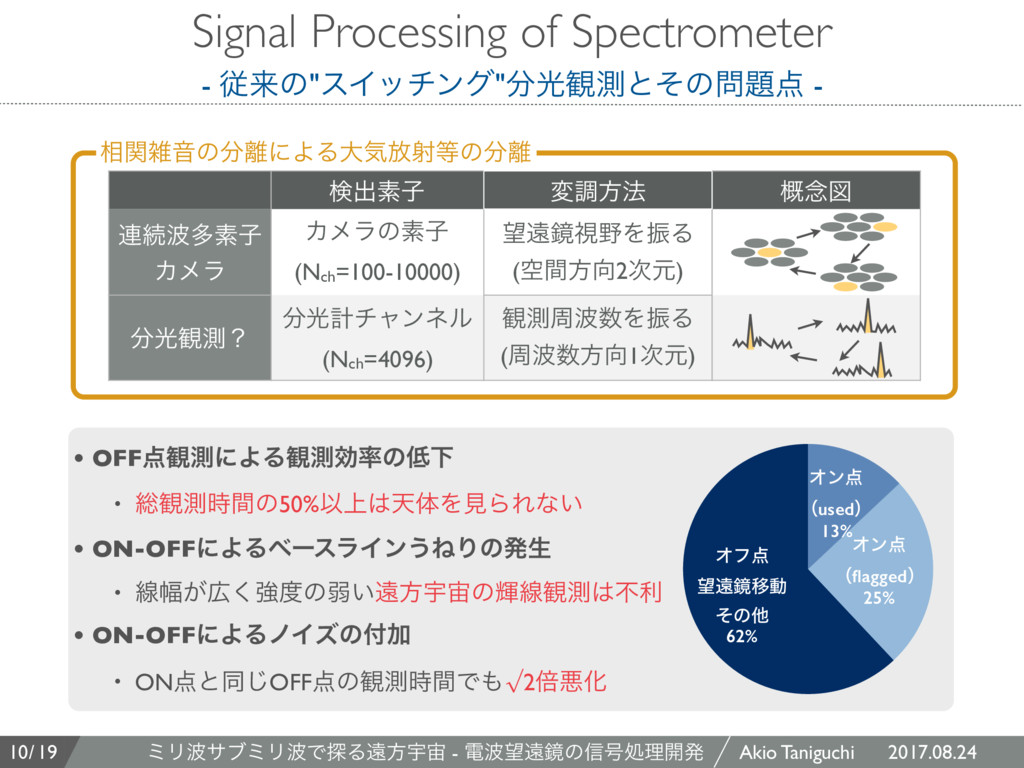
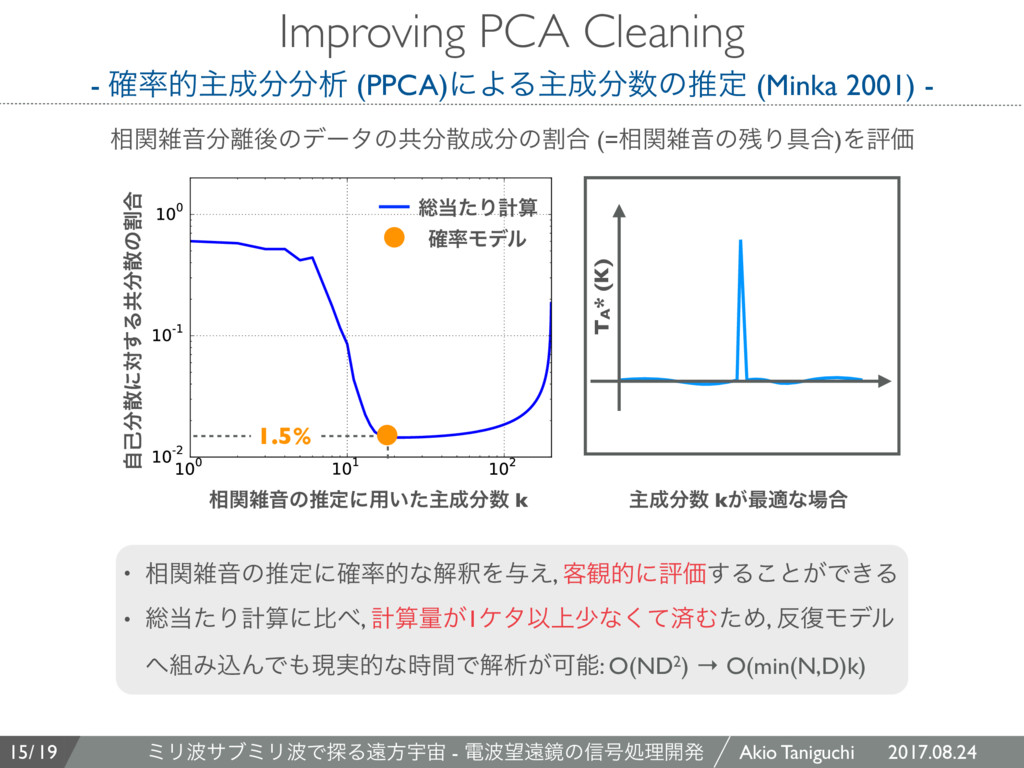
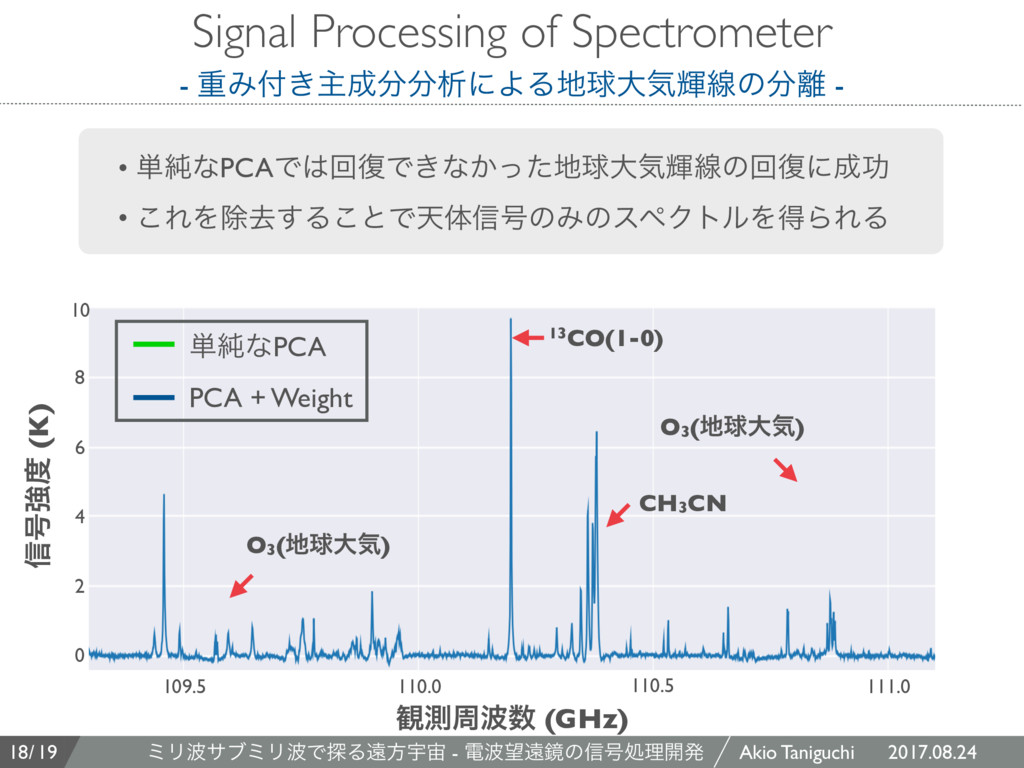
- େؾΛىݯͱ͢ΔࡶԻͷআڈ - 25OOO Jy/beam 0 mJy/beam 255OO' mJy/beam 25OOO 255OO Figure 2. Dealing with degeneracies. The awkward choice between keeping more extended emission or paying the price of higher map noise: an example of a simulated 100 mJy point source implanted in a single 8-minute blank-field LABOCA scan and reduced three different ways. Shown are a direct map (top left), produced with signal centering only, a map with correlated sky removal (top center), and with additional band-cable decorrelation (top right) taking place before the mapping step. The corresponding effective map rms values are 4.4, 0.012, and 0.011 Jy/beam respectively. Below the maps are the normalized (see Sec. 5.9) residual pixel-to-pixel covariances after the reduction, for the 234 working channels in the array, here with the diagonal 1 values zeroed. The left map preserves source structures on all scales, but these would only be seen if are well in excess of the whopping ∼4 Jy/beam apparent noise level. As the covariance matrix below it demonstrates the data has strong correlated signals across the full array (consistent with atmospheric noise), at levels thousands of times above the detector white noise level. Note, that the larger scales are more severely affected in the map. After removal of the atmospheric noise, the image (top center) no longer contains scales >FoV (∼11’), but pixel ID (1→234) pixel ID (1→234) (ࣗݾ)ࢄʹର͢Δڞࢄͷ૬ରతͳେ͖͞. ʢࣗݾࢄ = residual white noise ʹن֨Խ͍ͯ͠Δʣ ڞࢄߦྻ ը૾ ੜσʔλ େؾআڈࡁΈ େؾʴஔআڈࡁΈ over-filter ͯ͠૬ؔΛ ͍ࣔͯ͠Δ͕ɺઈର খ͍͞ͷͰ OK Ϙϩϝʔλग़ྗૹ༻έʔ ϒϧͷ͝ͱʹ૬ؔϊΠ ζ͕ൃੜ͍ͯ͠Δ 30% 4% x10^4 Kovacs 2008 Ң (J2000) ܦ (J2000) 10 Jy 0.05 Jy 0.05 Jy ఱମ ఱମ ఱମ
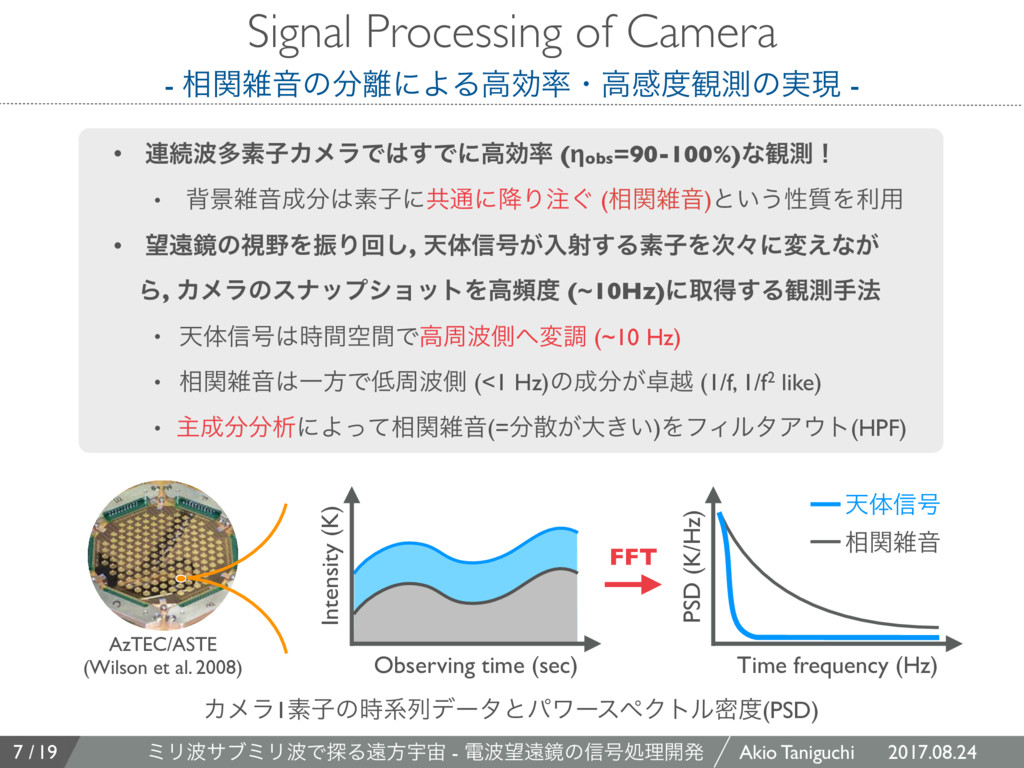
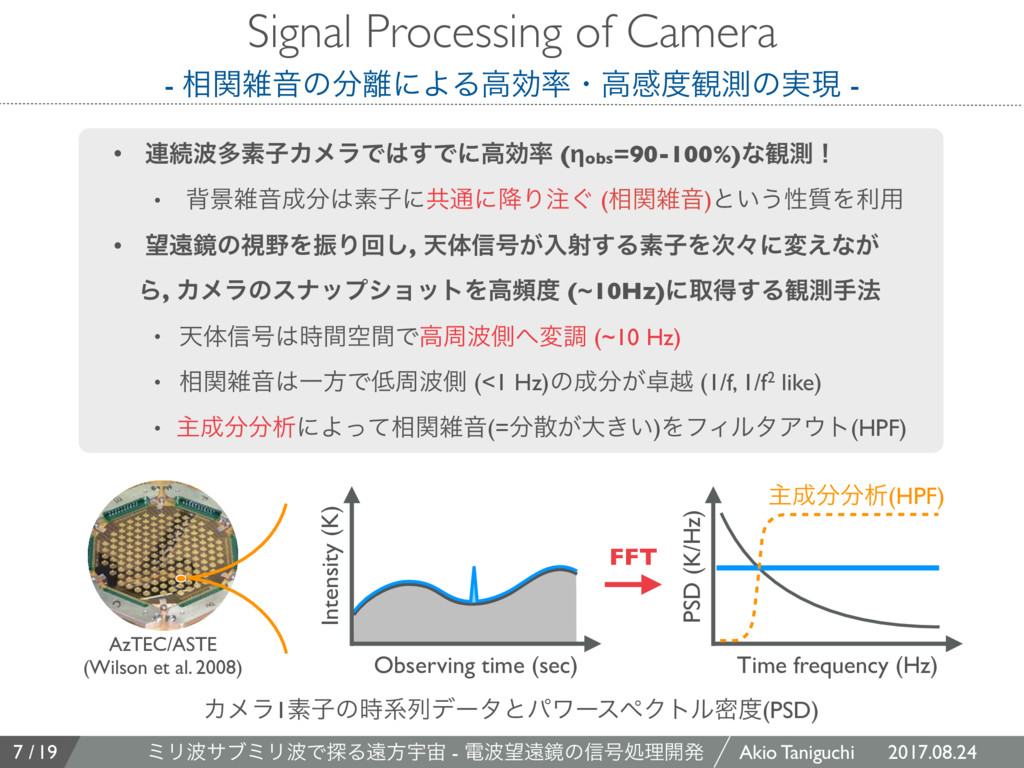
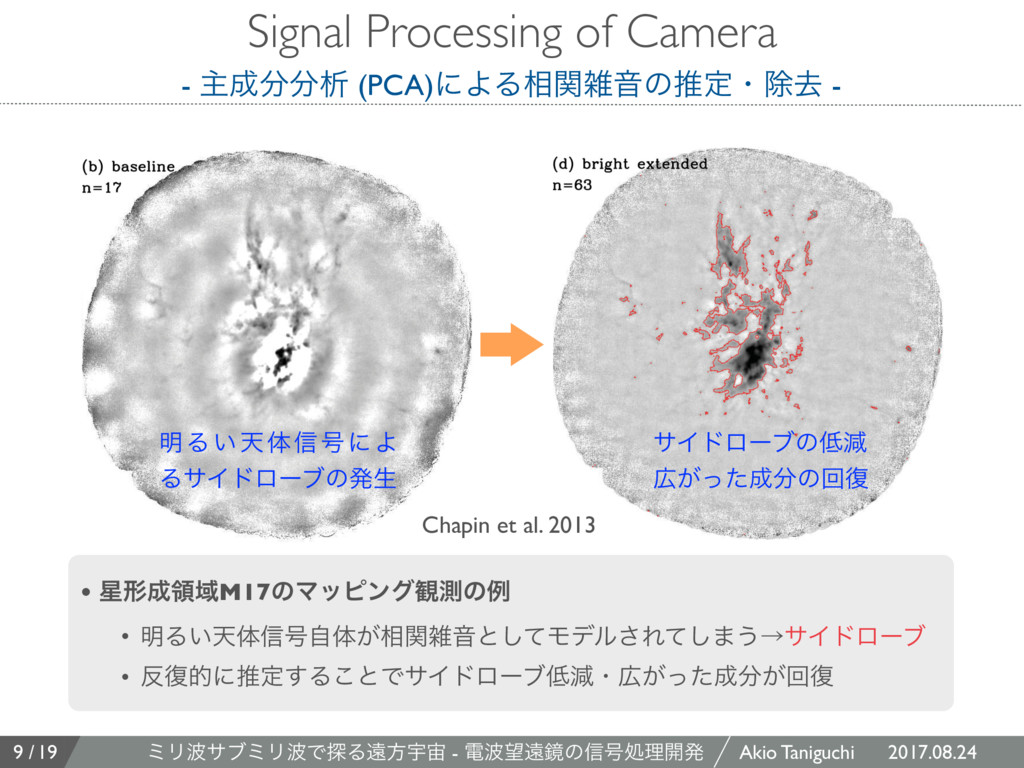
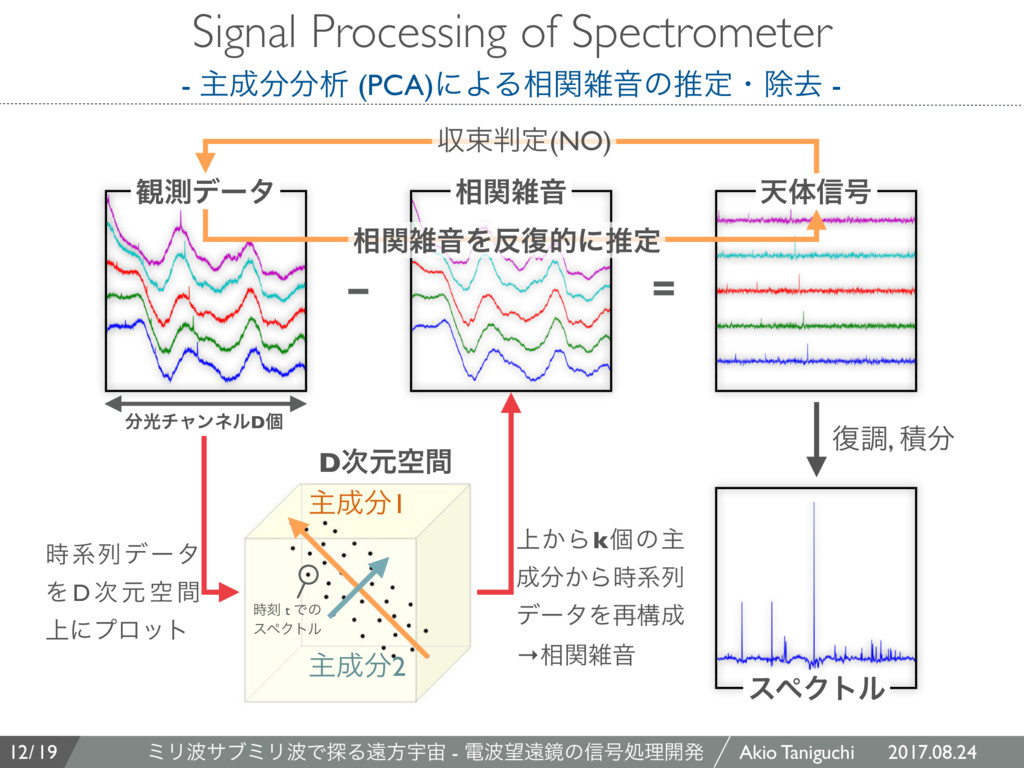
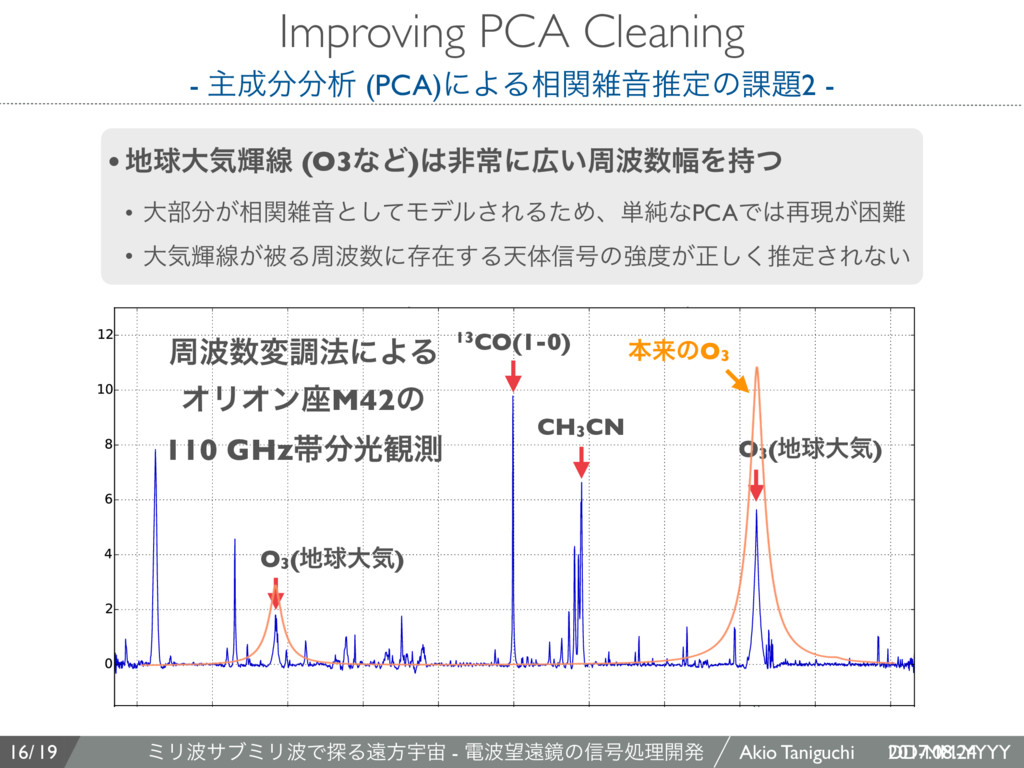
Processing of Camera - ओੳ (PCA)ʹΑΔ૬ؔࡶԻͷਪఆɾআڈ - Figure 17. An 850 µm rotating PONG map of M17. Intensity is logarithmically scaled between −0.0003 (white) and +0.01 pW (black). Iteration numbers are given in the corner of each panel. Panels (a) and (b) show the results for a reduction using the baseline parameters (the solution halted after reaching the map-based convergence criterion in 17 iterations). Panel (a) also depicts the array footprint (position angle indicative of the start of the observation), and a 300 arcsec line shows the spatial scale corresponding to the FLT high-pass filter. Similar to Fig. 11(c), the high-pass filtering introduces ringing around bright sources. Panels (c) and (d) show the ‘bright extended’ reduction, in which a zero mask is created iteratively from all of the pixels that lie below a S/N of 5. While this region (outside the red contour) only avoids the brightest peaks early in the solution, in the final iteration, it skirts most of the bright, extended emission, and significantly helps with negative ringing. mode subtraction and high-pass filtering. The first panel also depicts the array footprint, and the angular scale (300 arcsec) corresponding to the high-pass filter edge (0.6 Hz). Much like the reduction of a point source without any prior constraints field clearly contains extended structure. Furthermore, the goal of such maps may be to detect previously unknown cool, dense regions of the interstellar medium that may not have appeared at other wavelengths (e.g. the first optically-thick cloud-collapse stages of • ܗྖҬM17ͷϚοϐϯά؍ଌͷྫ • ໌Δ͍ఱମ৴߸ࣗମ͕૬ؔࡶԻͱͯ͠Ϟσϧ͞Εͯ͠·͏ˠαΠυϩʔϒ • ෮తʹਪఆ͢Δ͜ͱͰαΠυϩʔϒݮɾ͕͕ͬͨճ෮ Chapin et al. 2013 ໌Δ͍ఱମ৴߸ʹΑ ΔαΠυϩʔϒͷൃੜ αΠυϩʔϒͷݮ ͕ͬͨͷճ෮
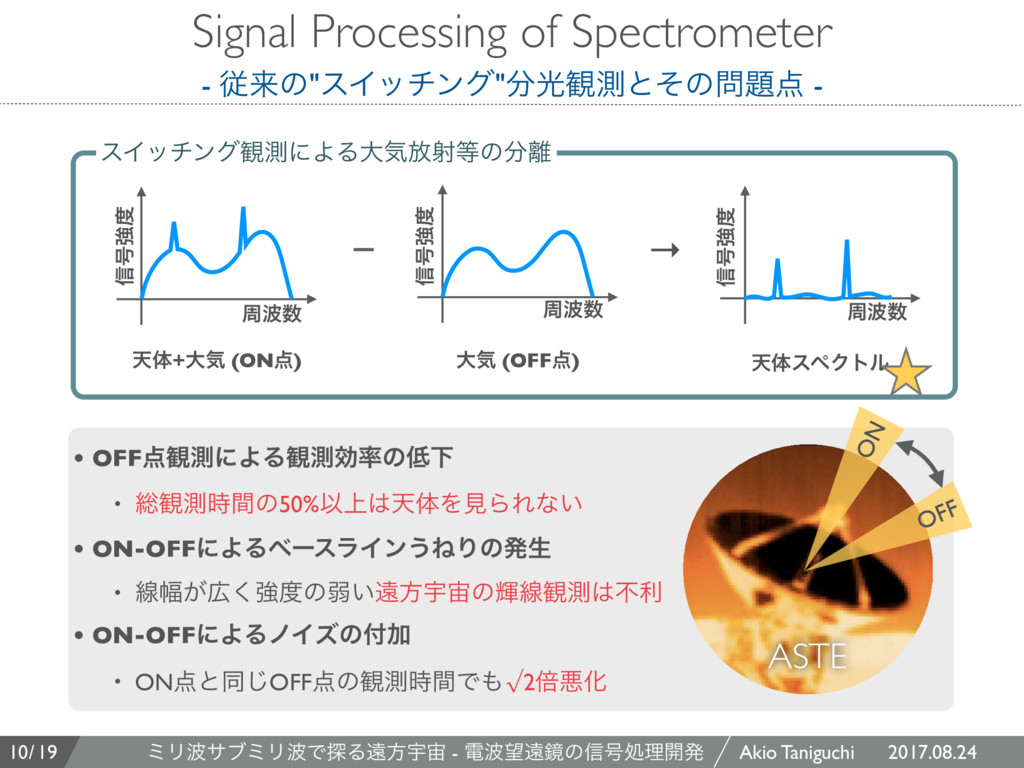
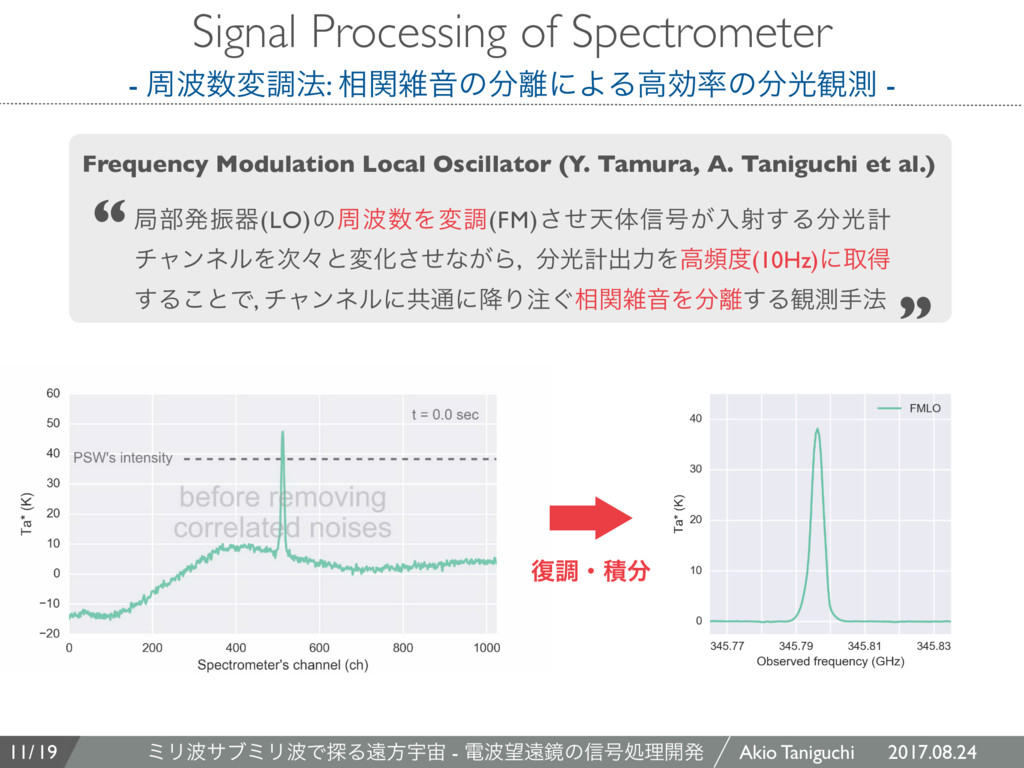
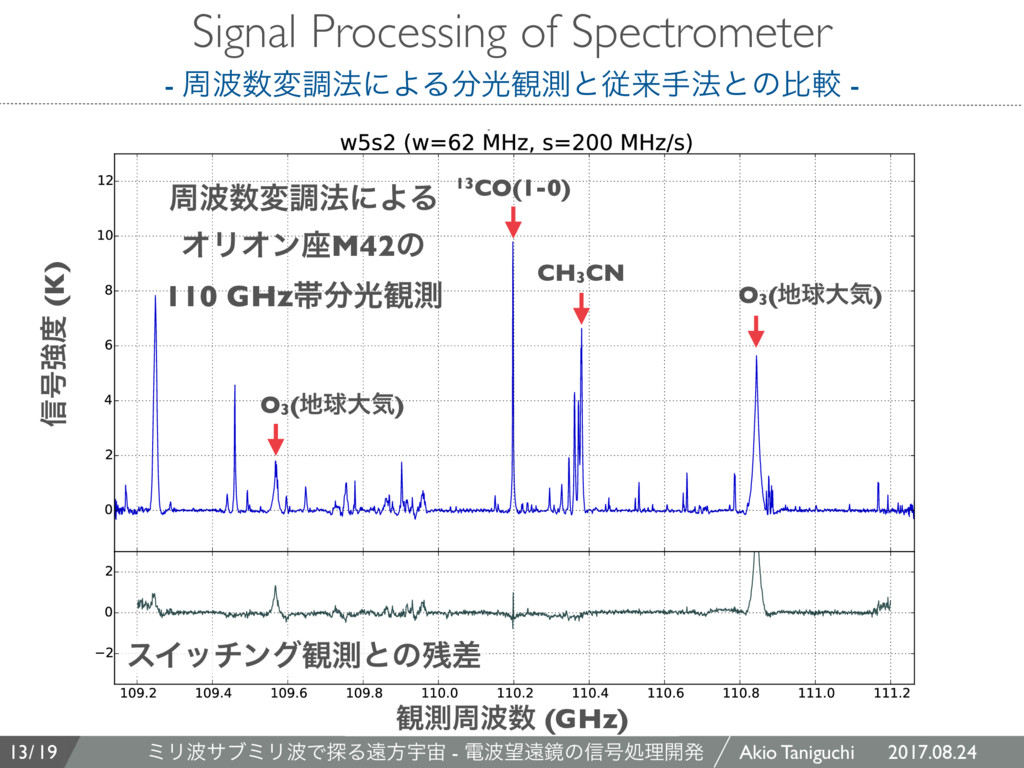
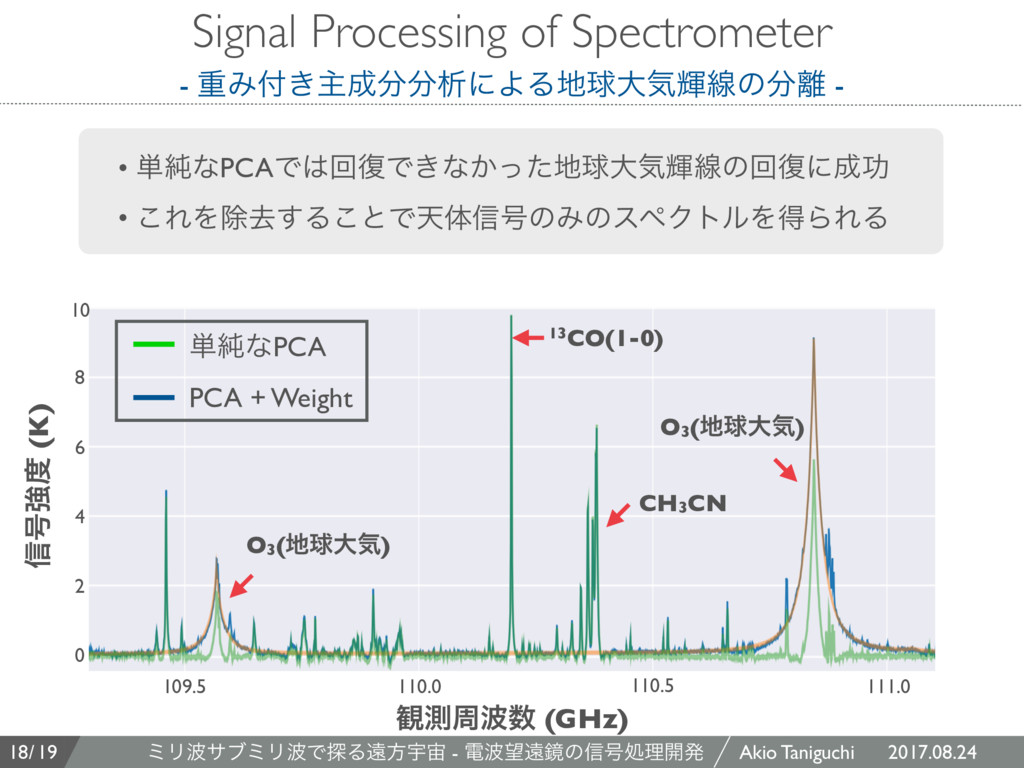
ہ෦ൃৼث(LO)ͷपΛมௐ(FM)ͤ͞ఱମ৴߸͕ೖࣹ͢Δޫܭ νϟϯωϧΛ࣍ʑͱมԽͤ͞ͳ͕Β, ޫܭग़ྗΛߴස(10Hz)ʹऔಘ ͢Δ͜ͱͰ, νϟϯωϧʹڞ௨ʹ߱Γ͙૬ؔࡶԻΛ͢Δ؍ଌख๏ “ ” Frequency Modulation Local Oscillator (Y. Tamura, A. Taniguchi et al.) Signal Processing of Spectrometer - पมௐ๏: ૬ؔࡶԻͷʹΑΔߴޮͷޫ؍ଌ -


 astropenguin
 kanekomasahiro
 tattaka
 sishi2026
 tkng
tkng
 rikkabotan7
 upura
upura
 koide3
 matsumooon
 polipoli
 izumiyama_lab
 yuukit
 zakiyama
 soudai
 bluesmoon
 ianozsvald
 aleyda
 samanthasiow
 pwiseman
 skoyamalab
 asonas
 ipullrank
 erikaheidi
 jlugia