PyData NYC 2014 2 First a Thank You! Without these two PyDataNYC would have been a lot colder. Leah Silen Executive Director NumFOCUS James Powell blog author, python enthusiast, code cowboy
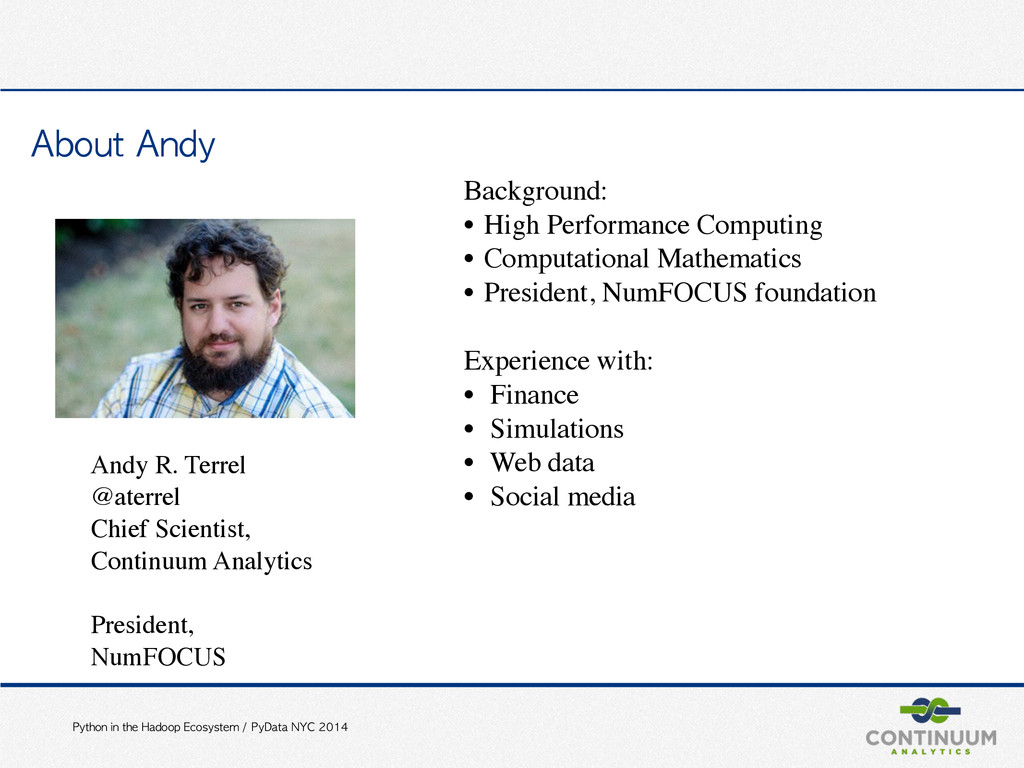
PyData NYC 2014 Python in the Hadoop Ecosystem / PyData NYC 2014 About Andy Andy R. Terrel @aterrel Chief Scientist, Continuum Analytics President, NumFOCUS Background: • High Performance Computing • Computational Mathematics • President, NumFOCUS foundation Experience with: • Finance • Simulations • Web data • Social media
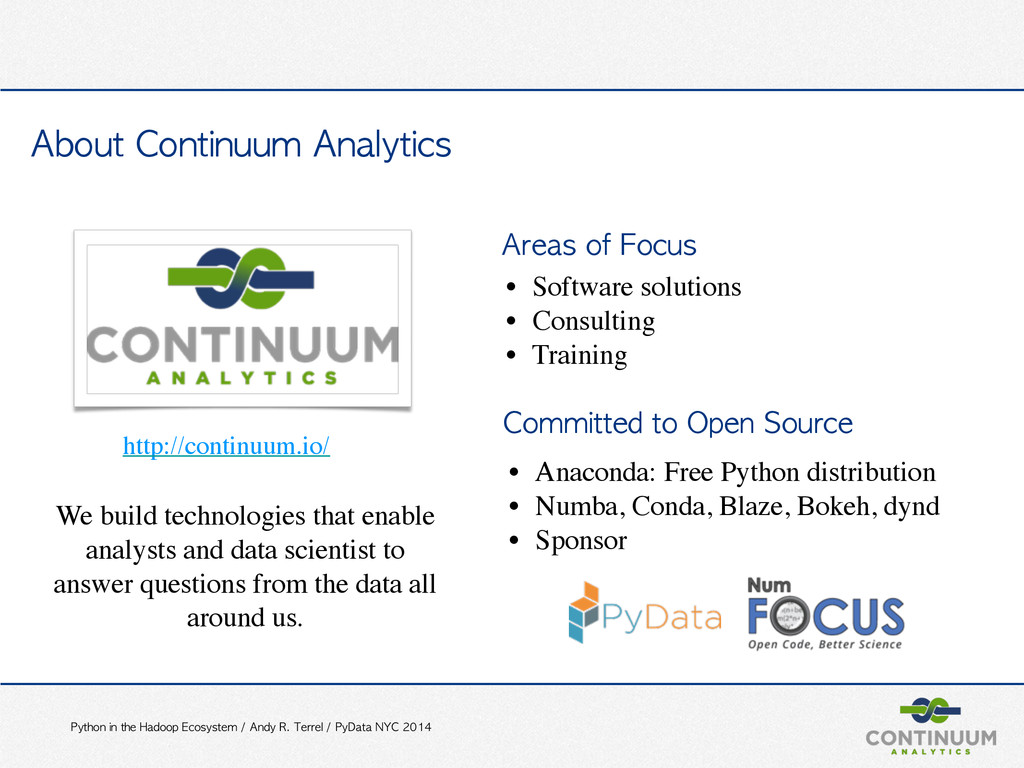
PyData NYC 2014 About Continuum Analytics http://continuum.io/ We build technologies that enable analysts and data scientist to answer questions from the data all around us. Committed to Open Source Areas of Focus • Software solutions • Consulting • Training • Anaconda: Free Python distribution • Numba, Conda, Blaze, Bokeh, dynd • Sponsor
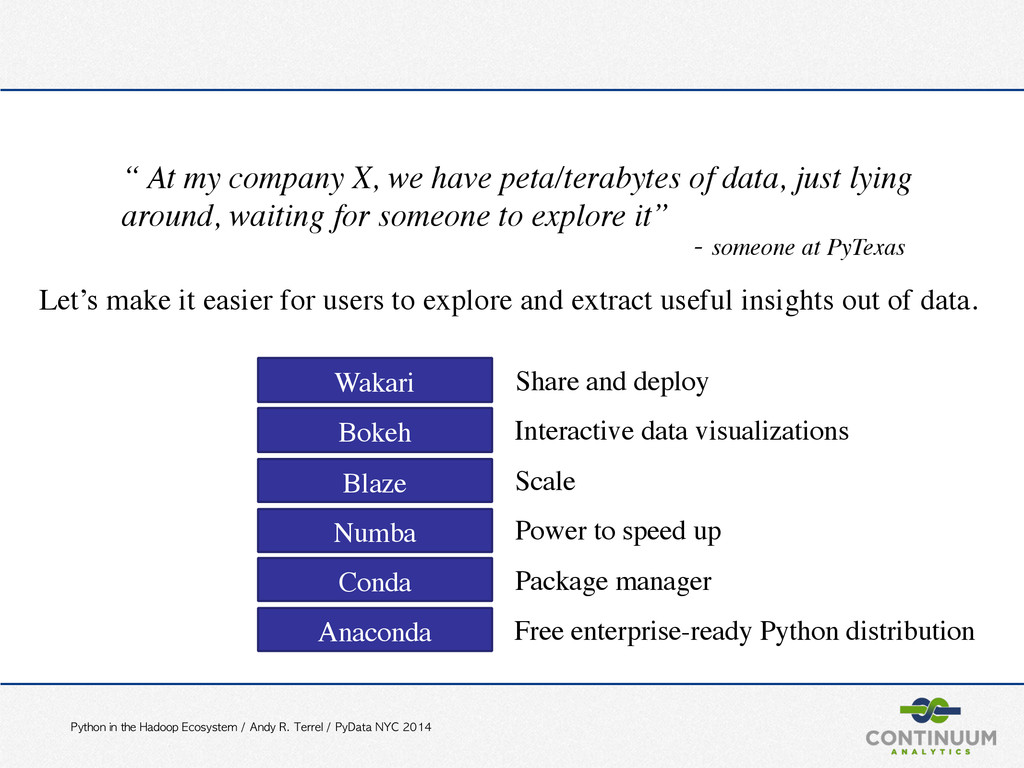
PyData NYC 2014 “ At my company X, we have peta/terabytes of data, just lying around, waiting for someone to explore it” - someone at PyTexas Let’s make it easier for users to explore and extract useful insights out of data. Package manager Free enterprise-ready Python distribution Anaconda Conda Blaze Bokeh Numba Wakari Power to speed up Share and deploy Interactive data visualizations Scale
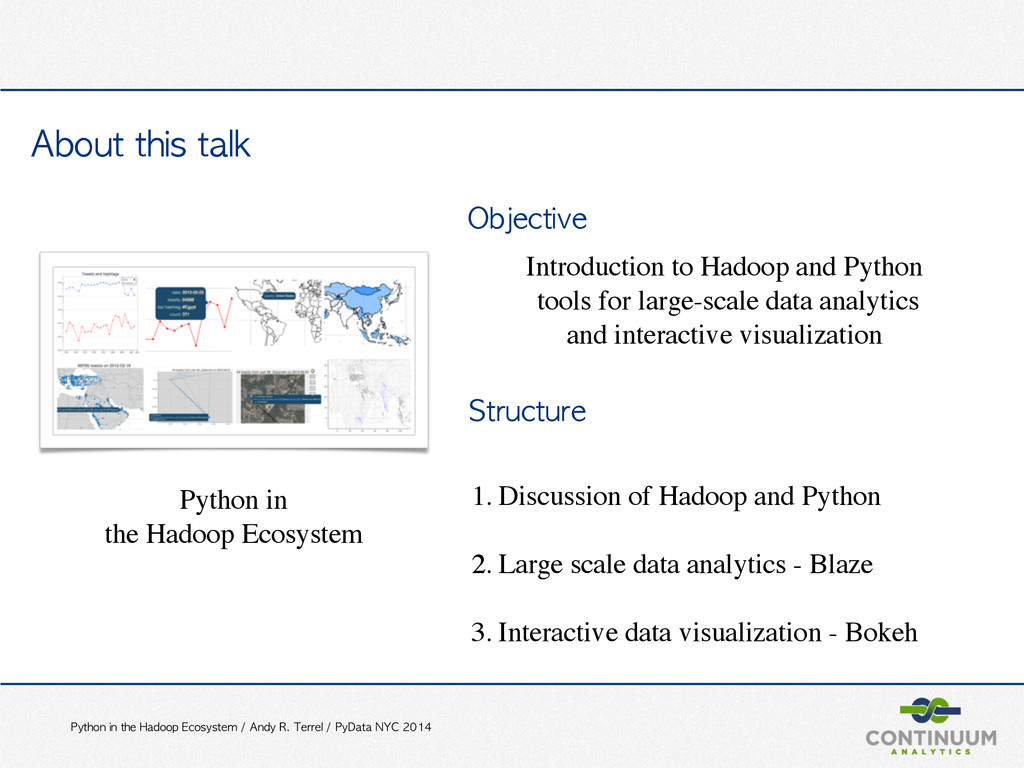
PyData NYC 2014 About this talk Python in the Hadoop Ecosystem 1. Discussion of Hadoop and Python 2. Large scale data analytics - Blaze 3. Interactive data visualization - Bokeh Introduction to Hadoop and Python tools for large-scale data analytics and interactive visualization Objective Structure
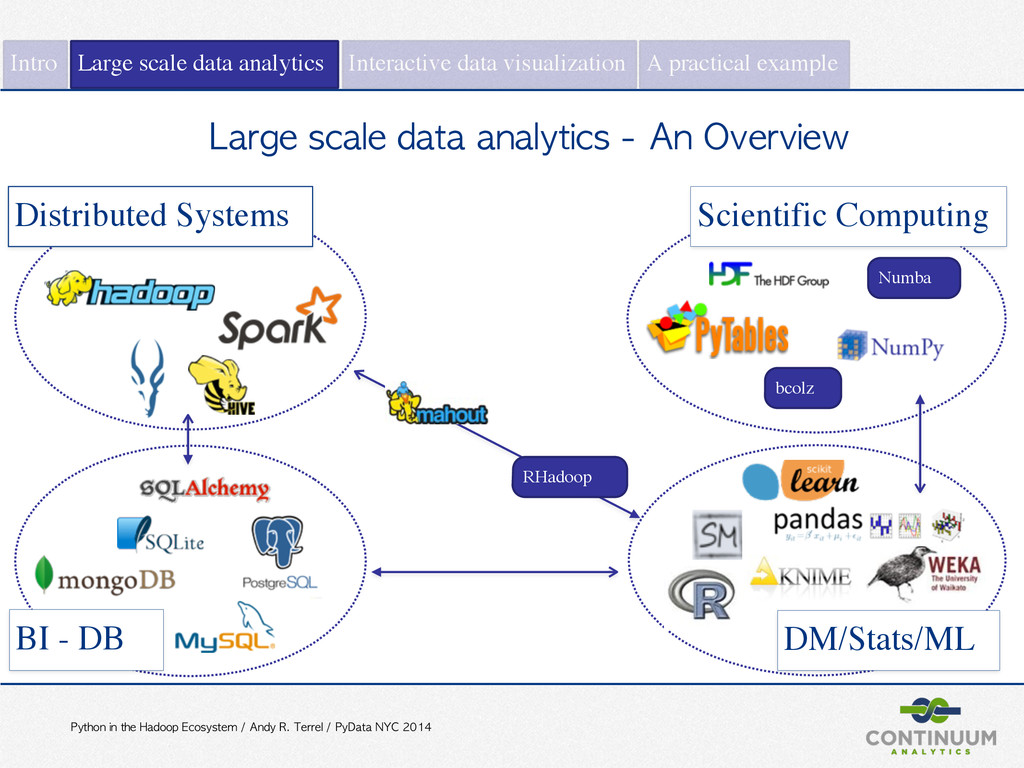
PyData NYC 2014 Intro Large scale data analytics Interactive data visualization A practical example Large scale data analytics - An Overview BI - DB DM/Stats/ML Scientific Computing Distributed Systems Numba bcolz RHadoop
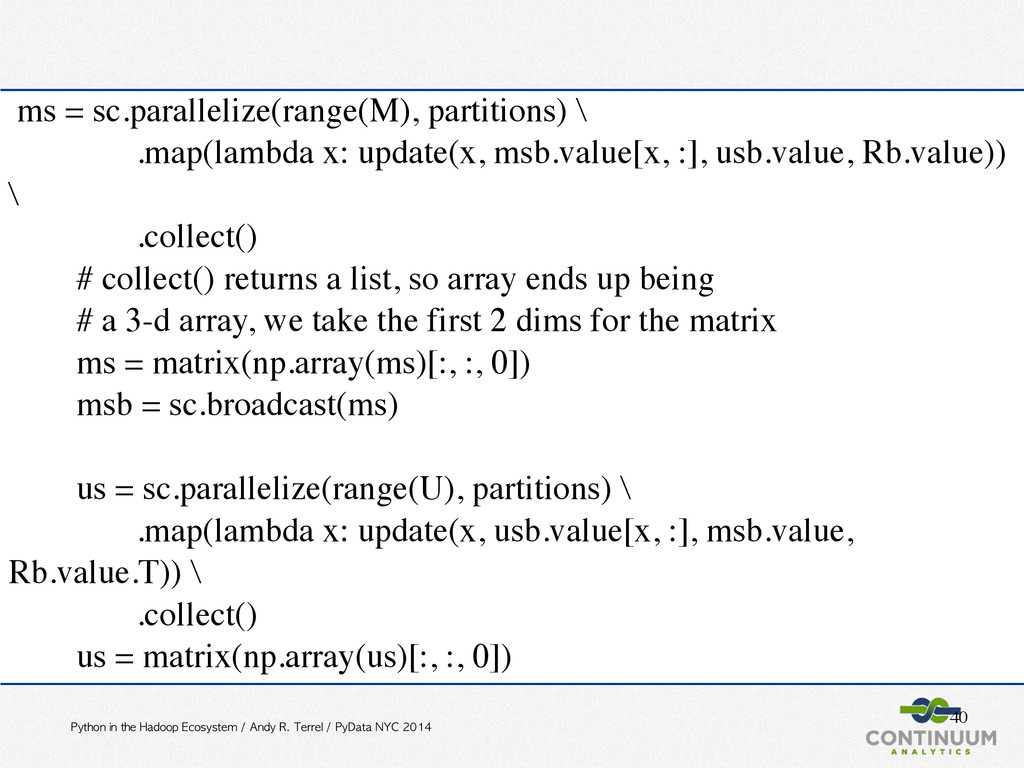
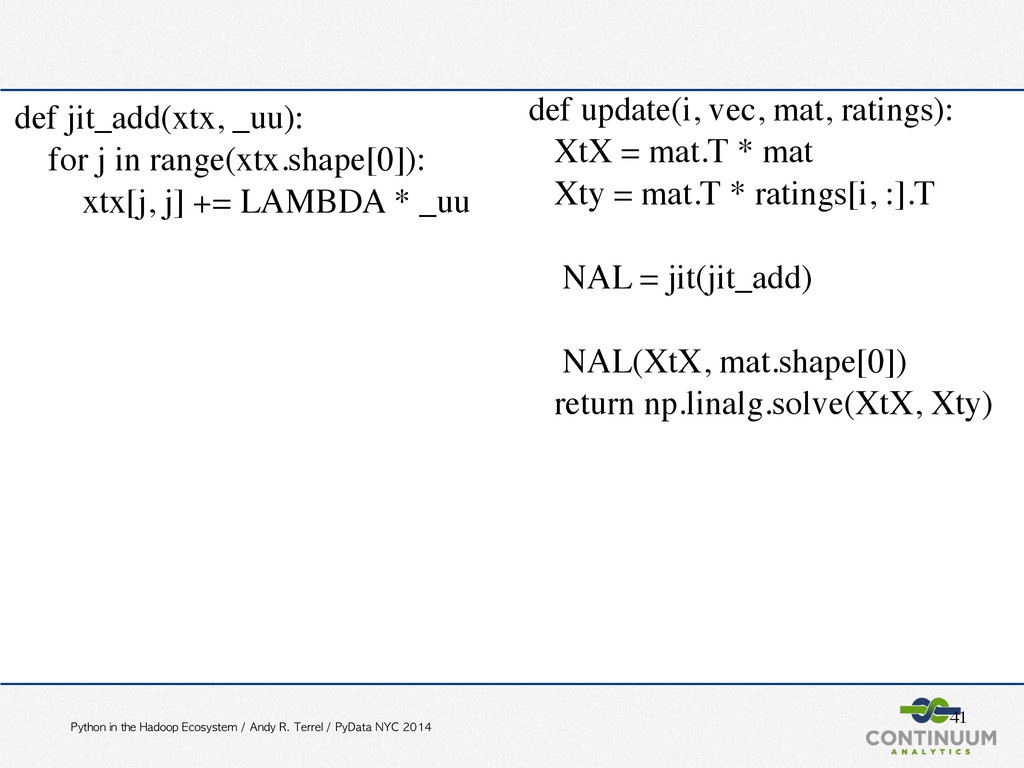
PyData NYC 2014 40 ms = sc.parallelize(range(M), partitions) \ .map(lambda x: update(x, msb.value[x, :], usb.value, Rb.value)) \ .collect() # collect() returns a list, so array ends up being # a 3-d array, we take the first 2 dims for the matrix ms = matrix(np.array(ms)[:, :, 0]) msb = sc.broadcast(ms) us = sc.parallelize(range(U), partitions) \ .map(lambda x: update(x, usb.value[x, :], msb.value, Rb.value.T)) \ .collect() us = matrix(np.array(us)[:, :, 0])
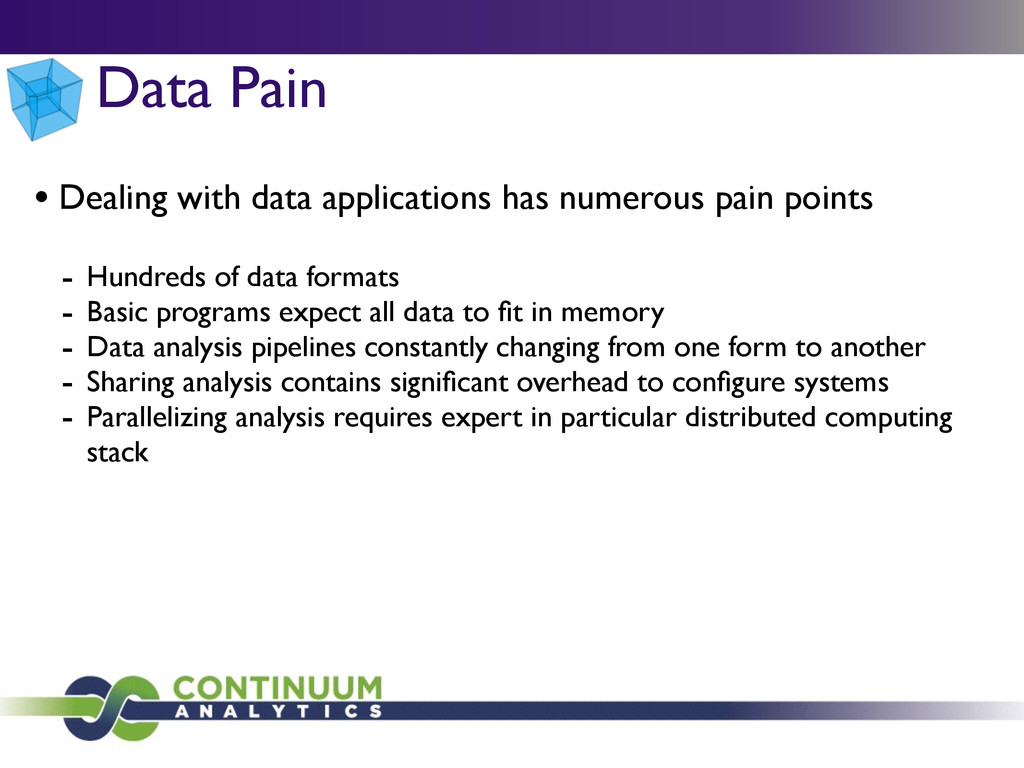
Hundreds of data formats - Basic programs expect all data to fit in memory - Data analysis pipelines constantly changing from one form to another - Sharing analysis contains significant overhead to configure systems - Parallelizing analysis requires expert in particular distributed computing stack Data Pain
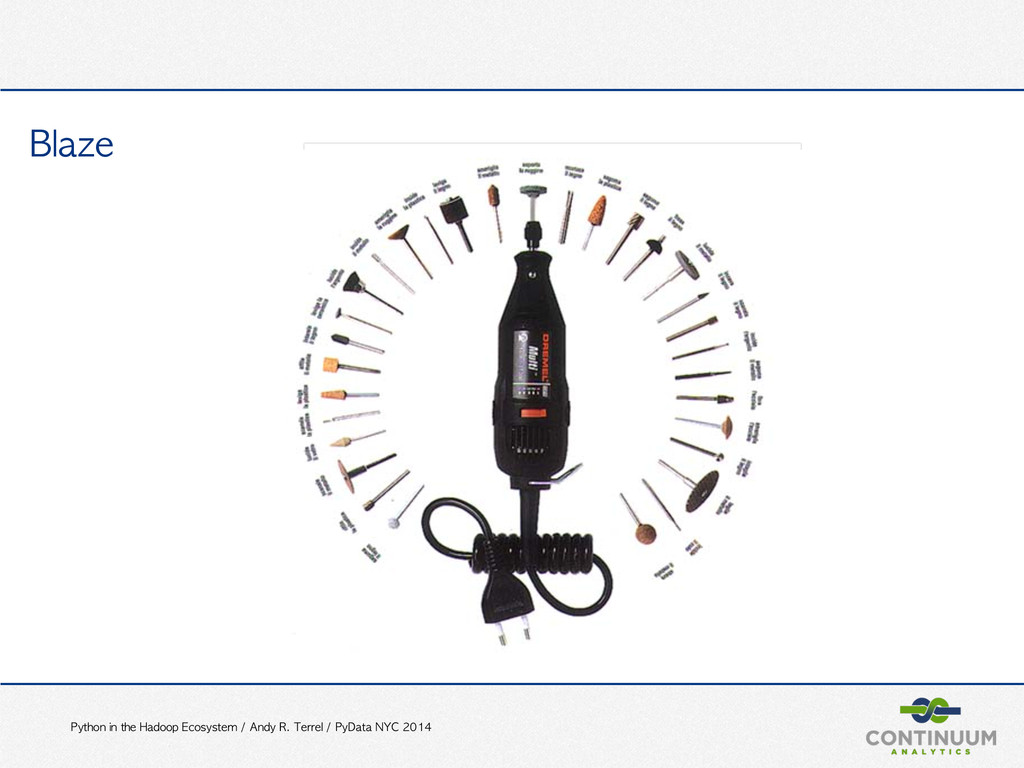
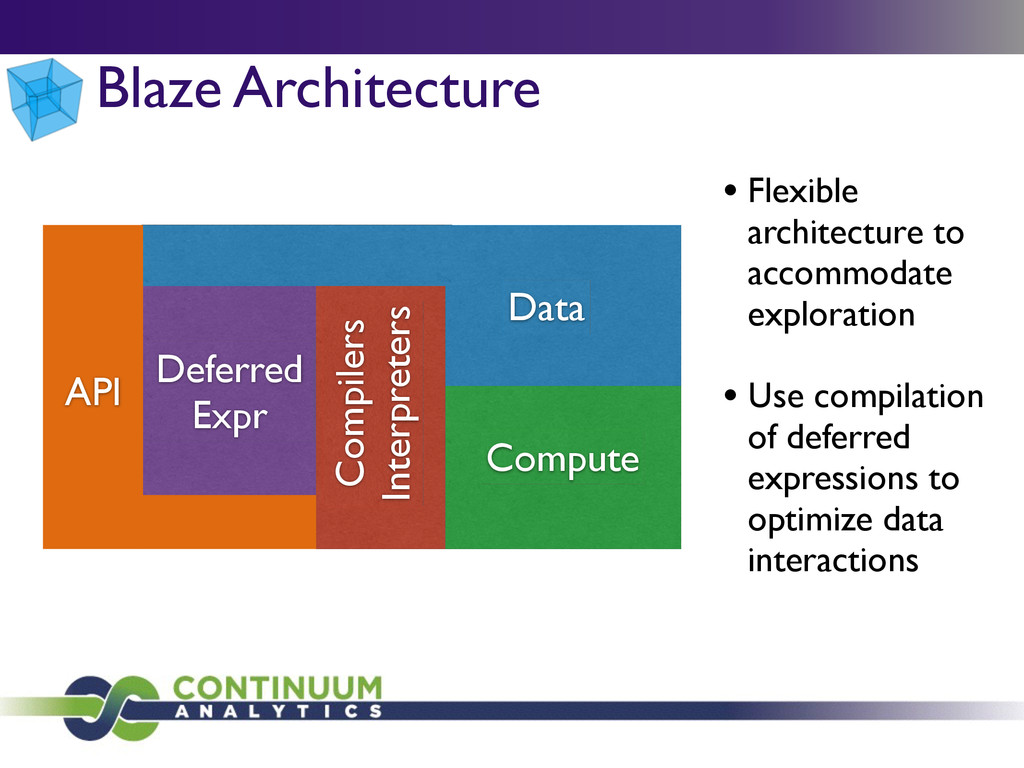
PyData NYC 2014 Distributed Systems Scientific Computing BI - DB DM/Stats/ML Blaze bcolz Connecting technologies to users Connecting technologies to each other Blaze hdf5
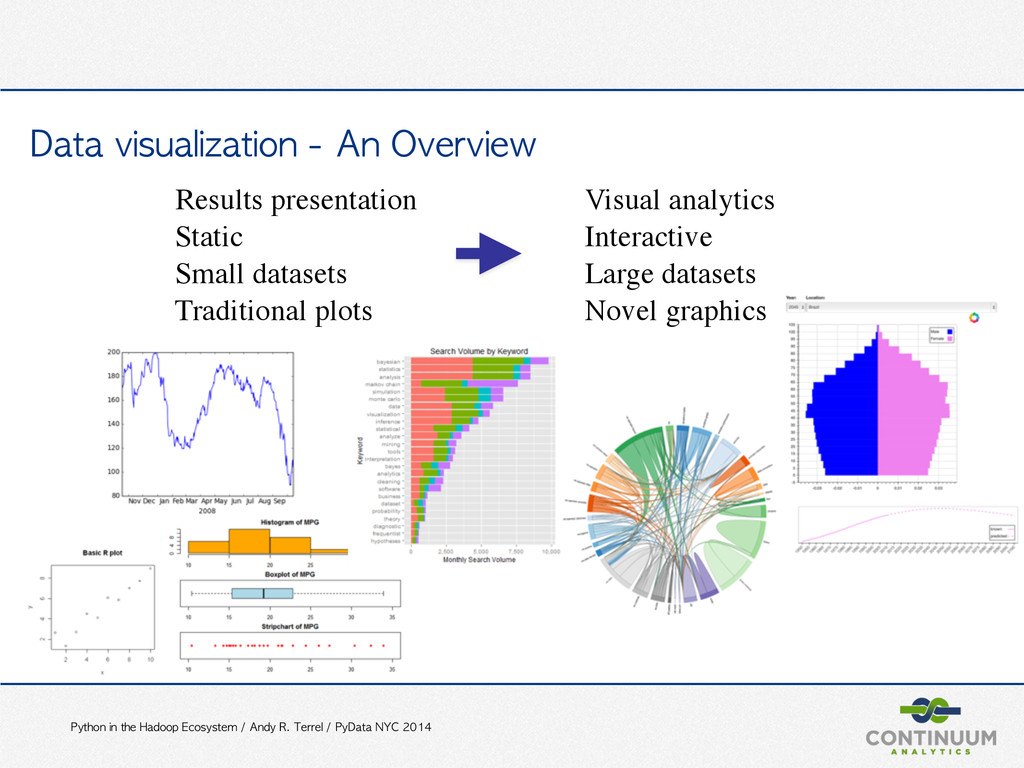
PyData NYC 2014 Data visualization - An Overview Results presentation Visual analytics Static Interactive Small datasets Large datasets Traditional plots Novel graphics
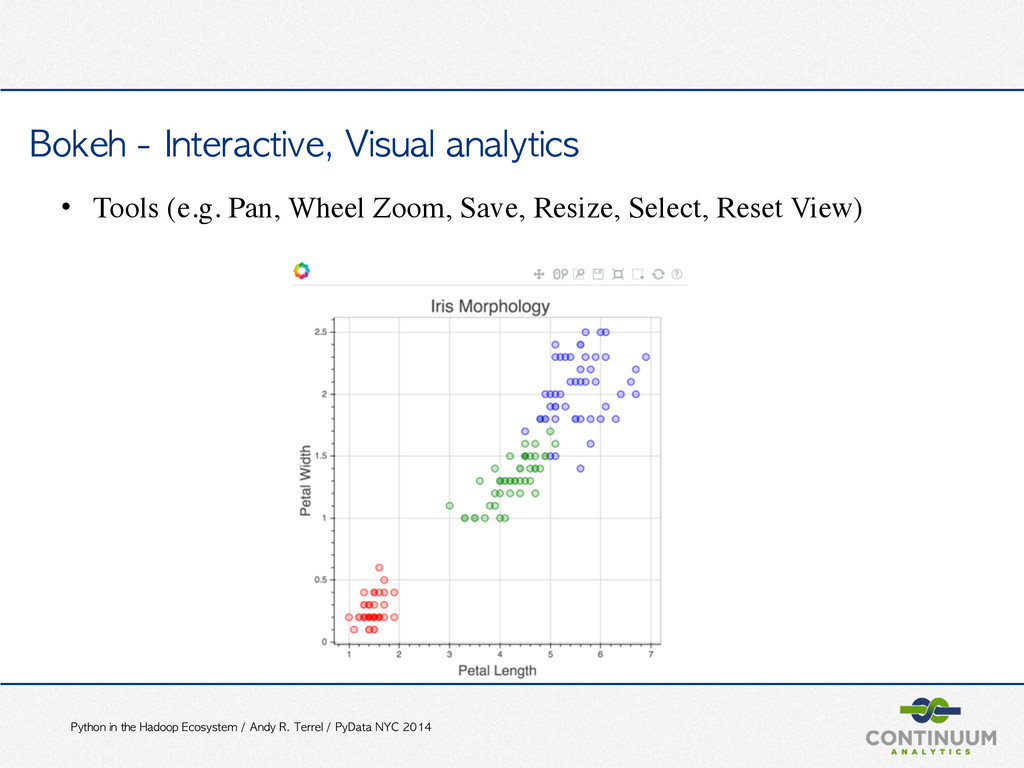
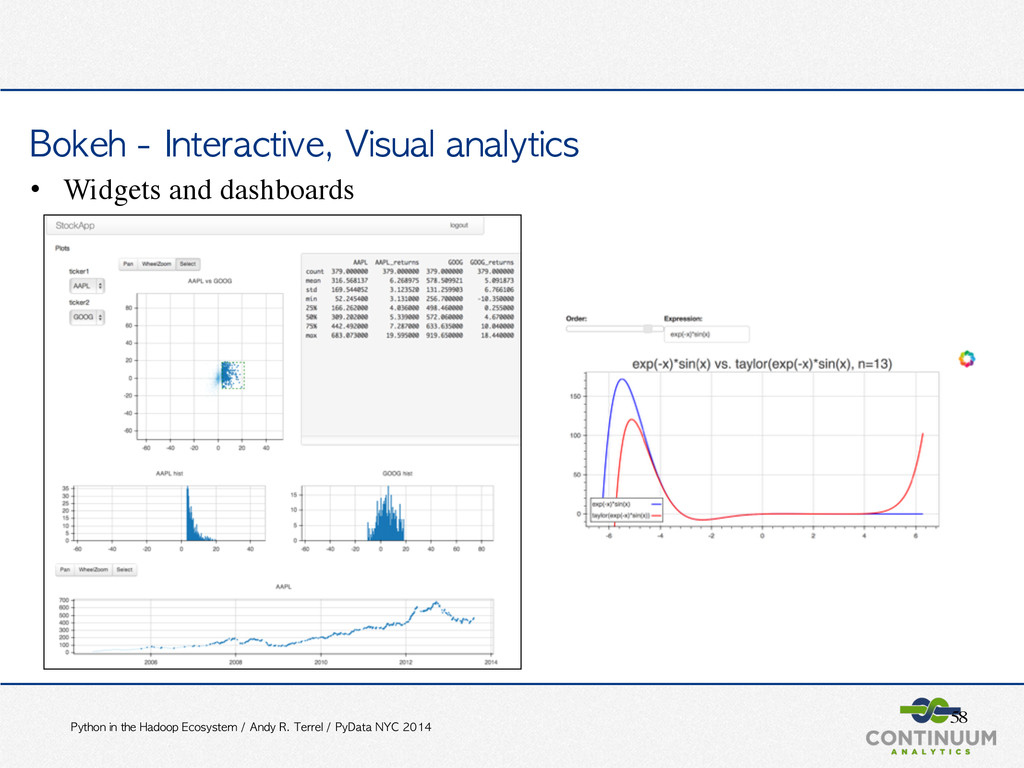
PyData NYC 2014 Bokeh • Interactive visualization • Novel graphics • Streaming, dynamic, large data • For the browser, with or without a server • Matplotlib compatibility • No need to write Javascript http://bokeh.pydata.org/ https://github.com/ContinuumIO/bokeh