NYC 2014 About Continuum Analytics Intro Large scale data analytics Interactive data visualization A practical example http://continuum.io/ ! ! We build technologies that enable analysts and data scientist to answer questions from the data all around us. Committed to Open Source Areas of Focus • Software solutions • Consulting • Training • Anaconda: Free Python distribution • Numba, Conda, Blaze, Bokeh, dynd • Sponsor
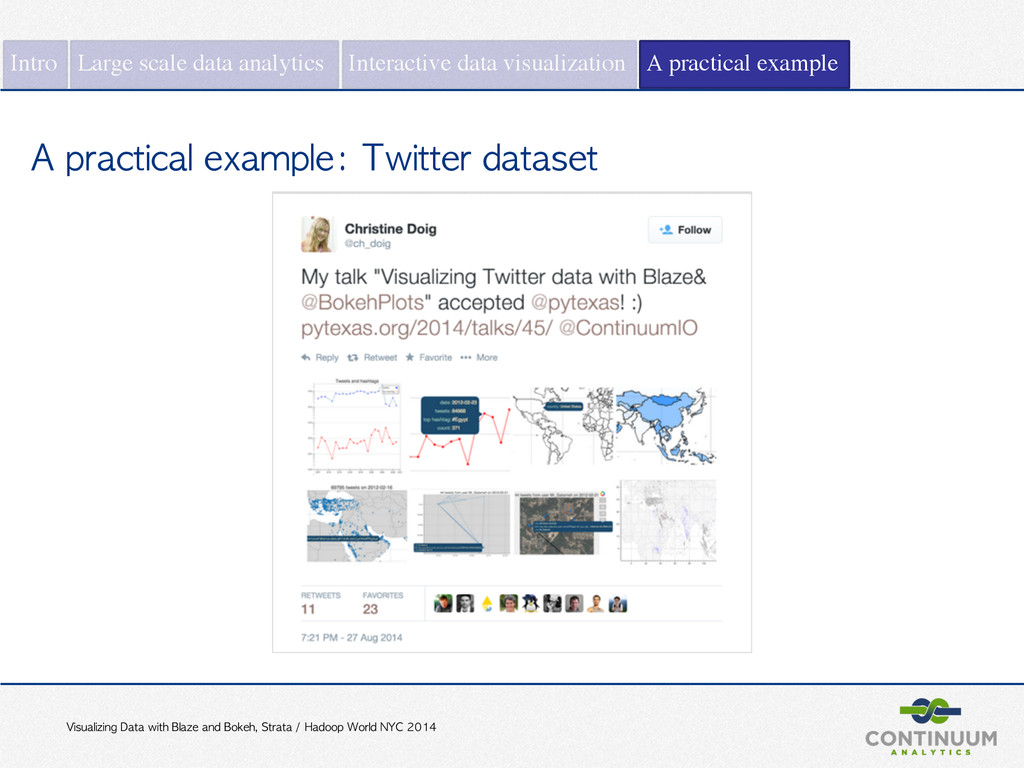
NYC 2014 Intro Large scale data analytics Interactive data visualization A practical example Visualizing Twitter Data with Blaze and Bokeh, Christine Doig, PyTexas 2014 About Andy Andy R. Terrel @aterrel Chief Scientist, Continuum Analytics ! President, NumFOCUS ! Background: • High Performance Computing • Computational Mathematics • President, NumFOCUS foundation ! Experience analyzing diverse datasets: • Finance • Simulations • Web data • Social media !
NYC 2014 Intro Large scale data analytics Interactive data visualization A practical example Visualizing Twitter Data with Blaze and Bokeh, Christine Doig, PyTexas 2014 About Peter Peter Wang @pwang Co-Founder, President Continuum Analytics ! Background: • Graphics • Scientific computing ! Experience: ! • Creator of Chaco and Bokeh • Founder of Streamitive ! ! !
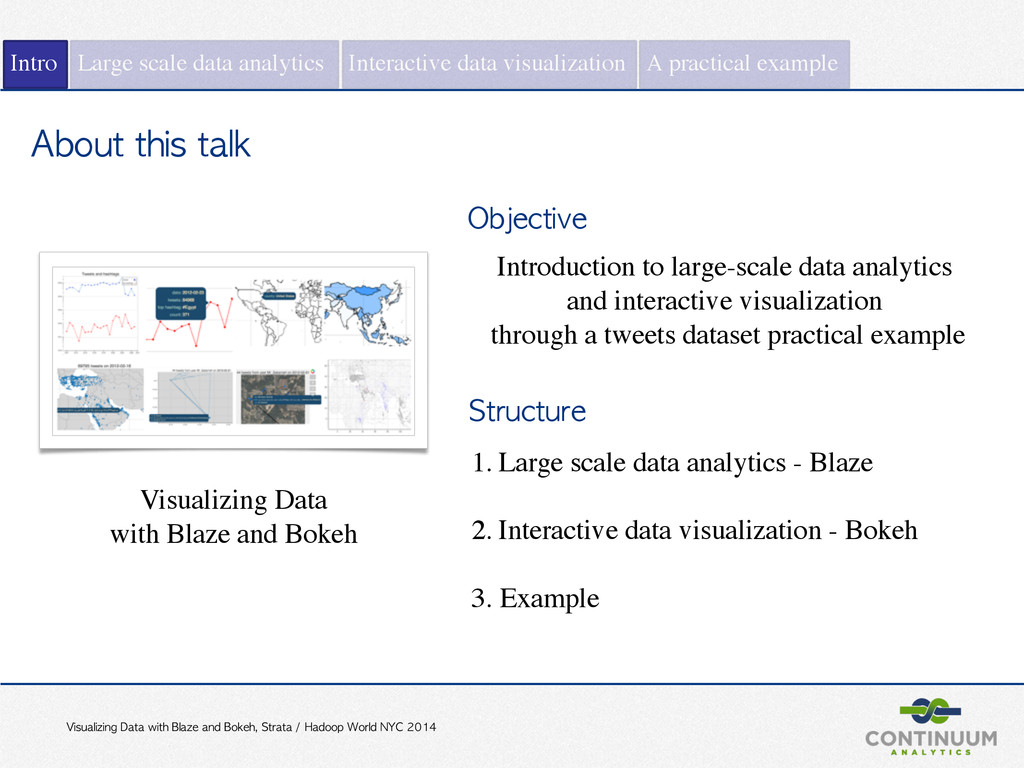
NYC 2014 About this talk Visualizing Data with Blaze and Bokeh 1. Large scale data analytics - Blaze ! 2. Interactive data visualization - Bokeh ! 3. Example Intro Large scale data analytics Interactive data visualization A practical example Introduction to large-scale data analytics and interactive visualization through a tweets dataset practical example Objective Structure
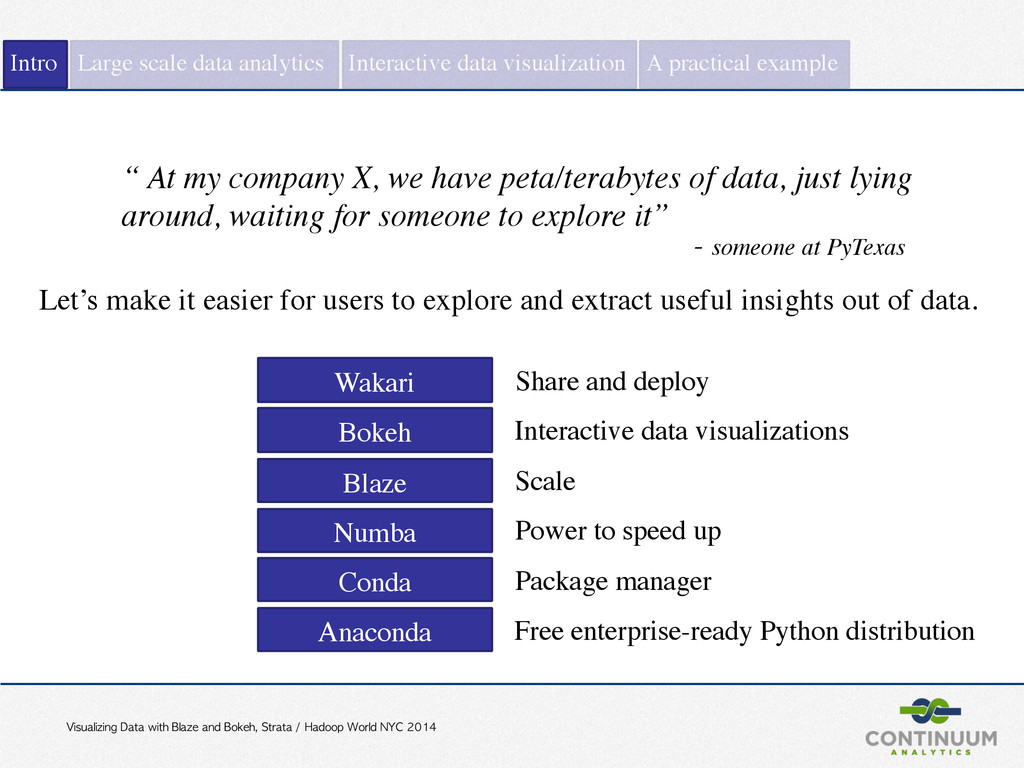
NYC 2014 Intro Large scale data analytics Interactive data visualization A practical example “ At my company X, we have peta/terabytes of data, just lying around, waiting for someone to explore it” - someone at PyTexas Let’s make it easier for users to explore and extract useful insights out of data. Package manager Free enterprise-ready Python distribution Anaconda Conda Blaze Bokeh Numba Wakari Power to speed up Share and deploy Interactive data visualizations Scale
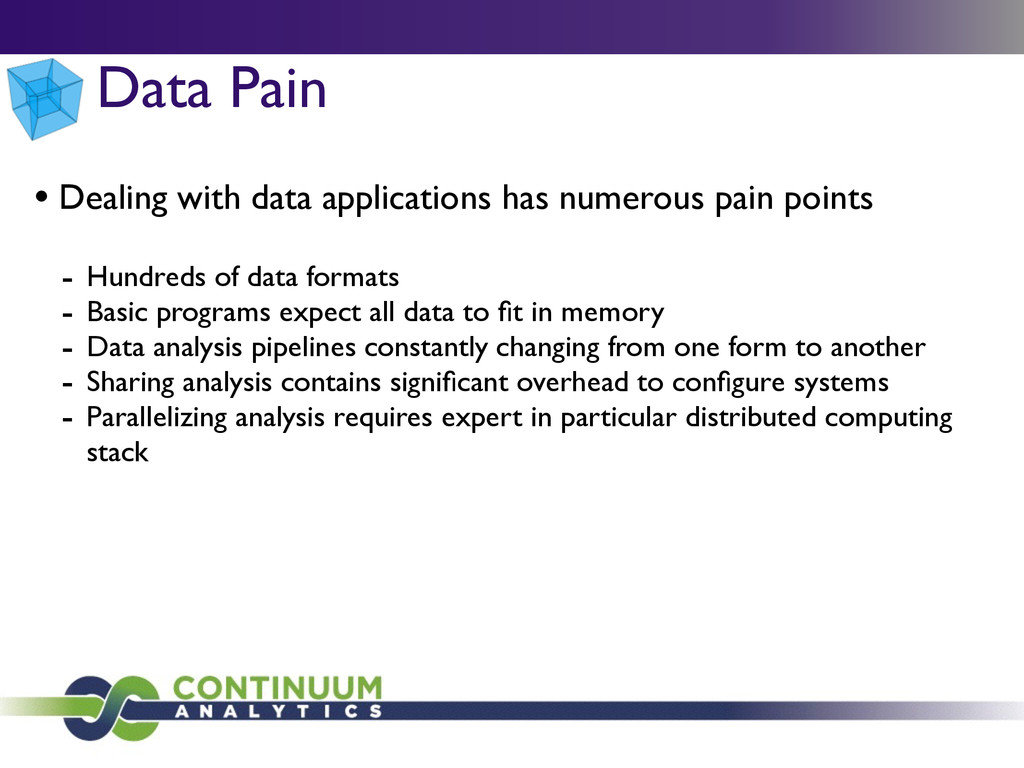
Hundreds of data formats - Basic programs expect all data to fit in memory - Data analysis pipelines constantly changing from one form to another - Sharing analysis contains significant overhead to configure systems - Parallelizing analysis requires expert in particular distributed computing stack Data Pain
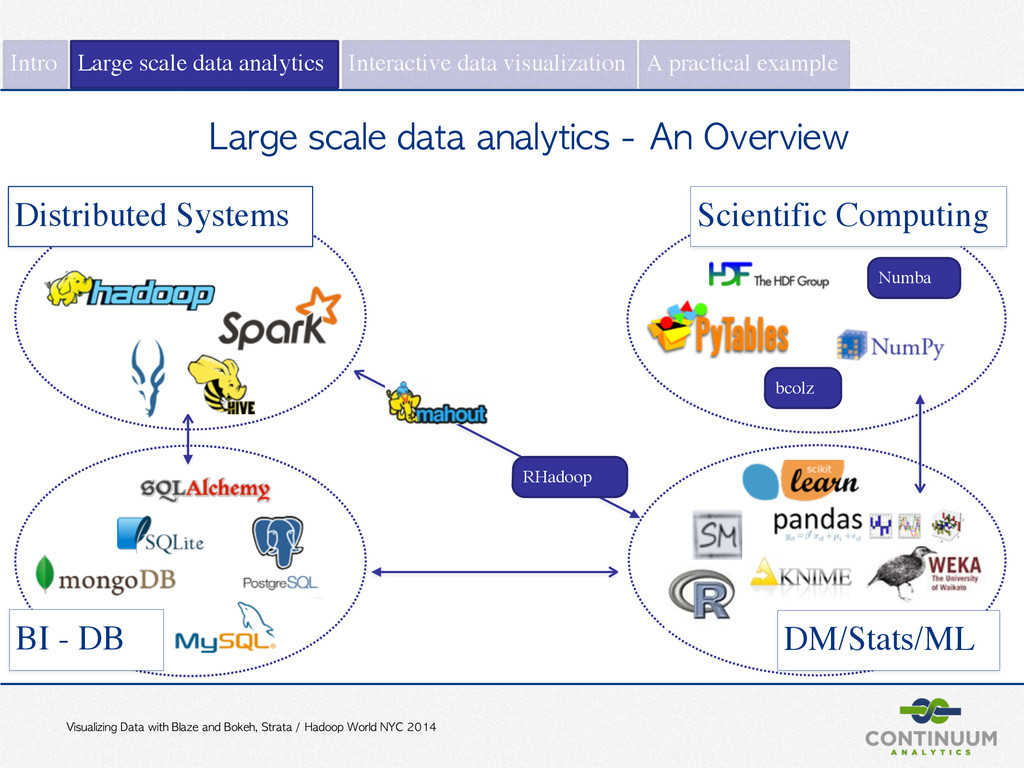
NYC 2014 Intro Large scale data analytics Interactive data visualization A practical example Large scale data analytics - An Overview BI - DB DM/Stats/ML Scientific Computing Distributed Systems Numba bcolz RHadoop
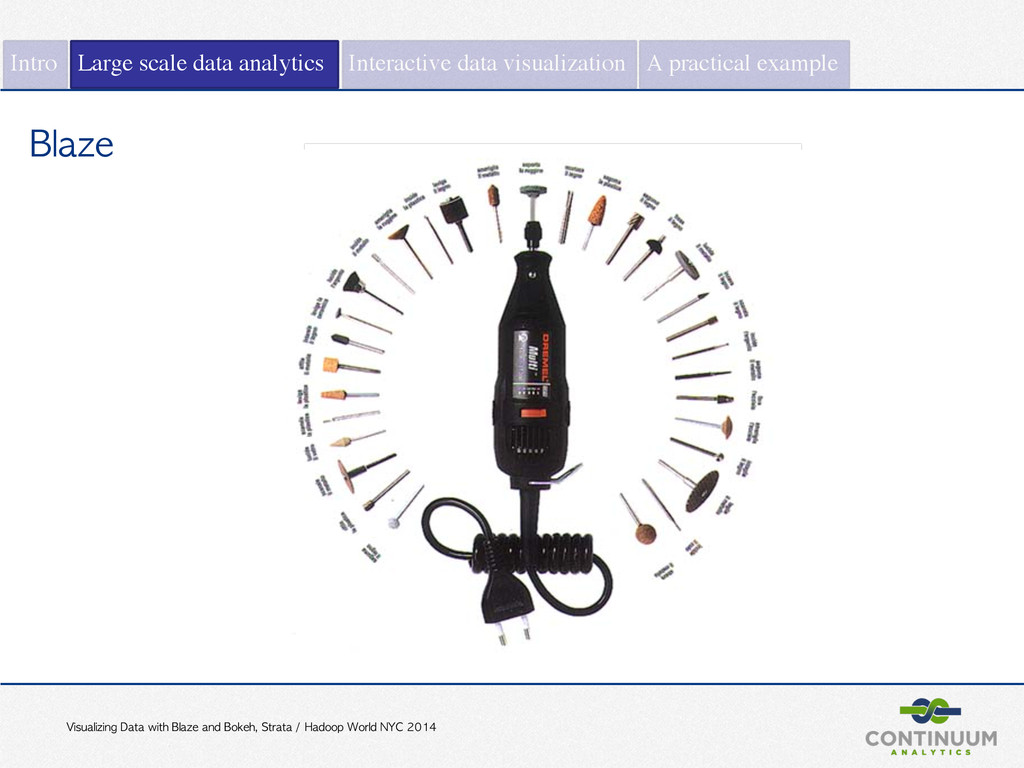
NYC 2014 Intro Large scale data analytics Interactive data visualization A practical example Blaze Source: http://worrydream.com/ABriefRantOnTheFutureOfInteractionDesign/
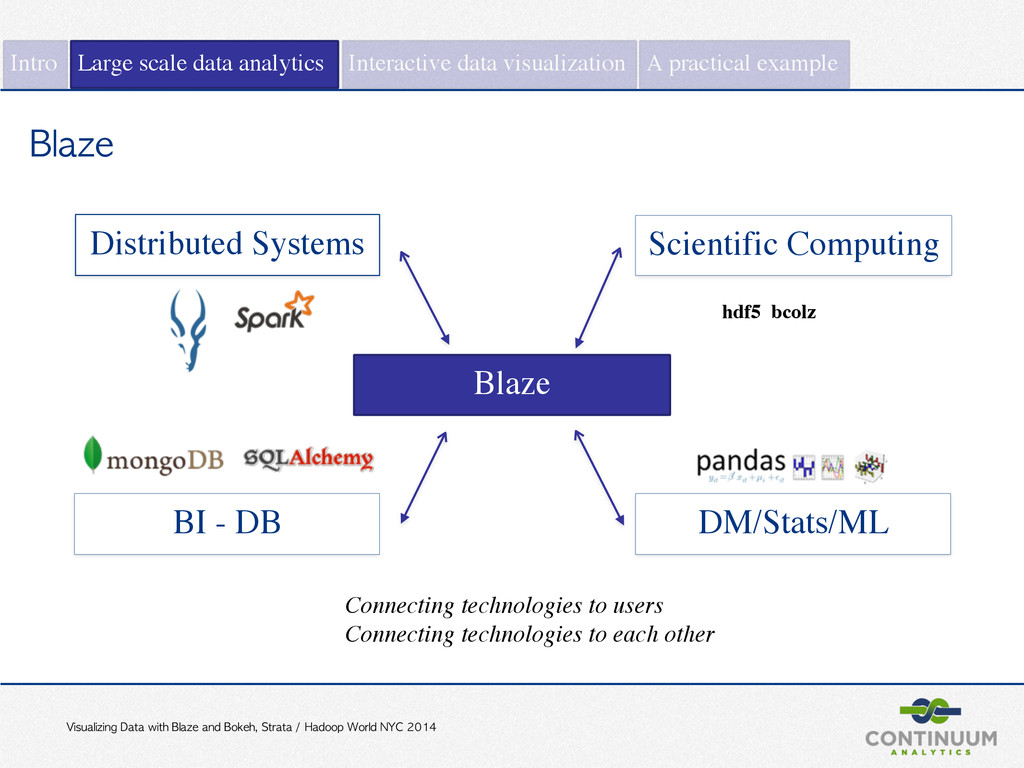
NYC 2014 Intro Large scale data analytics Interactive data visualization A practical example Distributed Systems Scientific Computing BI - DB DM/Stats/ML Blaze bcolz Connecting technologies to users Connecting technologies to each other Blaze hdf5
NYC 2014 Data Storage Abstract expressions Computational backend csv HDF5 bcolz DataFrame Intro Large scale data analytics Interactive data visualization A practical example HDFS selection filter group by join column wise Pandas Streaming Python Spark MongoDB SQLAlchemy json Blaze
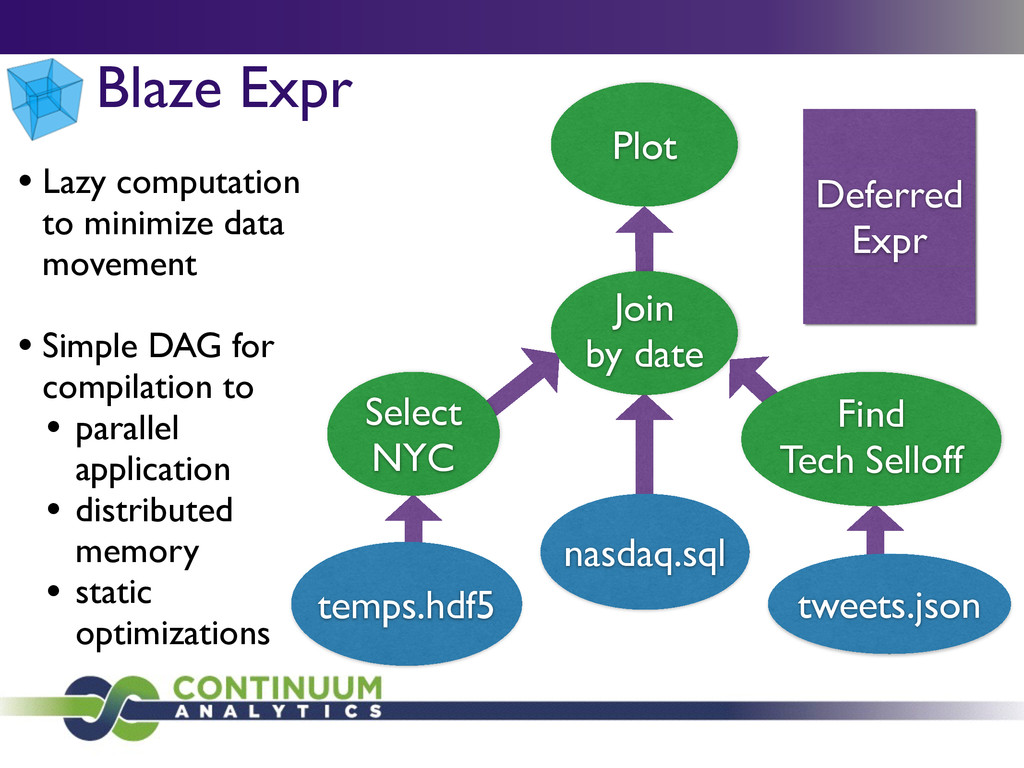
Select NYC Find Tech Selloff Plot • Lazy computation to minimize data movement • Simple DAG for compilation to • parallel application • distributed memory • static optimizations
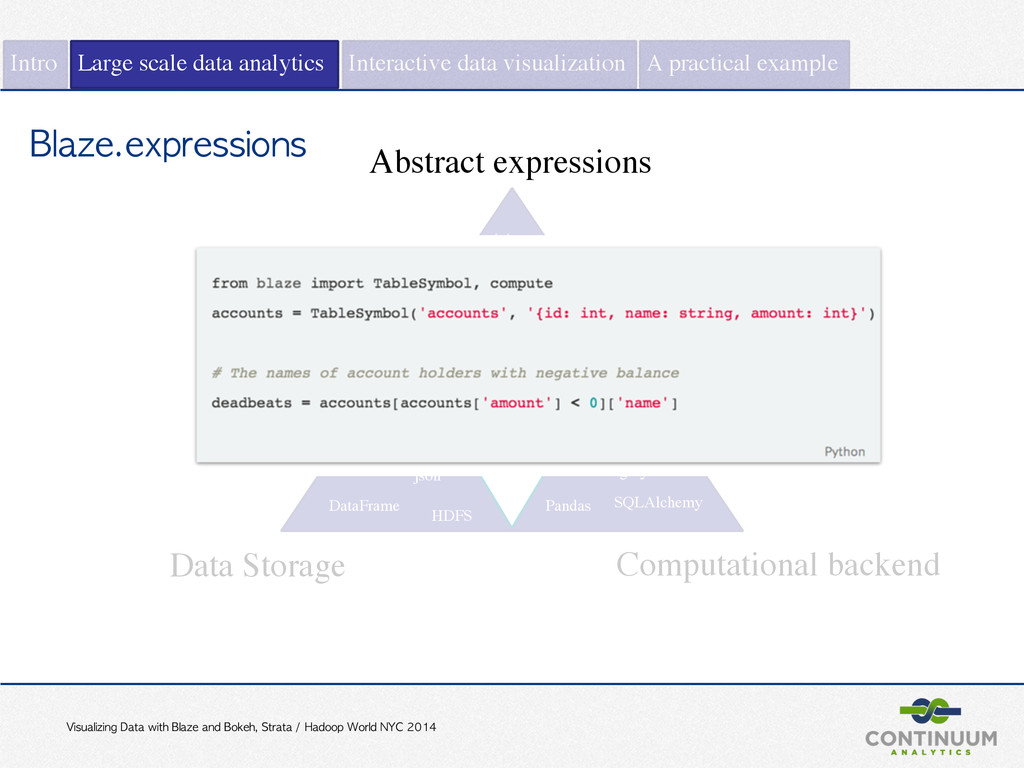
NYC 2014 Intro Large scale data analytics Interactive data visualization A practical example Data Storage Abstract expressions Computational backend csv HDF5 bcolz DataFrame HDFS selection filter group by join column wise Pandas Streaming Python Spark MongoDB SQLAlchemy json Blaze.expressions
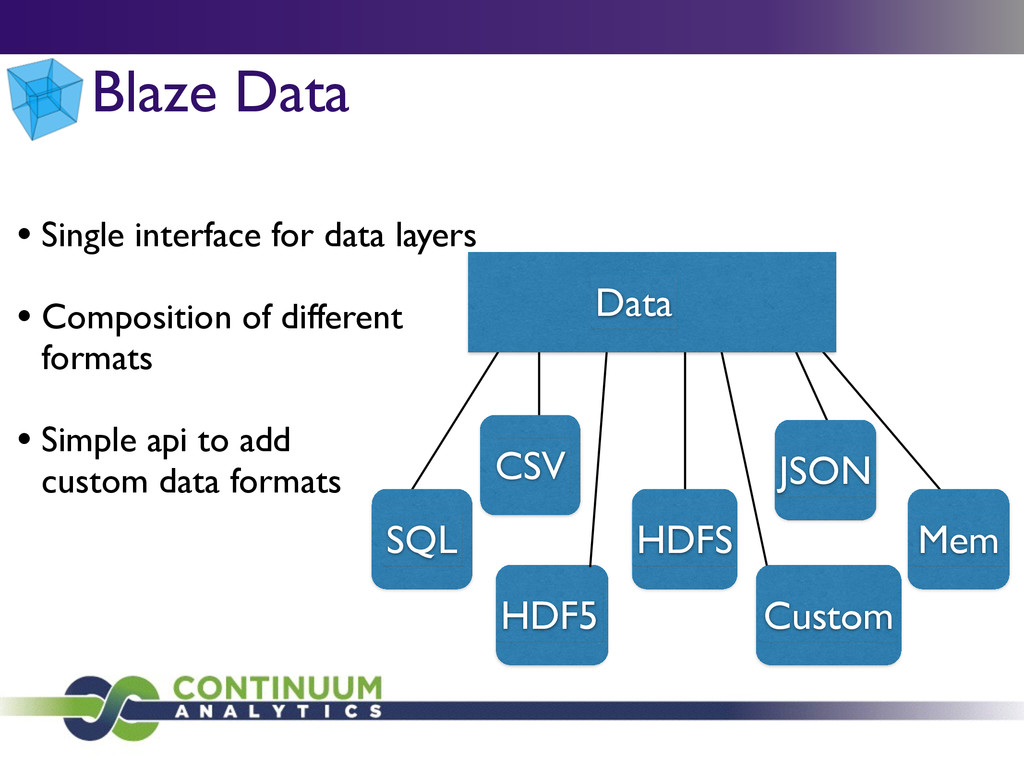
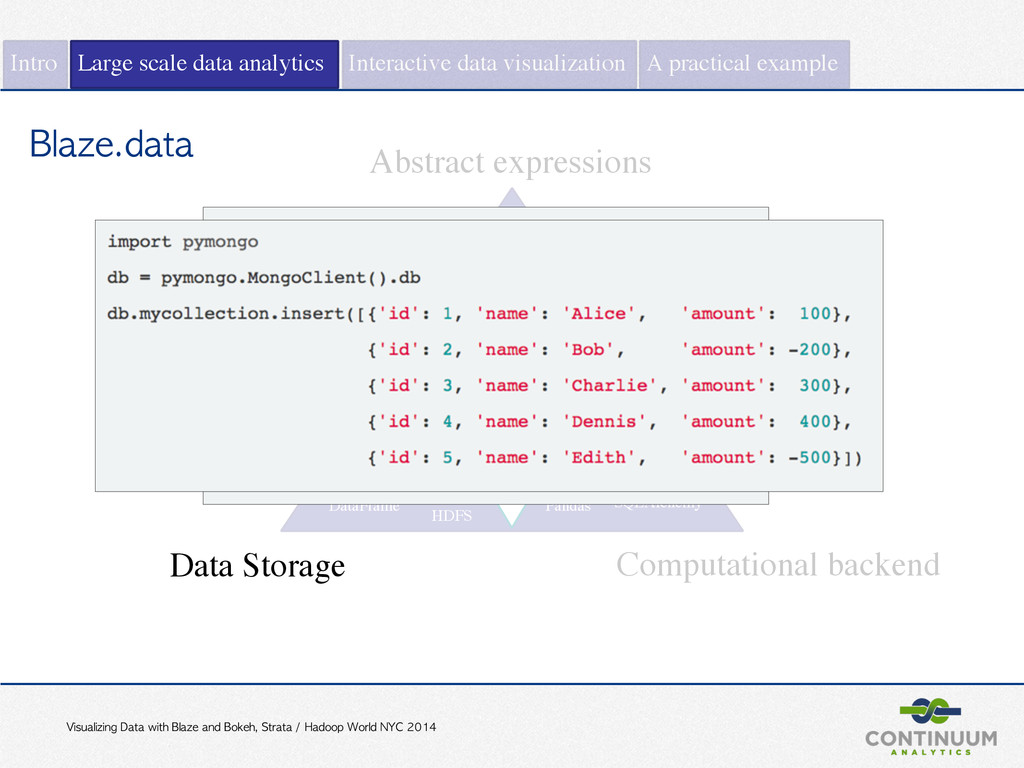
NYC 2014 Intro Large scale data analytics Interactive data visualization A practical example Data Storage Abstract expressions Computational backend csv HDF5 bcolz DataFrame HDFS selection filter group by join column wise Pandas Streaming Python Spark MongoDB SQLAlchemy json Blaze.data
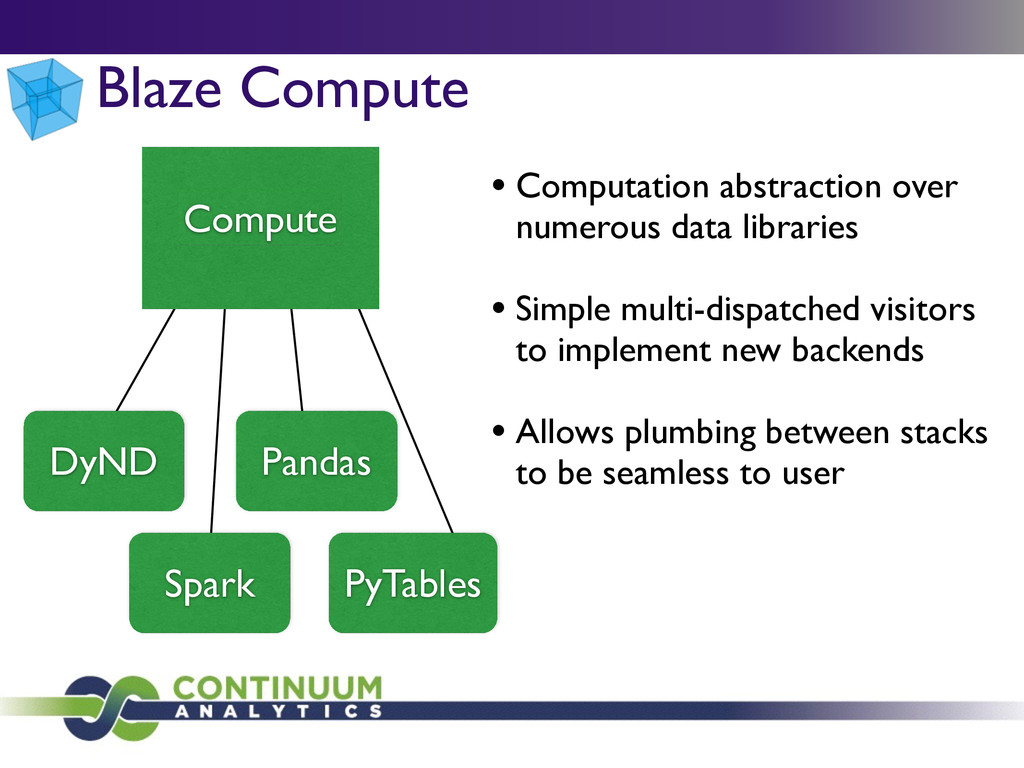
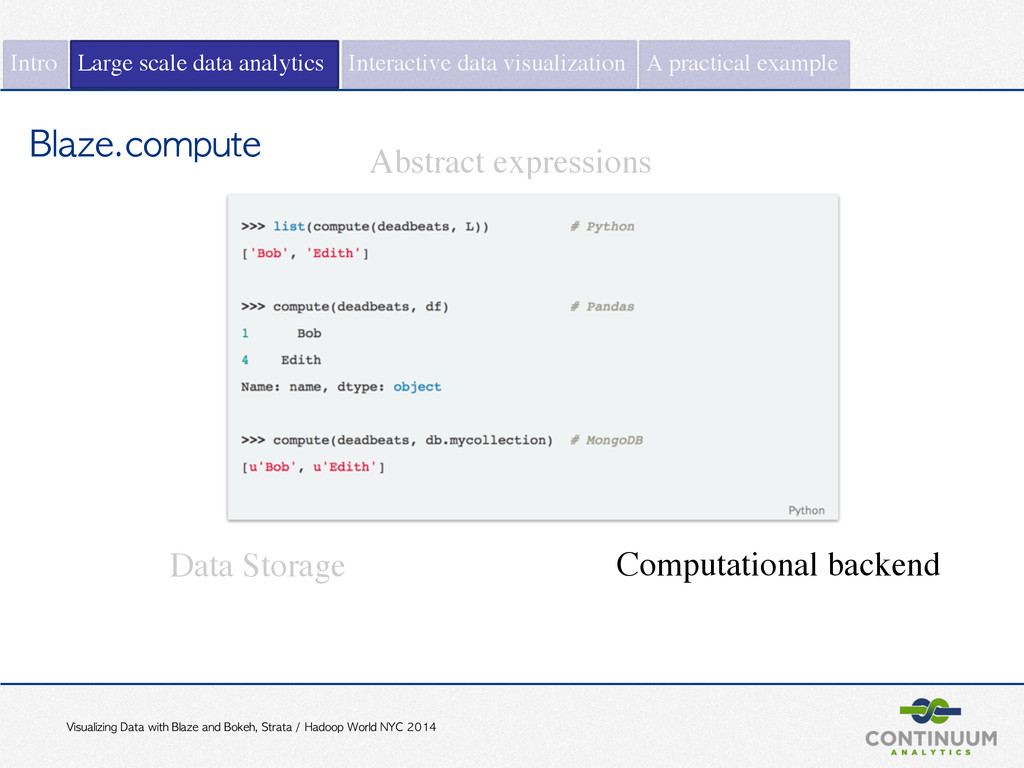
NYC 2014 Intro Large scale data analytics Interactive data visualization A practical example Data Storage Abstract expressions Computational backend csv HDF5 bcolz DataFrame HDFS selection filter group by join column wise Pandas Streaming Python Spark MongoDB SQLAlchemy json Blaze.compute
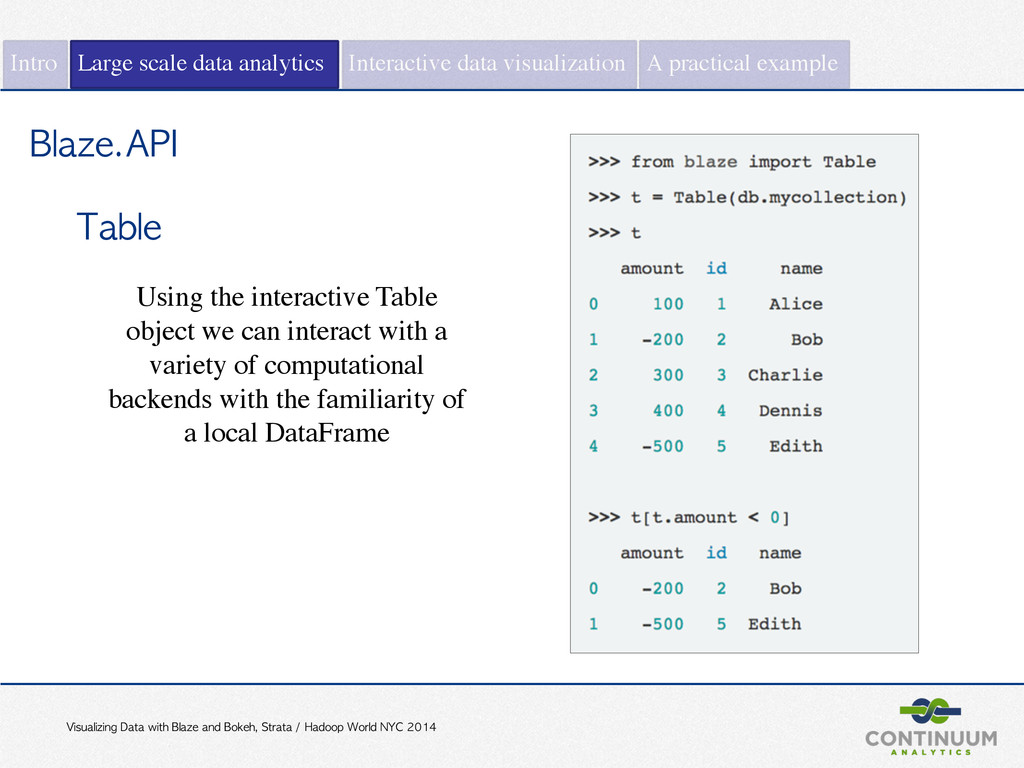
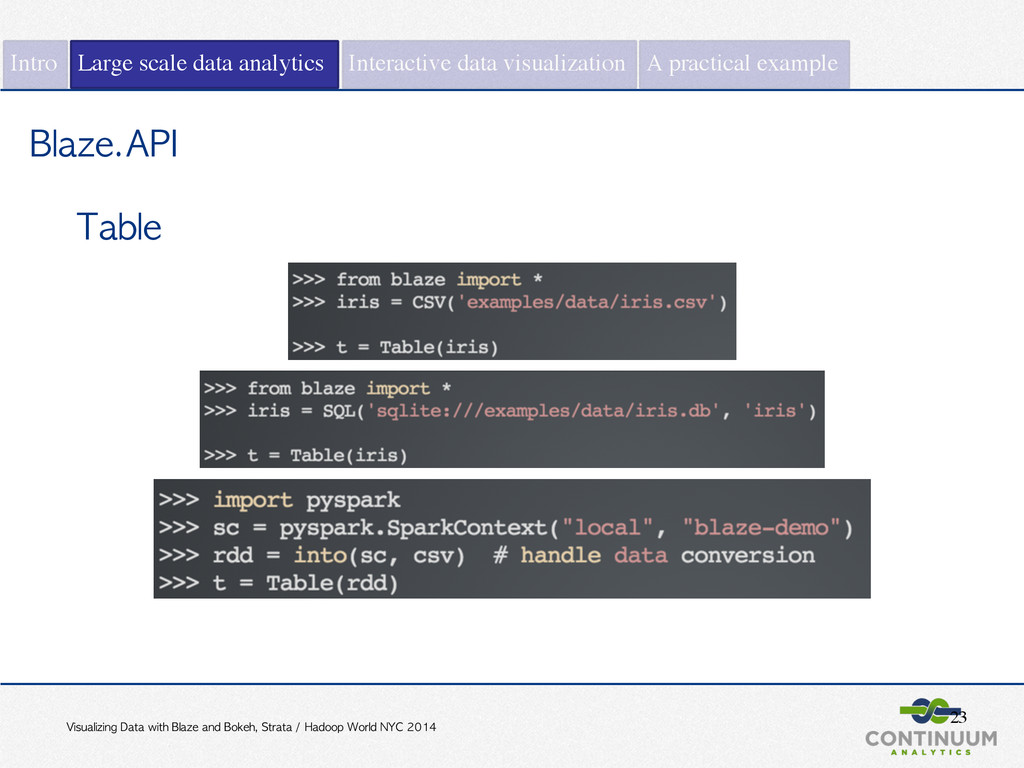
NYC 2014 Intro Large scale data analytics Interactive data visualization A practical example Blaze.API Table Using the interactive Table object we can interact with a variety of computational backends with the familiarity of a local DataFrame
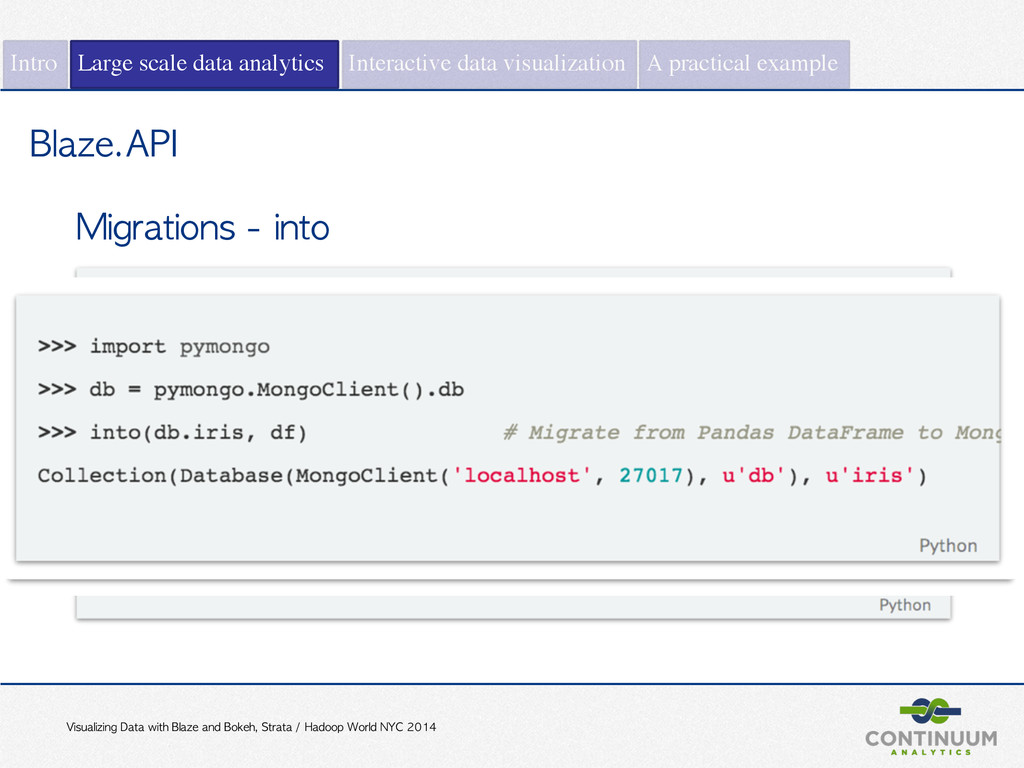
NYC 2014 Intro Large scale data analytics Interactive data visualization A practical example Blaze.API Migrations - into the into function makes it easy to moves data from one container type to another
NYC 2014 Intro Large scale data analytics Interactive data visualization A practical example Why I like using Blaze? ! - Syntax is very similar to Pandas - Easy to scale - Easy to find best computational backend to a particular dataset - Easy to adapt my code if someone handles me a dataset in a different format/ backend
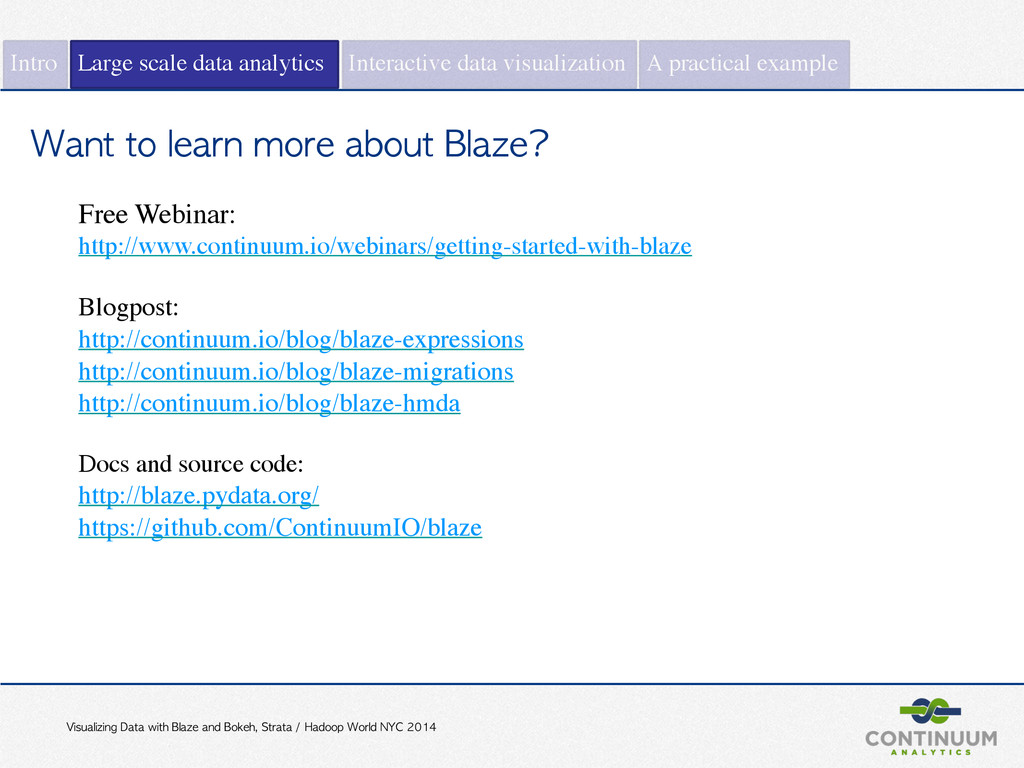
NYC 2014 Intro Large scale data analytics Interactive data visualization A practical example Want to learn more about Blaze? Free Webinar: http://www.continuum.io/webinars/getting-started-with-blaze ! Blogpost: http://continuum.io/blog/blaze-expressions http://continuum.io/blog/blaze-migrations http://continuum.io/blog/blaze-hmda ! Docs and source code: http://blaze.pydata.org/ https://github.com/ContinuumIO/blaze
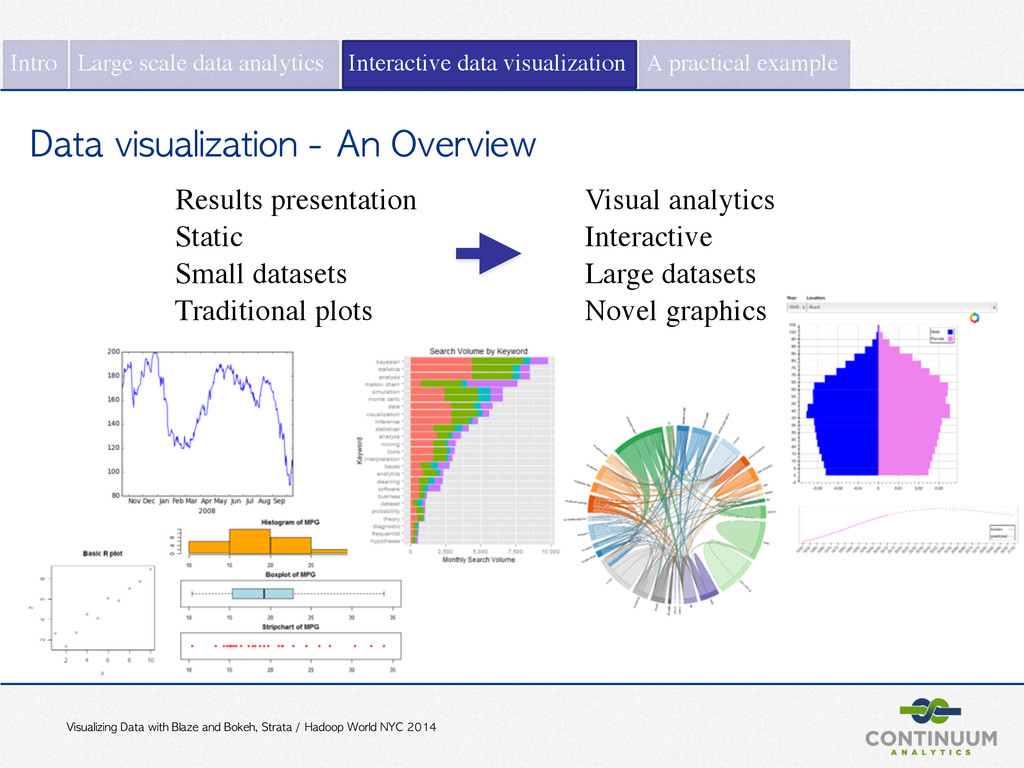
NYC 2014 Intro Large scale data analytics Interactive data visualization A practical example Data visualization - An Overview Results presentation Visual analytics Static Interactive Small datasets Large datasets Traditional plots Novel graphics
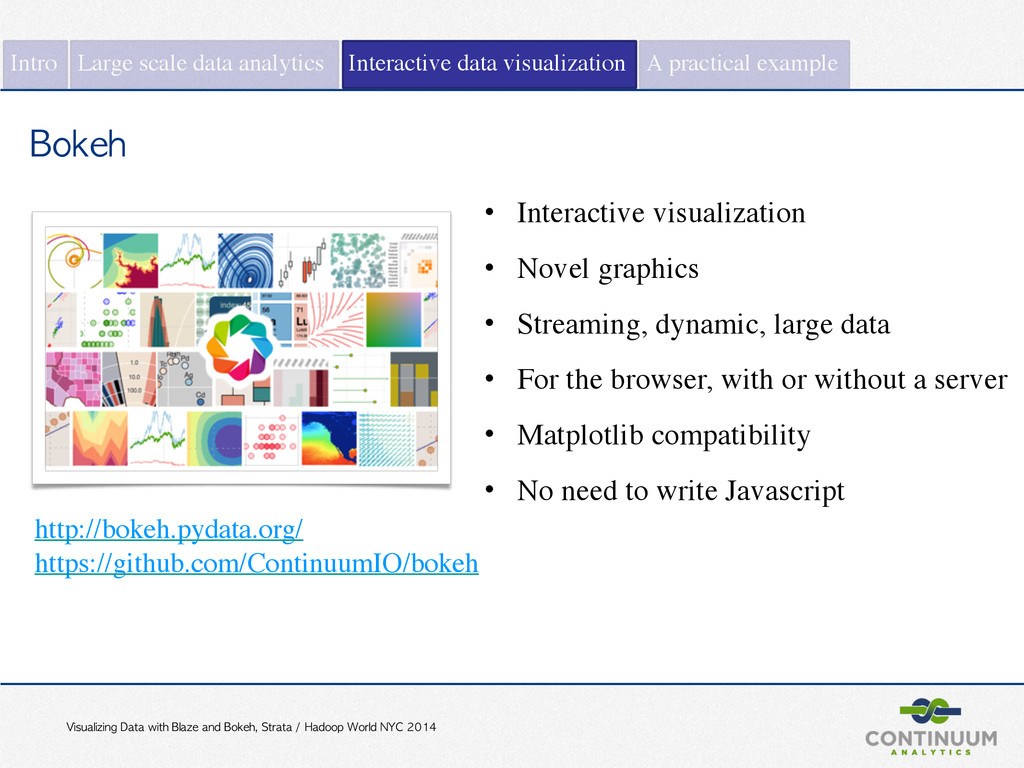
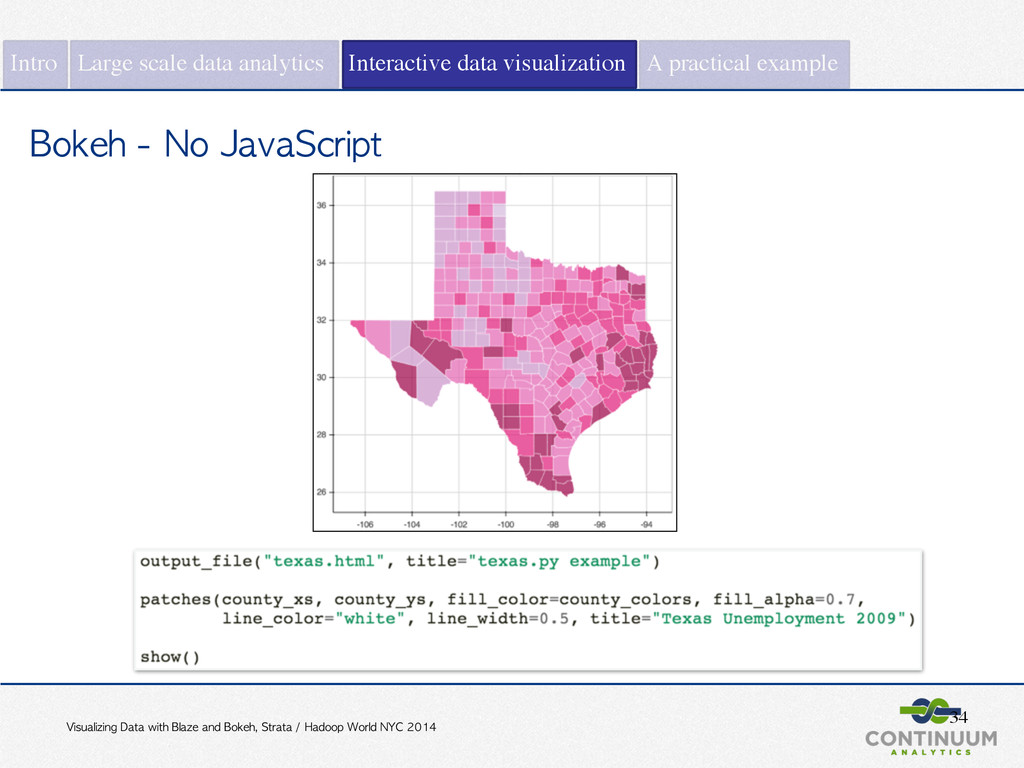
NYC 2014 Intro Large scale data analytics Interactive data visualization A practical example Bokeh • Interactive visualization • Novel graphics • Streaming, dynamic, large data • For the browser, with or without a server • Matplotlib compatibility • No need to write Javascript http://bokeh.pydata.org/ https://github.com/ContinuumIO/bokeh
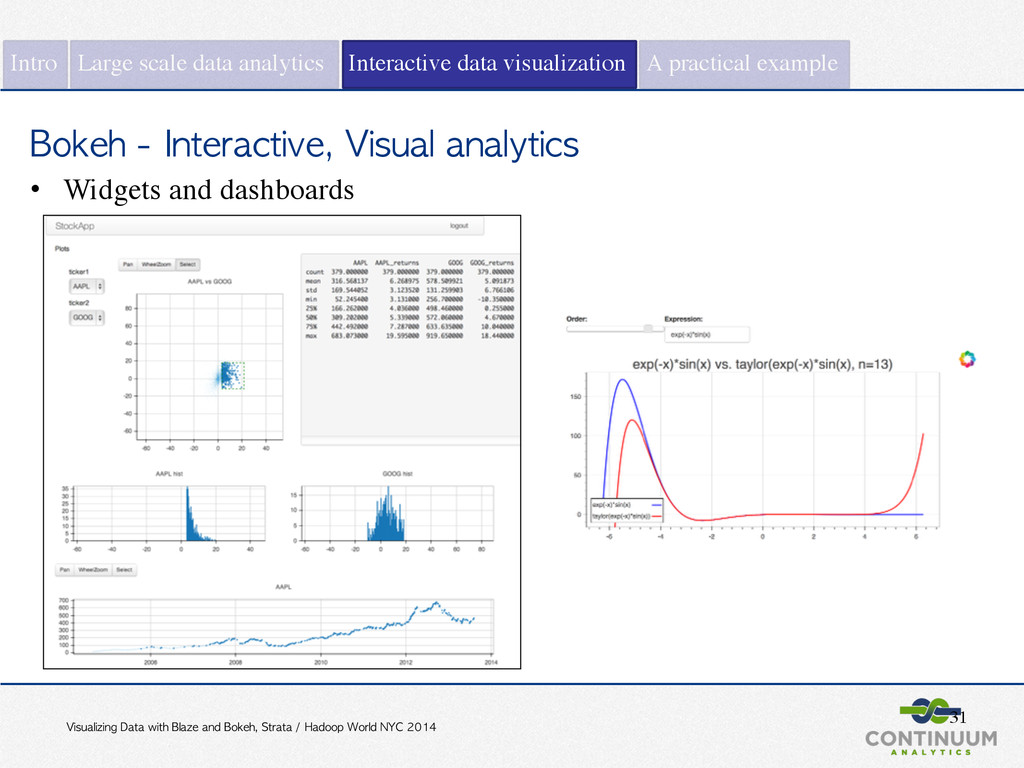
NYC 2014 31 Intro Large scale data analytics Interactive data visualization A practical example Bokeh - Interactive, Visual analytics • Widgets and dashboards
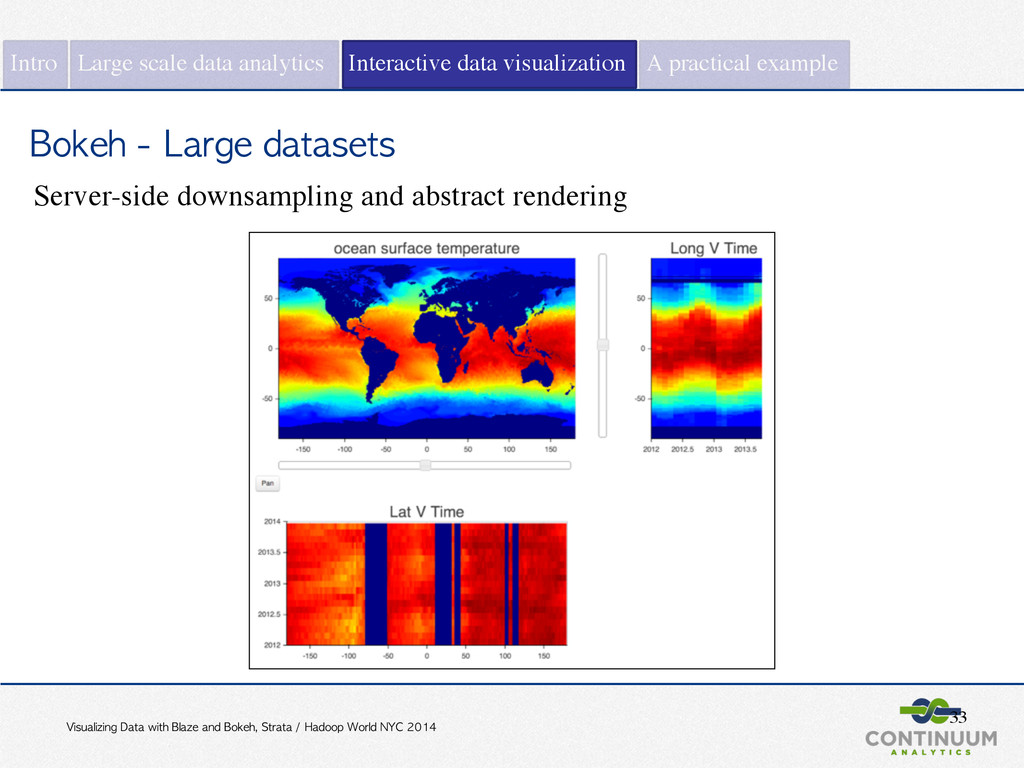
NYC 2014 33 Bokeh - Large datasets Server-side downsampling and abstract rendering Intro Large scale data analytics Interactive data visualization A practical example
NYC 2014 Want to know more about Mining Twitter? Intro Large scale data analytics Interactive data visualization A practical example https://github.com/ptwobrussell/Mining-the-Social-Web-2nd-Edition/