$30 off During Our Annual Pro Sale. View Details »

Leaflet: Web Maps for Better Cities

Aaron Ogle
January 14, 2013

Leaflet: Web Maps for Better Cities

Overview of Leaflet and how we apply it at OpenPlans, presented at JS.Geo 2013.

Aaron Ogle

January 14, 2013
Tweet

Other Decks in Technology

Transcript

  1. WEB MAPS FOR BETTER CITIES
    Aaron Ogle | @atogle |

    View Slide

  2. leafletjs.com
    SIMPLICITY
    PERFORMANCE
    USABILITY

    View Slide

  3. leafletjs.com/reference.html

    View Slide

  4. LEAFLET AT OPENPLANS

    View Slide

  5. https://github.com/atogle/maptoolbox/

    View Slide

  6. https://github.com/openplans/shareabouts

    View Slide

  7. https://github.com/atogle/pointillist/

    View Slide

  8. https://github.com/atogle/pointillist/

    View Slide

  9. https://github.com/openplans/argo/

    View Slide

  10. https://github.com/openplans/argo/
    var options = {
    id: 'trafficspeeds',
    url: 'data/trafficspeeds.json',
    type: 'json',
    popupContent: '{{WDAV}} mph',
    rules: [
    {
    condition: '{{WDAV}} <= 5',
    style: {color: '#fe6565', weight: 4, opacity: 0.9}
    },
    {
    condition: '{{WDAV}} > 5 && {{WDAV}} < 15',
    style: {color: '#fedf65', weight: 4, opacity: 0.9}
    },
    {
    condition: '{{WDAV}} >= 15',
    style: {color: '#65c165', weight: 4, opacity: 0.9}
    }
    ]
    };
    L.argo(options.url, options).addTo(map);

    View Slide

  11. https://github.com/openplans/Leaflet.AnimatedMarker/

    View Slide

  12. https://github.com/openplans/Leaflet.AnimatedMarker/
    var routeLines = [
    L.polyline([[40.6851, -73.9413],[40.68570, -73.9414], ...]),
    L.polyline([[40.7327, -73.9981],[40.73261, -73.9982], ...]),
    L.polyline([[40.7202, -74.0000],[40.72043, -73.9998], ...])
    ],
    i, marker;
    for(i=0; imarker = L.animatedMarker(routeLines[i].getLatLngs(), {
    icon: bikeIcon,
    autoStart: true
    });
    map.addLayer(marker);
    });

    View Slide

  13. https://github.com/atogle/walkshed.js

    View Slide

  14. http://metro.teczno.com/

    View Slide

  15. https://github.com/atogle/walkshed.js

    View Slide

  16. http://www.maptiler.org/google-maps-coordinates-tile-bounds-projection/

    View Slide

  17. https://github.com/atogle/tile-stitcher.js
    var ts = tileStitcher('src/tiles/{z}/{x}/{y}.png');
    ts.stitch(19084, 24821, 19085, 24822, 16, function(stitchedCanvas){
    console.log(stitchedCanvas);
    });

    View Slide

  18. http://webhelp.esri.com/arcgisdesktop/9.3/index.cfm?TopicName=Cost
    %20Distance%20algorithm

    View Slide

  19. https://github.com/atogle/costdistance.js
    var cd = costDistance(),
    costRaster = [
    [1, 3, 4, 4, 3, 2],
    [4, 6, 2, 3, 7, 6],
    [5, 8, 7, 5, 5, 6],
    [1, 4, 5, cd.NODATA, 5, 1],
    [4, 7, 5, cd.NODATA, 2, 6],
    [1, 2, 2, 1, 3, 4]
    ],
    sourceRaster = [
    [0, 1, 1, 0, 0, 0],
    [0, 0, 1, 0, 0, 0],
    [0, 0, 0, 0, 0, 0],
    [0, 0, 0, 0, 0, 0],
    [0, 0, 0, 0, 0, 0],
    [1, 0, 0, 0, 0, 0]
    ],
    cdRaster = cd.calculate(costRaster, sourceRaster);
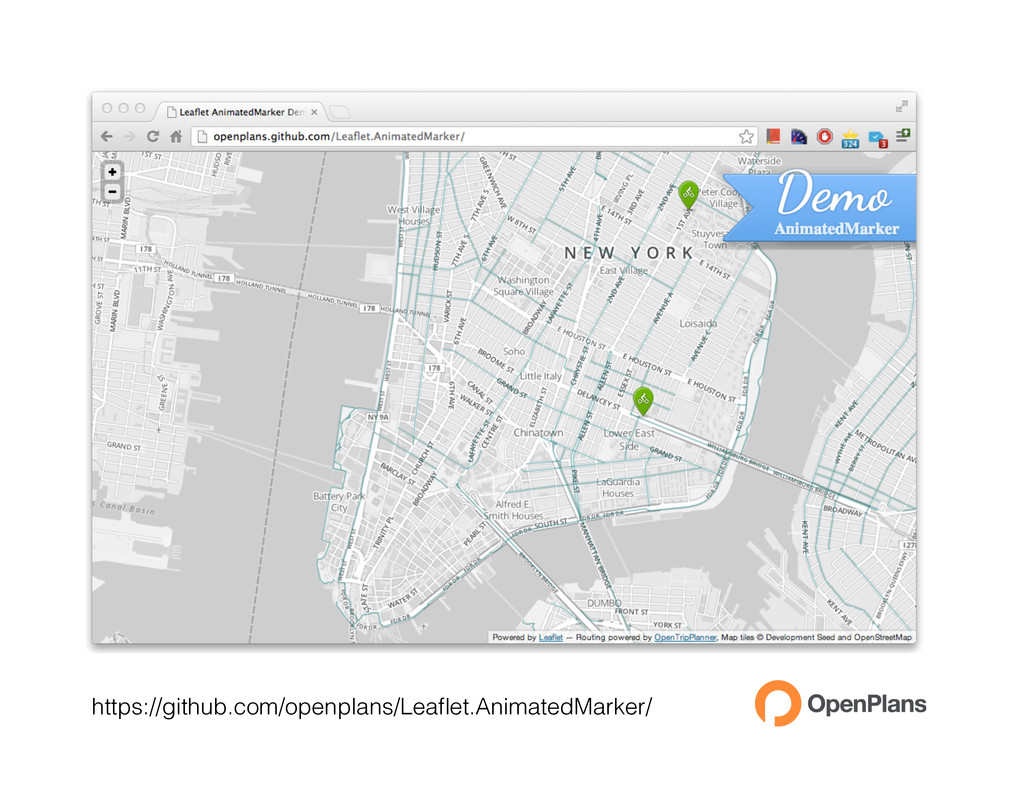
    View Slide

  20. https://github.com/atogle/walkshed.js

    View Slide

  21. WEB MAPS FOR BETTER CITIES
    Aaron Ogle | @atogle |

    View Slide