Upgrade to Pro
— share decks privately, control downloads, hide ads and more …
Speaker Deck
Features
Speaker Deck
PRO
Sign in
Sign up for free
Search
Search
R aplicado a epidemiología
Search
Andree Valle Campos
September 17, 2019
Science
92
0
Share
Embed
Copy iframe code
Copy JS code
Copy link
Start on current slide
R aplicado a epidemiología
Breves ejemplos demostrativos de cómo aplicar R en estudios descriptivos y analíticos.
Andree Valle Campos
September 17, 2019
More Decks by Andree Valle Campos
See All by Andree Valle Campos
01-biostat2019-slides.pdf
avallecam
0
140
cdcper: reporte y visualización de datos en CDC Peru usando R
avallecam
0
130
Redes de regulación génica
avallecam
0
230
microarreglos: esquema teórico y práctico
avallecam
0
410
ciencia reproducible con R
avallecam
0
260
#tardigate: tardígrados y bioinformática en transferencia genética horizontal
avallecam
0
210
Other Decks in Science
See All in Science
Utiliser Bitcoin sans Internet
rlifchitz
0
300
Tensor Factorization Meets Deformed Information Geometry: Convex Relaxation under Deformed Algebra
gkazunii
0
120
(2025) Balade en cyclotomie
mansuy
0
650
水耕栽培:古代の知恵から宇宙農業まで
grow_design_lab
0
160
Non-Gaussian, nonlinear causal discovery with hidden variables and application
sshimizu2006
0
160
AI bij literatuuronderzoek in de wetenschap
voginip
0
220
データベース02: データベースの概念
trycycle
PRO
2
1.3k
フィードフォワードニューラルネットワークを用いた記号入出力制御系に対する制御器設計 / Controller Design for Augmented Systems with Symbolic Inputs and Outputs Using Feedforward Neural Network
konakalab
0
160
第67回コンピュータビジョン勉強会論文紹介「RoboWheel: A Data Engine from Real-World Human Demonstrations for Cross-Embodiment Robotic Learning」
x_ttyszk
0
120
AkarengaLT vol.41
hashimoto_kei
1
150
機械学習 - ニューラルネットワーク入門
trycycle
PRO
0
1.1k
1. CPC理論の展開と集合的知能モデル(JSAI2026 KS-27 集合的予測符号化と新たな知性の時代)
hayashiyus884
1
300
Featured
See All Featured
Stop Working from a Prison Cell
hatefulcrawdad
274
21k
Bash Introduction
62gerente
615
220k
CoffeeScript is Beautiful & I Never Want to Write Plain JavaScript Again
sstephenson
162
16k
Measuring & Analyzing Core Web Vitals
bluesmoon
9
910
Odyssey Design
rkendrick25
PRO
2
730
Dealing with People You Can't Stand - Big Design 2015
cassininazir
367
27k
Accessibility Awareness
sabderemane
1
160
Efficient Content Optimization with Google Search Console & Apps Script
katarinadahlin
PRO
1
740
How to train your dragon (web standard)
notwaldorf
97
6.7k
Beyond borders and beyond the search box: How to win the global "messy middle" with AI-driven SEO
davidcarrasco
3
190
Leveraging LLMs for student feedback in introductory data science courses - posit::conf(2025)
minecr
1
320
Rails Girls Zürich Keynote
gr2m
96
14k
Transcript
R aplicado a la Epidemiología Andree Valle Campos, MSc(c) Grupo
de Trabajo de Investigación Epidemiológica y Evaluación de Intervenciones Sanitarias
http://bit.ly/epicdc2019 Contenido 1. ¿Qué necesidades existen en manejo de datos?
2. Ejemplos: Epidemiología Descriptiva y Analítica 3. Reporte de resultados
http://bit.ly/epicdc2019 ¿Qué se necesita en Epidemiología con respecto a manejo
de datos? • Acceso inmediato a procesar los datos • Accesible para el usuario final • Formato limpio y fácil de comunicar
http://bit.ly/epicdc2019 ¿Qué es lo que hace a R aplicable en
Epidemiología? • Descriptivos rápidos en formato personalizado. • Manipular salidas de modelos • Generar reportes directos con el análisis
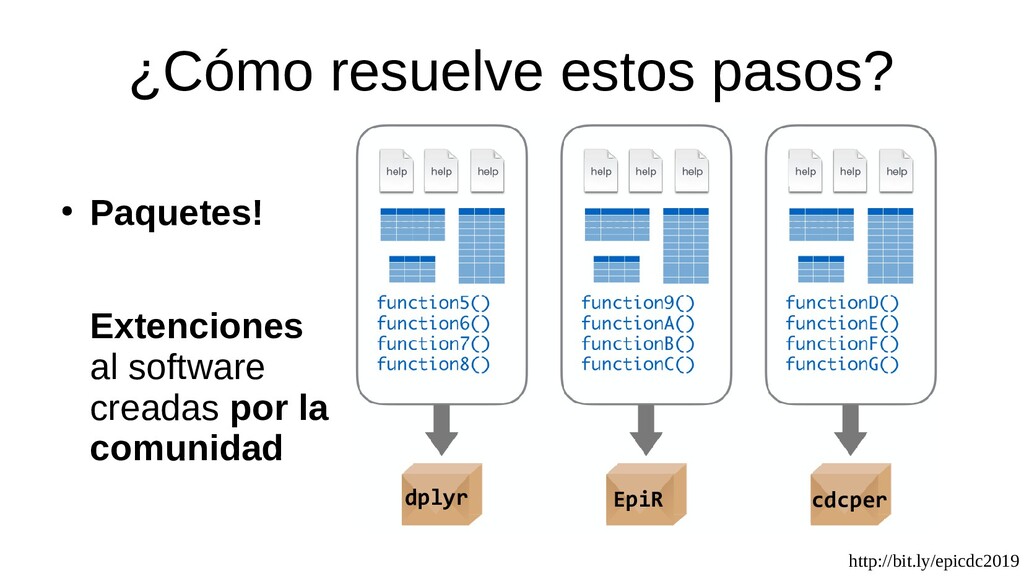
http://bit.ly/epicdc2019 ¿Cómo resuelve estos pasos? • Paquetes! Extenciones al software
creadas por la comunidad dplyr EpiR cdcper
http://bit.ly/epicdc2019 Programación literaria = Legible para un humano (texto) +
Legible para una máquina (código)
http://bit.ly/epicdc2019 Ejemplos
http://bit.ly/epicdc2019 Epidemiología Descriptiva • Caracterizar la distribución de eventos en
la población, tiempo y espacio. • Medidas de frecuencia: – Número de eventos – Tasa de eventos
http://bit.ly/epicdc2019 Ejemplo 1: Brote de Ébola 2014 ¿Cuántos casos hay
en el tiempo? ¿Cuál es la distribución espacial? ¿Cuáles son las características de los casos?
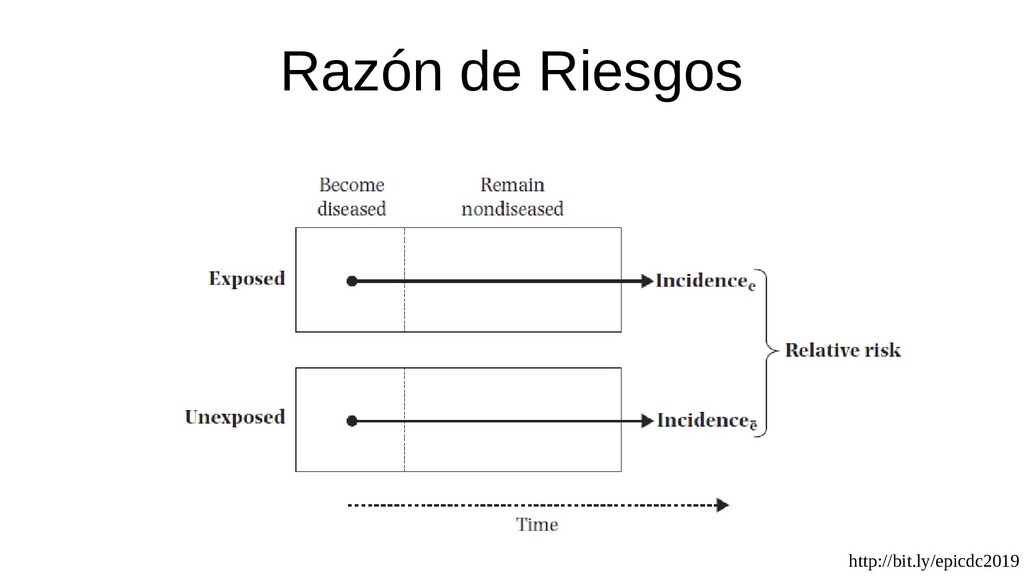
http://bit.ly/epicdc2019 Epidemiología Analítica • Identificar causas u otros factores que
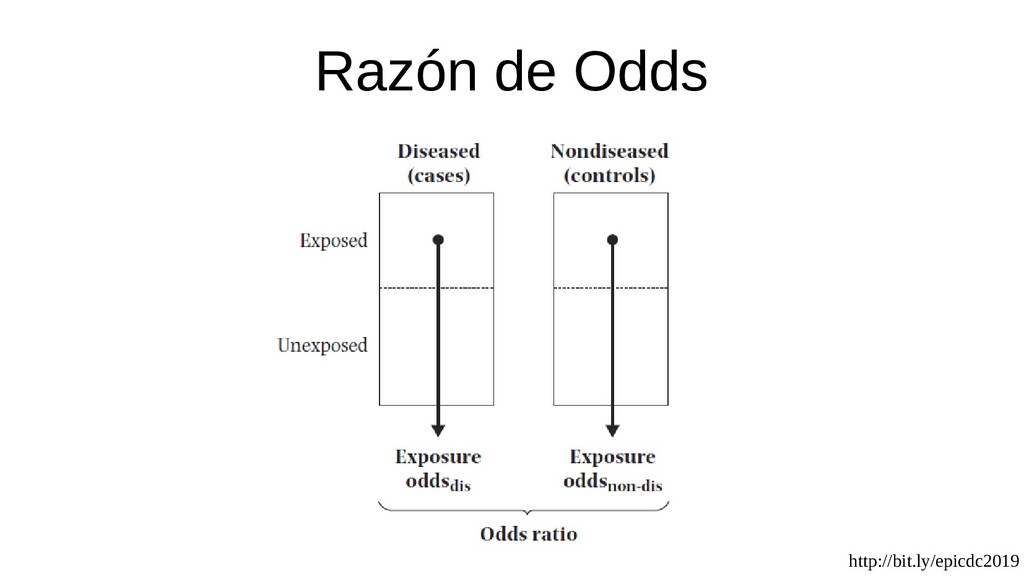
influencien la ocurrencia de eventos • Medidas de asociación: – Cohorte →Recluta expuestos → Razón de Riesgos – Caso-control →Recluta casos → Razón de Odds – ...
http://bit.ly/epicdc2019 Razón de Riesgos
http://bit.ly/epicdc2019 Razón de Odds
http://bit.ly/epicdc2019 Ejemplo 2: Encuesta Whickham 1972-1974 Seguimiento luego de 20
años ¿Fumar está asociado a mortalidad?
http://bit.ly/epicdc2019 Conclusiones • R facilita el análisis descriptivo y ejecución
de estadística inferencial. • R permite comunicar resultados con eficiencia conservando estándares de reproducibilidad.
http://bit.ly/epicdc2019 Links para iniciar • Rstudio primers – https://rstudio.cloud/learn/primers •
Rstudio cheatsheets – https://www.rstudio.com/resources/cheatsheets/
http://bit.ly/epicdc2019 Proyecto disponible: http://bit.ly/epicdc2019 Dowload ZIP → Doble click en
.Rproj
http://bit.ly/epicdc2019
http://bit.ly/epicdc2019 ¿Cómo facilita la comunicación? Rmd: Formatos para verificar y
conducir análisis alternativos o repetitivos.
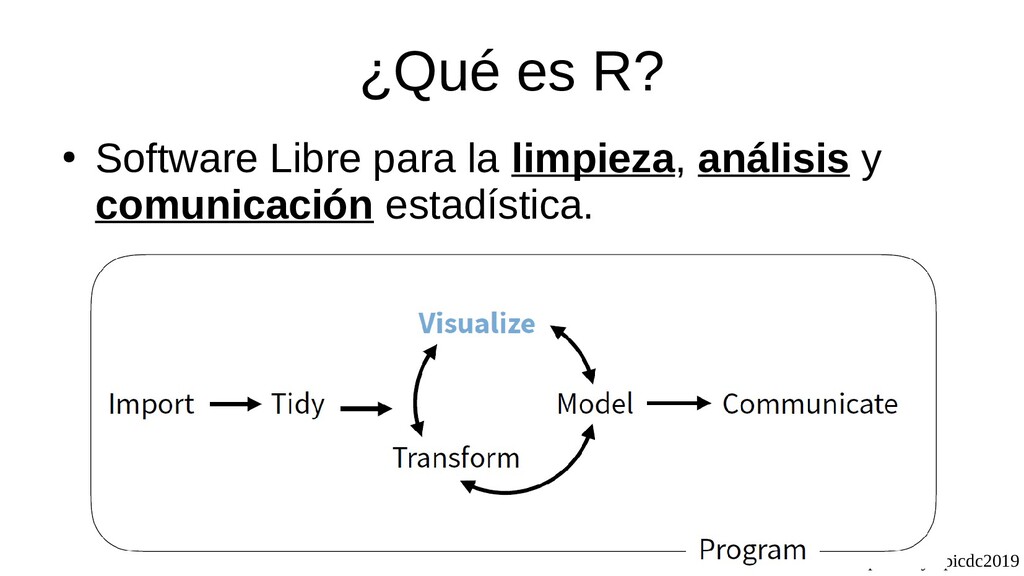
http://bit.ly/epicdc2019 ¿Qué es R? • Software Libre para la limpieza,
análisis y comunicación estadística.