Upgrade to Pro — share decks privately, control downloads, hide ads and more …

FROM MINUTES TO MILLISECONDS – TIPS AND TRICKS FOR FASTER SQL QUERIES

FROM MINUTES TO MILLISECONDS – TIPS AND TRICKS FOR FASTER SQL QUERIES

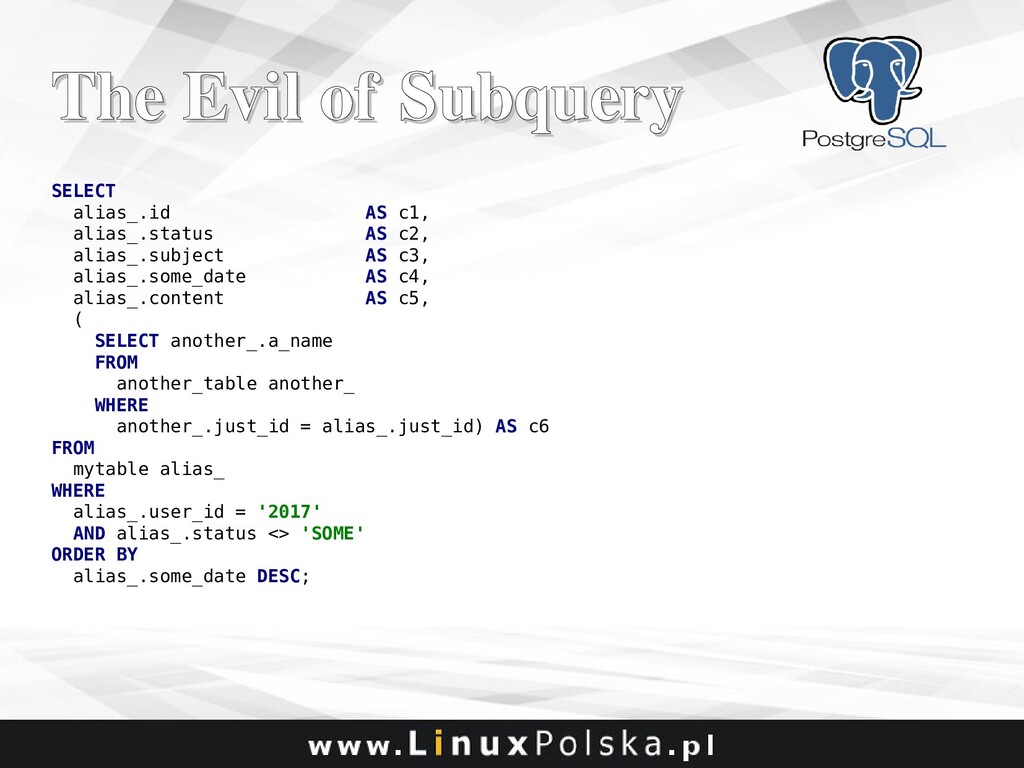
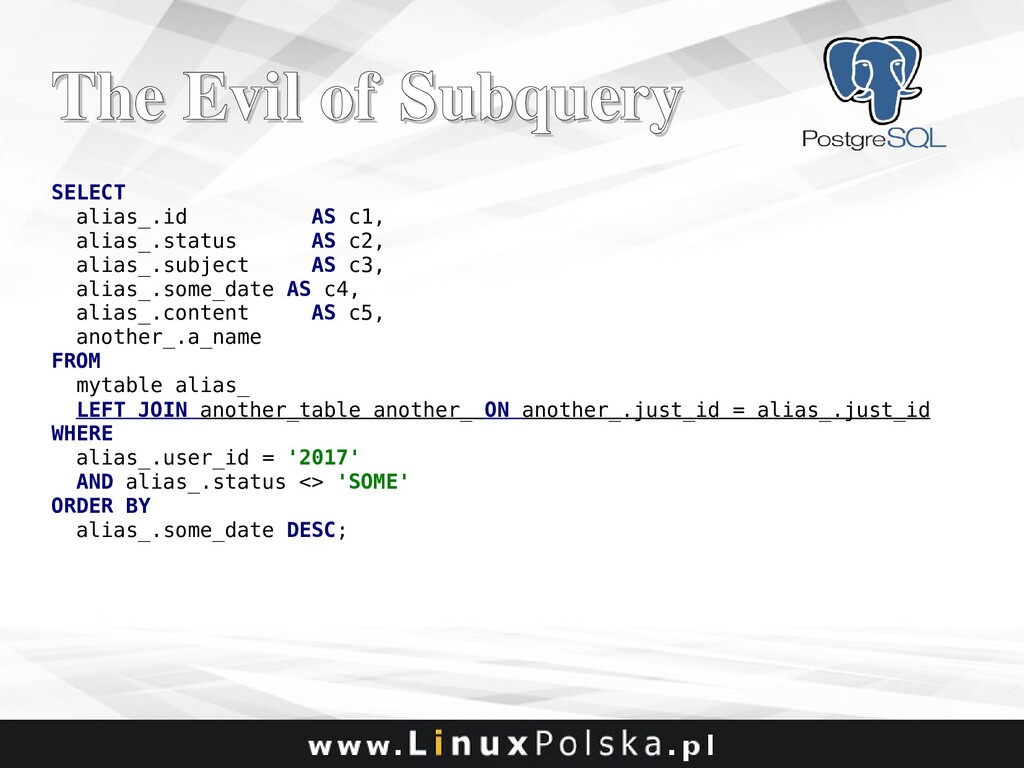
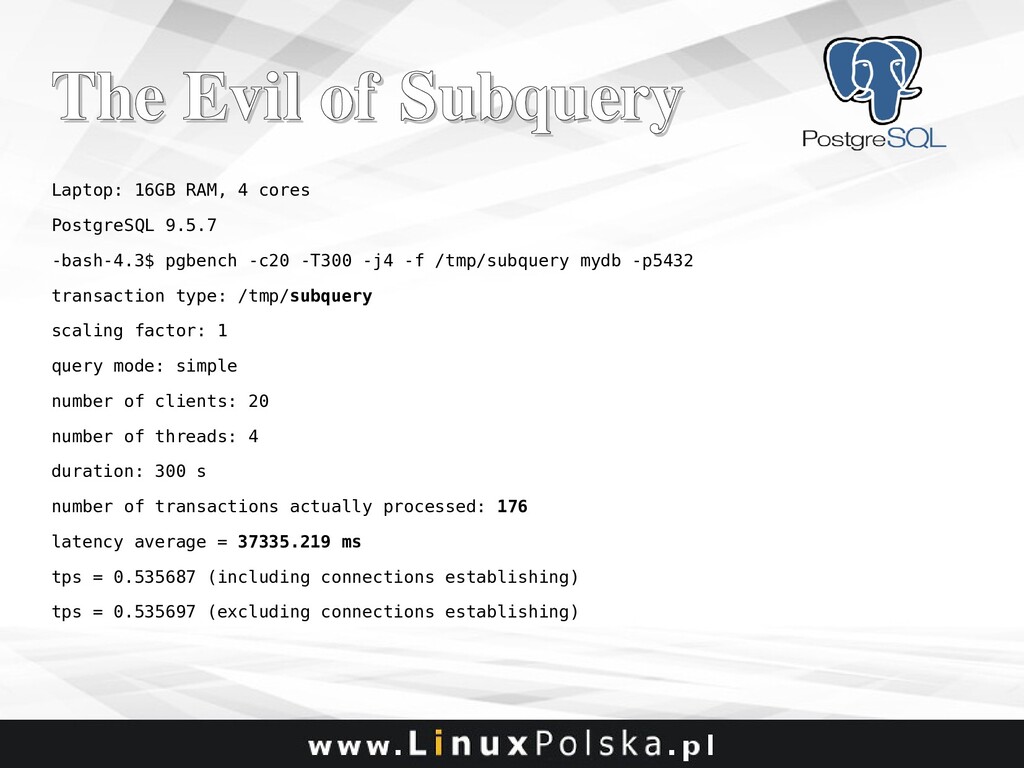
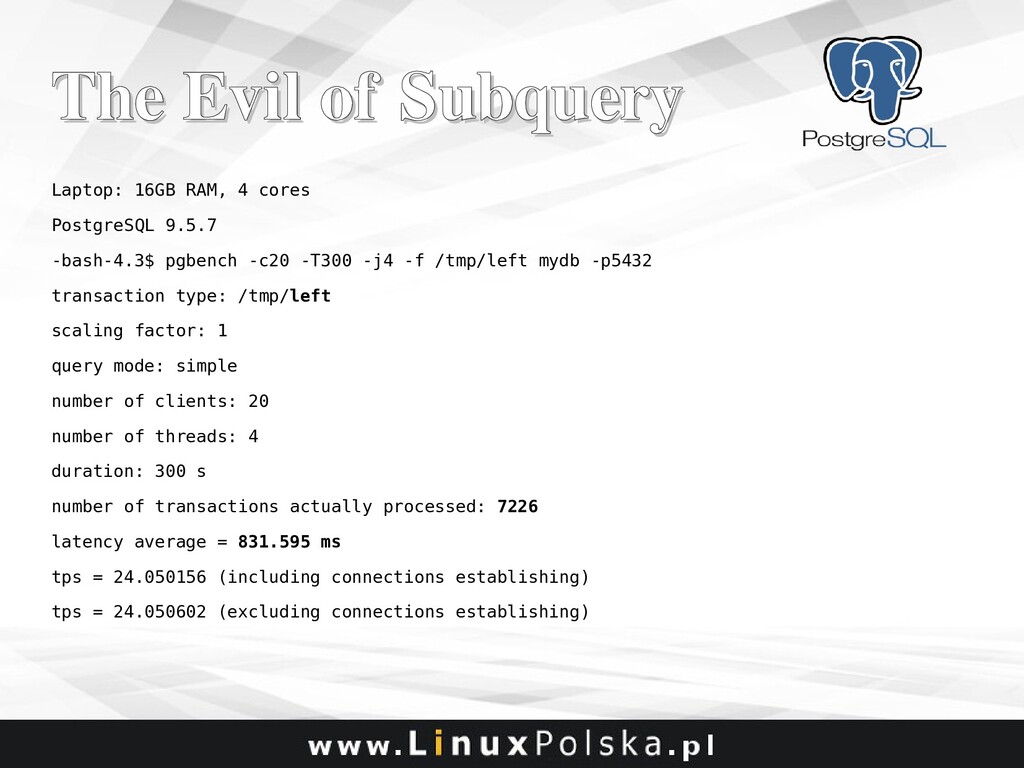
Bad SQL is one of the most common performance issues. The use of ORM frameworks and treating a database as a data store only leads to slow queries which slow down the whole system. I’ll discuss some basic techniques every developer should be aware of, along with some examples from production systems of query tuning using different approaches from modifications of joins and subqueries to adjusting the planer cost settings and other parameters that affect the way a query is executed. Besides, I’ll present some techniques to benchmark a query performance in a reliable and automated manner.

Presented on PGCONF.EU 2017 in Warsaw

AwdotiaRomanowna

October 27, 2017
Tweet

More Decks by AwdotiaRomanowna

Other Decks in Technology

Transcript

  1. Alicja Kucharczyk Solution Architect Linux Polska Sp. z o.o. From

    minutes to milliseconds Tips and Tricks for faster SQL queries
  2. Who am I? Who am I? • PostgreSQL DBA/Developer •

    PostgreSQL/EDB Trainer • Red Hat Certified System Administrator • Solution Architect at Linux Polska
  3. Agenda Agenda • The Evil of Subquery • Data matching

    • The Join Order – Does it matter? • Grand Unified Configuration (GUC) • Synchronization
  4. The Evil of Subquery The Evil of Subquery SELECT alias_.id

    AS c1, alias_.status AS c2, alias_.subject AS c3, alias_.some_date AS c4, alias_.content AS c5, ( SELECT another_.a_name FROM another_table another_ WHERE another_.just_id = alias_.just_id) AS c6 FROM mytable alias_ WHERE alias_.user_id = '2017' AND alias_.status <> 'SOME' ORDER BY alias_.some_date DESC;
  5. The Evil of Subquery The Evil of Subquery SELECT alias_.id

    AS c1, alias_.status AS c2, alias_.subject AS c3, alias_.some_date AS c4, alias_.content AS c5, another_.a_name FROM mytable alias_ LEFT JOIN another_table another_ ON another_.just_id = alias_.just_id WHERE alias_.user_id = '2017' AND alias_.status <> 'SOME' ORDER BY alias_.some_date DESC;
  6. The Evil of Subquery The Evil of Subquery Laptop: 16GB

    RAM, 4 cores PostgreSQL 9.5.7 -bash-4.3$ pgbench -c20 -T300 -j4 -f /tmp/subquery mydb -p5432 transaction type: /tmp/subquery scaling factor: 1 query mode: simple number of clients: 20 number of threads: 4 duration: 300 s number of transactions actually processed: 176 latency average = 37335.219 ms tps = 0.535687 (including connections establishing) tps = 0.535697 (excluding connections establishing)
  7. The Evil of Subquery The Evil of Subquery Laptop: 16GB

    RAM, 4 cores PostgreSQL 9.5.7 -bash-4.3$ pgbench -c20 -T300 -j4 -f /tmp/left mydb -p5432 transaction type: /tmp/left scaling factor: 1 query mode: simple number of clients: 20 number of threads: 4 duration: 300 s number of transactions actually processed: 7226 latency average = 831.595 ms tps = 24.050156 (including connections establishing) tps = 24.050602 (excluding connections establishing)
  8. The Evil of Subquery The Evil of Subquery Server: 128GB

    RAM, 12 cores, 2 sockets PostgreSQL 9.6.5 pgbench -c50 -T1000 -j4 -f /tmp/subquery mydb -p5432 transaction type: /tmp/subquery scaling factor: 1 query mode: simple number of clients: 50 number of threads: 4 duration: 1000 s number of transactions actually processed: 2050 latency average = 24714.484 ms tps = 2.023105 (including connections establishing) tps = 2.023108 (excluding connections establishing)
  9. The Evil of Subquery The Evil of Subquery Server: 128GB

    RAM, 12 cores, 2 sockets PostgreSQL 9.6.5 pgbench -c50 -T1000 -j4 -f /tmp/left mydb -p5432 transaction type: /tmp/left scaling factor: 1 query mode: simple number of clients: 50 number of threads: 4 duration: 1000 s number of transactions actually processed: 75305 latency average = 664.226 ms tps = 75.275552 (including connections establishing) tps = 75.275764 (excluding connections establishing)
  10. The Evil of Subquery The Evil of Subquery Server: 128GB

    RAM, 12 cores, 2 sockets PostgreSQL 9.6.5 Original query Sort (cost=881438.410..881441.910 rows=1400 width=905) (actual time=3237.543..3237.771 rows=1403 loops=1) Sort Key: zulu_india0kilo_oscar.tango DESC Sort Method: quicksort Memory: 1207kB -> Seq Scan on golf victor (cost=0.000..881365.250 rows=1400 width=905) (actual time=7.141..3235.576 rows=1403 loops=1) Filter: (((juliet_charlie)::text <> 'papa'::text) AND (zulu_lima = 'four'::bigint)) Rows Removed by Filter: 336947 SubPlan -> Seq Scan on juliet_golf kilo_seven (cost=0.000..610.770 rows=1 width=33) (actual time=1.129..2.238 rows=1 loops=1403) Filter: ((kilo_whiskey)::text = (zulu_india0kilo_oscar.kilo_whiskey)::text) Rows Removed by Filter: 17661 Planning time: 2.075 ms Execution time: 3237.831 ms
  11. The Evil of Subquery The Evil of Subquery Server: 128GB

    RAM, 12 cores, 2 sockets PostgreSQL 9.6.5 changed Sort (cost=60916.710..60920.210 rows=1400 width=422) (actual time=154.469..154.718 rows=1403 loops=1) Sort Key: zulu_india0kilo_oscar.tango DESC Sort Method: quicksort Memory: 1207kB -> Hash Left Join (cost=3966.560..60843.560 rows=1400 width=422) (actual time=13.870..153.199 rows=1403 loops=1) Hash Cond: ((zulu_india0kilo_oscar.kilo_whiskey)::text = (three1kilo_oscar.kilo_whiskey)::text) -> Seq Scan on golf victor (cost=0.000..56731.750 rows=1400 width=396) (actual time=0.060..138.214 rows=1403 loops=1) Filter: (((juliet_charlie)::text <> 'papa'::text) AND (zulu_lima = 'four'::bigint)) Rows Removed by Filter: 336947 -> Hash (cost=2156.200..2156.200 rows=17662 width=40) (actual time=13.757..13.757 rows=17662 loops=1) Buckets: 32768 Batches: 1 Memory Usage: 1530kB -> Seq Scan on juliet_golf kilo_seven (cost=0.000..2156.200 rows=17662 width=40) (actual time=0.009..6.881 rows=17662 loops=1) Planning time: 11.885 ms Execution time: 154.829 ms
  12. Data matching Data matching • Data validation wasn’t trendy when

    the system was created • After several years nobody knew how many customers the company has • My job: data cleansing and matching • We get know it was about 20% of the number they thought
  13. Data matching Data matching We developed a lot, really a

    lot, conditions like: • Name + surname + 70% of address • Name + surname + email • 70% name + 70% surname + document number • Pesel + name + phone Etc. ...
  14. Data matching Data matching • So… I need to compare

    every row from one table with every row from another table to find duplicates • It means I need a FOR LOOP!
  15. Data matching Data matching • Creatures like that have risen

    BEGIN FOR t IN SELECT imie, nazwisko, ulica, sign, id FROM match.matched LOOP INSERT INTO aa.matched ( id_klienta, id_kontaktu, imie, nazwisko, pesel, id, sign, condition) SELECT id_klienta, id_kontaktu, imie, nazwisko, pesel, id, t.sign, 56 FROM match.klienci_test m WHERE m.nazwisko = t.nazwisko AND m.imie = t.imie AND m.ulica = t.ulica; END LOOP; END;
  16. Data matching Data matching • And even that: BEGIN FOR

    i IN SELECT email, count(1) FROM clean.email_klienci GROUP BY email HAVING count(1) > 1 ORDER BY count DESC LOOP FOR t IN SELECT ulica, numer_domu, sign, id FROM match.matched WHERE id IN ( SELECT id FROM clean.email_klienci WHERE email = i.email) LOOP
  17. Data matching Data matching • Execution time of those functions

    was between 10 minutes and many hours • With almost 100 conditions it meant a really long time to finish
  18. Data matching Data matching • But wait! It’s SQL INSERT

    INTO aa.matched_sql ( id_klienta, id_kontaktu, imie, nazwisko, pesel, id, sign, condition) SELECT m.id_klienta, m.id_kontaktu, m.imie, m.nazwisko, m.pesel, m.id, t.sign, 56 FROM match.klienci_test m JOIN match.matched t ON m.nazwisko = t.nazwisko AND m.imie = t.imie AND m.ulica = t.ulica;
  19. Data matching Data matching • Function with FOR LOOP: Total

    query runtime: 27.2 secs • JOIN: 1.3 secs execution time
  20. Join Order Join Order SELECT * FROM a, b, c

    WHERE … Possible join orders for the query above: a b c a c b b a c b c a c a b c b a
  21. Join Order Join Order • Permutation without repetition • The

    number of possible join orders is the factorial of the number of tables in the FROM clause: number_of_joined_tables! In this case it’s 3! = 6
  22. Join Order Join Order With more tables in FROM SELECT

    i AS table_no, i ! AS possible_orders FROM generate_series(3, 20) i;
  23. Join Order Join Order • The job of the query

    optimizer is not to come up with the most efficient execution plan. Its job is to come up with the most efficient execution plan that it can find in a very short amount of time. • Because we don’t want the planner to spend time for examining all of 2 432 902 008 176 640 000 possible join orders when our query has 20 tables in FROM.
  24. Join Order Join Order Some simple rules exist: • the

    smallest table (or set) goes first • or should be the one with the most selective and efficient WHERE clause condition
  25. Join Order Join Order And then we have to only

    tell PostgreSQL we are sure about the order: join_collapse_limit = 1
  26. Grand Unified Configuration Grand Unified Configuration • GUC – an

    acronym for the “Grand Unified Configuration” • a way to control Postgres at various levels • can be set per: – user – session (SET) – subtransaction – database – or globally (postgresql.conf)
  27. Grand Unified Configuration Grand Unified Configuration • cpu_tuple_cost (floating point)

    Sets the planner's estimate of the cost of processing each row during a query. The default is 0.01. • join_collapse_limit (integer) The planner will rewrite explicit JOIN constructs (except FULL JOINs) into lists of FROM items whenever a list of no more than this many items would result. Smaller values reduce planning time but might yield inferior query plans. By default, this variable is set the same as from_collapse_limit, which is appropriate for most uses. Setting it to 1 prevents any reordering of explicit JOINs. Thus, the explicit join order specified in the query will be the actual order in which the relations are joined.
  28. Grand Unified Configuration Grand Unified Configuration • enable_nestloop (boolean) Enables

    or disables the query planner's use of nested-loop join plans. It is impossible to suppress nested-loop joins entirely, but turning this variable off discourages the planner from using one if there are other methods available. The default is on. • enable_mergejoin (boolean) Enables or disables the query planner's use of merge-join plan types. The default is on.
  29. Grand Unified Configuration Grand Unified Configuration • Mantis Issue: The

    report could not has been generated before the session timeout was exceeded • Session timeout was set to 20 minutes • It’s been a really big query with over 20 joins and a lot, really a lot calculations
  30. Grand Unified Configuration Grand Unified Configuration SET cpu_tuple_cost=0.15; SET join_collapse_limit=1;

    SET enable_nestloop = FALSE; SET enable_mergejoin=FALSE; Execution time: 30 seconds
  31. Synchronization Synchronization • Data synchronization issue between the core system

    and online banking system • Core system (Oracle) generated XML files which were then parsed on PostgreSQL and loaded into the online banking system • 200GB – 1,6TB of XML files per day
  32. Synchronization Synchronization Starting Point Around 20 get_xml_[type] functions with FOR

    LOOP doing exactly the same but for different types: CREATE FUNCTION get_xml_type5() RETURNS SETOF ourrecord LANGUAGE plpgsql AS $$ DECLARE type5 ourrecord; BEGIN FOR type5_var IN EXECUTE 'SELECT id, xml_data FROM xml_type5 WHERE some_status IS NULL ORDER BY some_date ASC LIMIT 1000 FOR UPDATE' LOOP UPDATE xml_type5 SET some_status = 1, some_start_time = NOW() WHERE id = type5_var.id; RETURN NEXT type5_var; END LOOP; RETURN; END; $$;
  33. Synchronization Synchronization Starting Point Around 20 xml_[type] tables like: CREATE

    TABLE xml_type5 ( id BIGINT NOT NULL, some_status INTEGER, some_time TIMESTAMP WITH TIME ZONE, another_time TIMESTAMP WITH TIME ZONE, [...], xml_data XML NOT NULL );
  34. Synchronization Synchronization Refactoring • ~20 functions replaced with 1 •

    Types as input parameters, not separate functions • Instead of FOR LOOP – subquery (UPDATE … FROM) • OUT parameters and RETURNING clause instead of record variable and RETURN NEXT clause • Locking “workaround” • One main, abstract table and many inherited type tables with lower than default fillfactor setting
  35. Synchronization Synchronization Refactoring CREATE FUNCTION get_xml(i_tbl_suffix TEXT, i_target sync_target, i_type_id

    INTEGER, i_node TEXT, OUT o_id BIGINT, OUT o_xml_data XML, OUT o_xml_data_id INT, OUT o_counter INTEGER) RETURNS SETOF RECORD LANGUAGE plpgsql AS $$ BEGIN RETURN QUERY EXECUTE 'UPDATE sync.some_' || i_tbl_suffix || ' AS sp SET node=''' || i_node || ''', some_status = 1, some_start_time = NOW() FROM (SELECT j.id, x.xml_data, j.xml_data_id, j.counter FROM sync.some_' || i_tbl_suffix || ' j JOIN sync.xml_' || i_tbl_suffix || ' x ON x.id=j.xml_data_id WHERE j.some_status = 0 AND j.target =''' || i_target || ''' AND j.type_id=' || i_type_id || ' AND (j.some_next_exec <= NOW() OR j.some_next_exec IS NULL) AND j.xmax = 0 AND j.active = TRUE LIMIT 1000 FOR UPDATE) AS get_set WHERE get_set.id = sp.id RETURNING get_set.*'; END; $$;
  36. Synchronization Synchronization Offset “workaround” From the documentation: xmax The identity

    (transaction ID) of the deleting transaction, or zero for an undeleted row version. It is possible for this column to be nonzero in a visible row version. That usually indicates that the deleting transaction hasn't committed yet, or that an attempted deletion was rolled back.
  37. Synchronization Synchronization Test Environment 1. Database dump 2. Start collecting

    the logs (pg_log) 3. Restore the database on test from production 4. Replay the logs on the test cluster using pgreplay 5. Kill -9 after an hour 6. Generate pgBadger report from test run 7. Drop database, restart server, drop caches etc. 8. Repeat from point 3 with the new code
  38. Synchronization Synchronization Results 1. New synchronization has processed over 7

    times more rows than the old one: 1 768 972 vs. 244 144 in 1 hour 2. New synchronization requires 6,21 queries on average and an old one 9,88 3. 92,29% queries took less than 1 ms in a old version the percentage was 81,25%