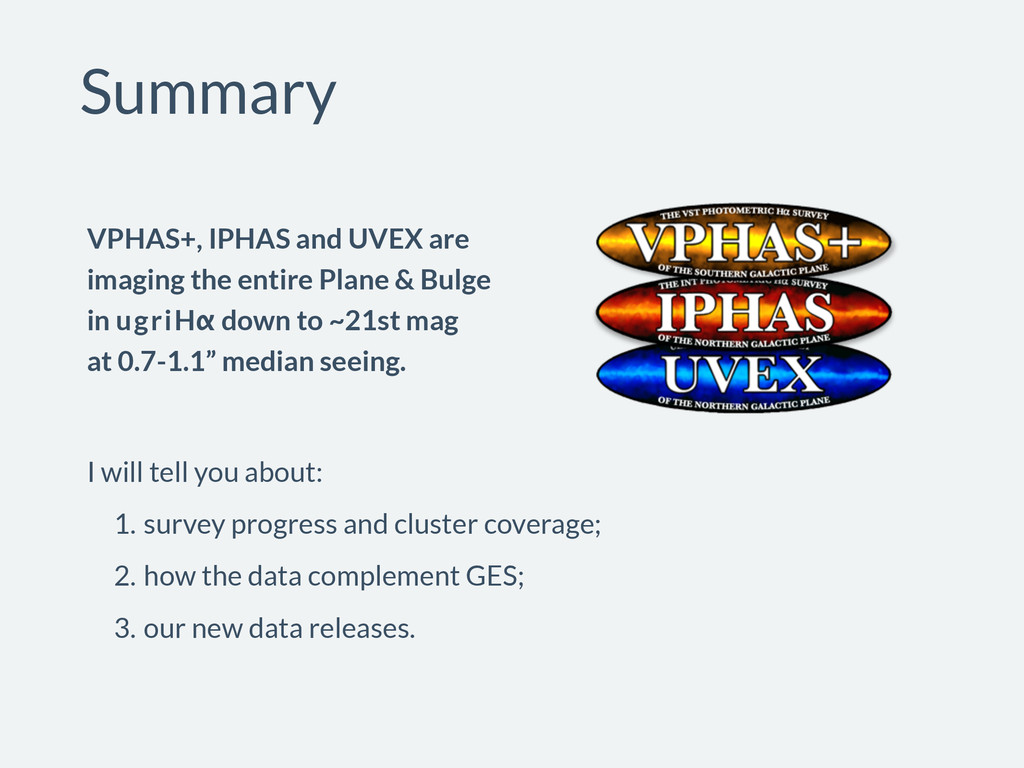
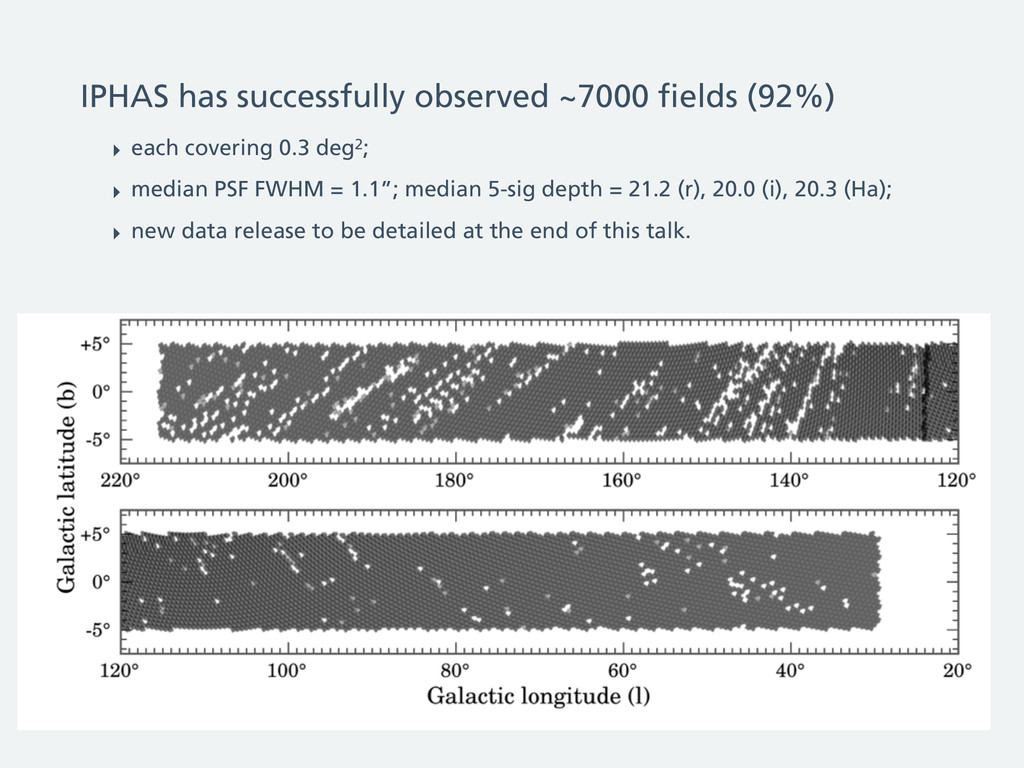
Plane & Bulge in ugriHα down to ~21st mag at 0.7-1.1” median seeing. ! I will tell you about: 1. survey progress and cluster coverage; 2. how the data complement GES; 3. our new data releases. Summary
(UVEX PI) University of Cambridge (CASU pipeline) ! Other members include: IAC, University of Graz, Warwick University, University College London, Tautenburg Observatory, University of Graz, University of Bristol, University of Exeter, Imperial College London, University of Manchester, Southampton University, Armagh Observatory, Macquarie University, Harvard-Smithsonian CfA, ESO, University of Valencia. ! Key individuals include: Janet Drew (PI), Paul Groot (UVEX lead), Romano Corradi, Jochen Eisloeffel, Hywel Farnhill, Boris Gaensicke, Robert Greimel, Eduardo Gonzalez-Solares, Mike Irwin, Danny Steeghs. The collaboration
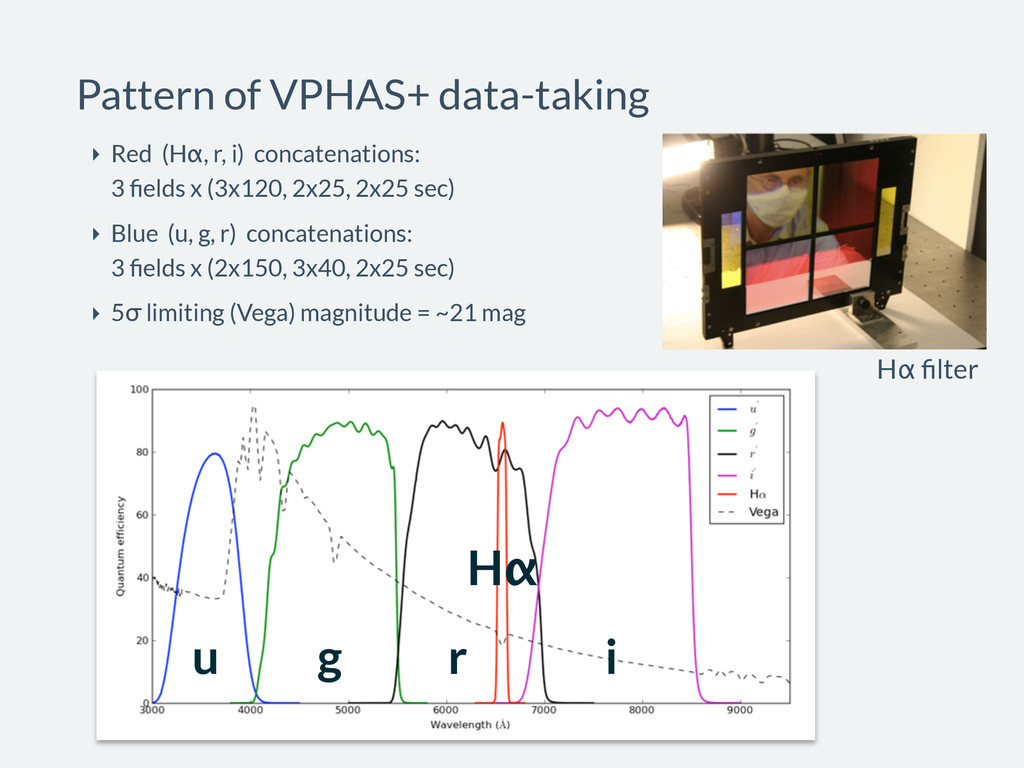
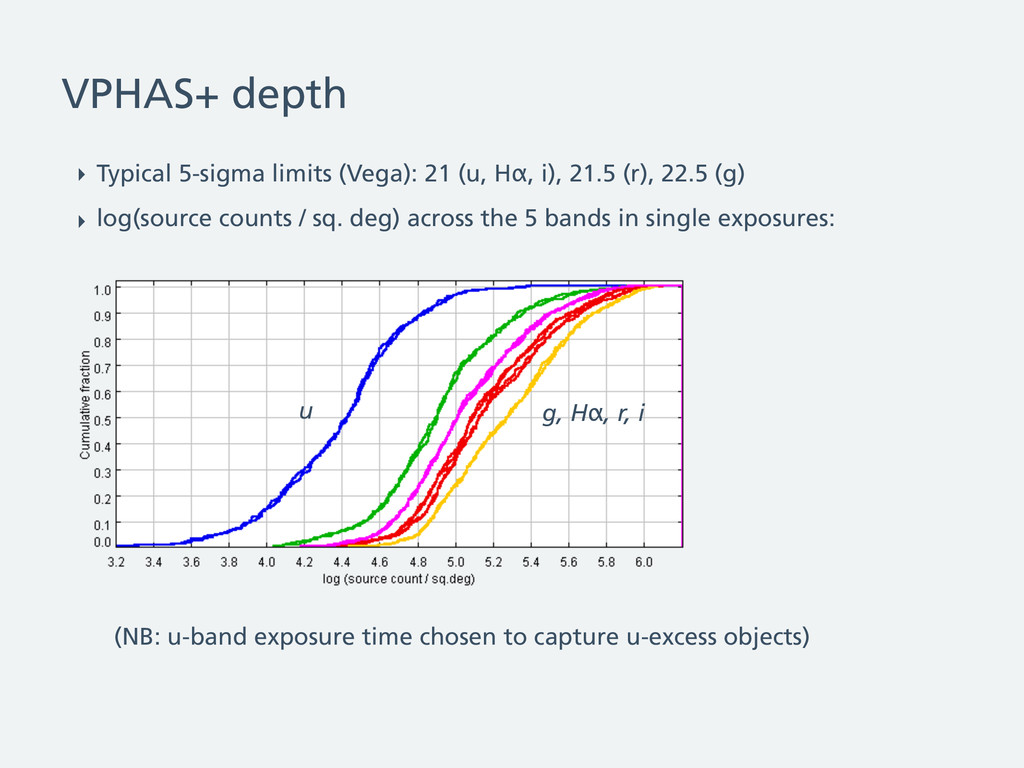
i), 21.5 (r), 22.5 (g) ‣ log(source counts / sq. deg) across the 5 bands in single exposures: g, Hα, r, i u (NB: u-band exposure time chosen to capture u-excess objects)
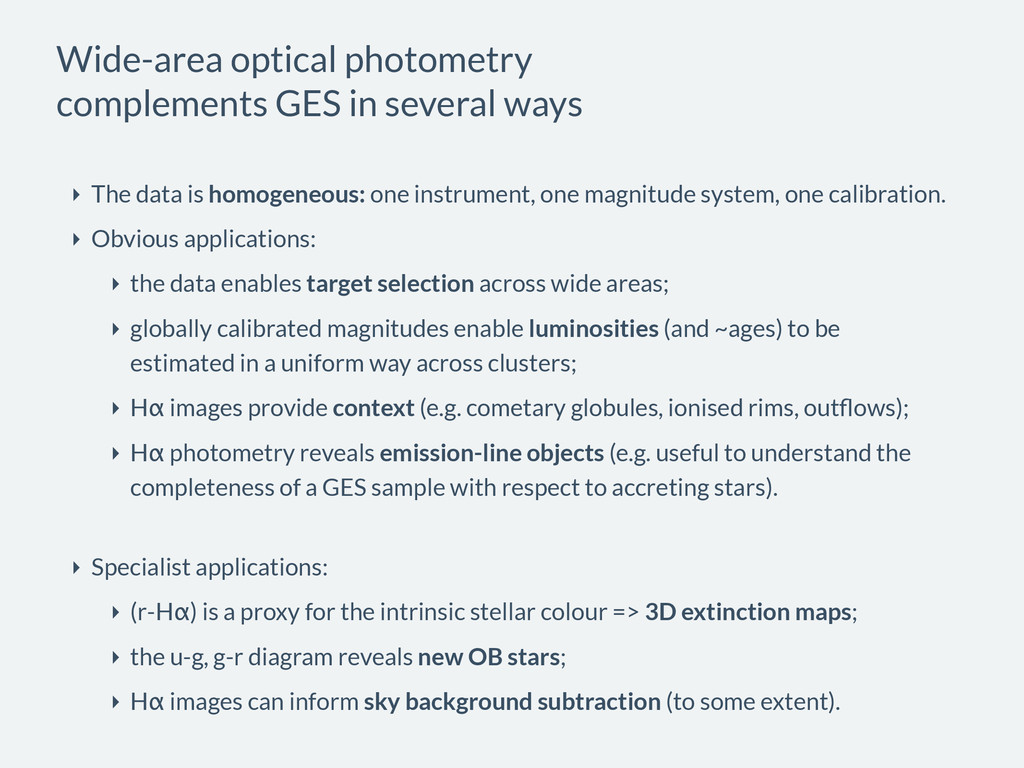
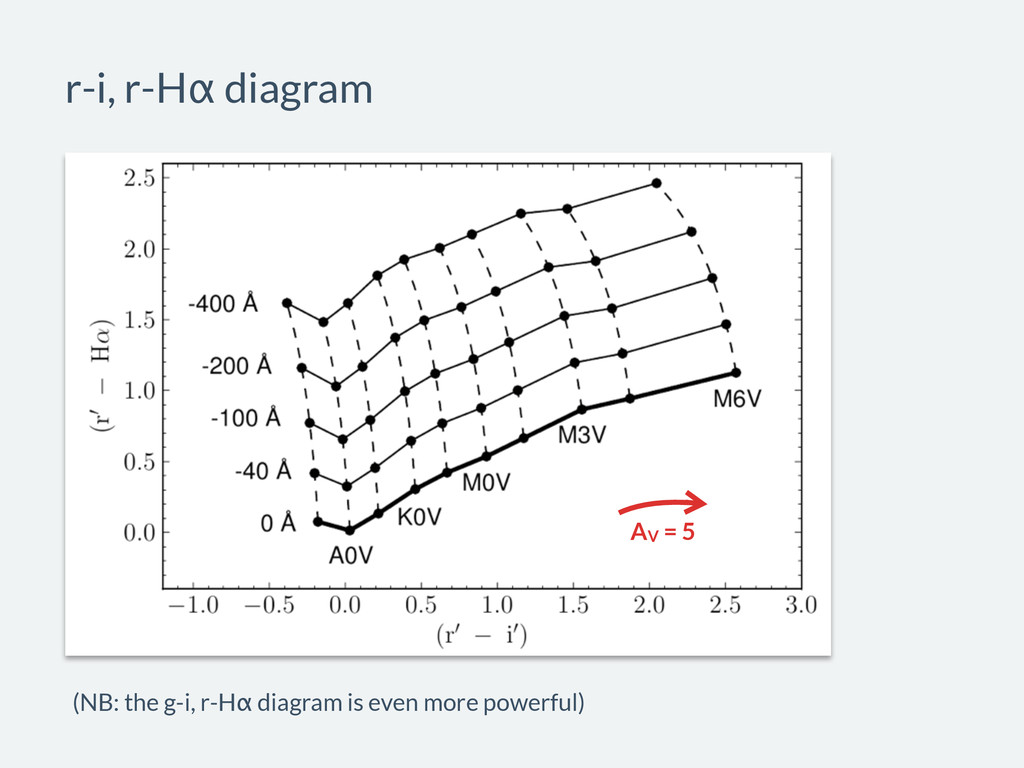
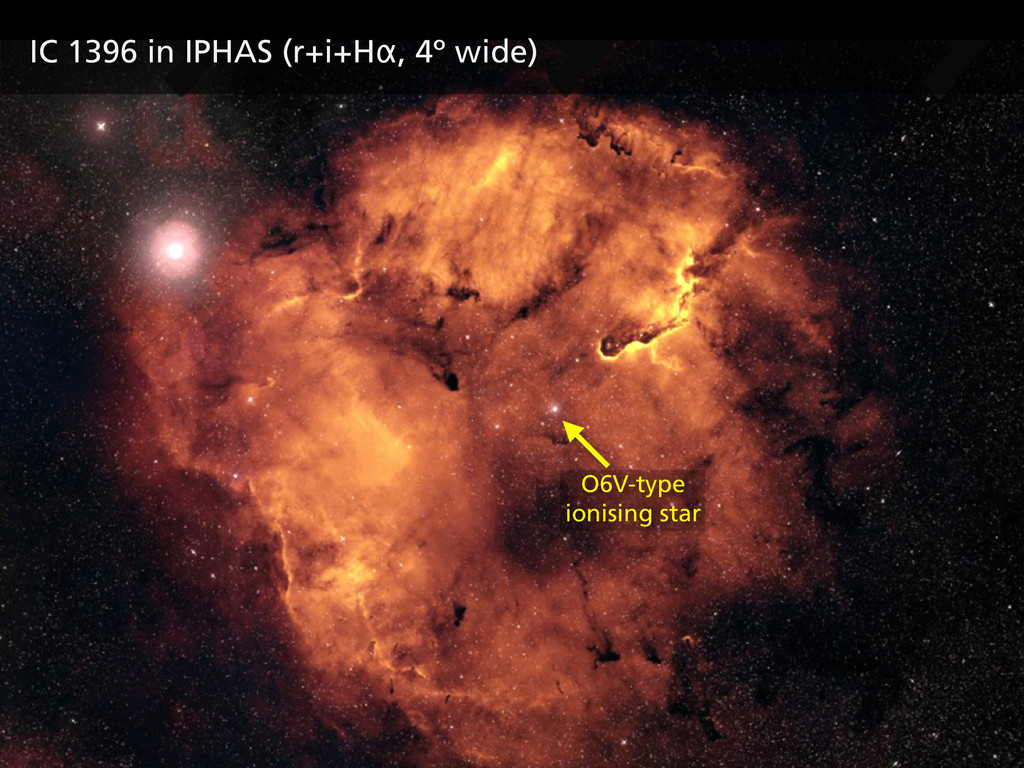
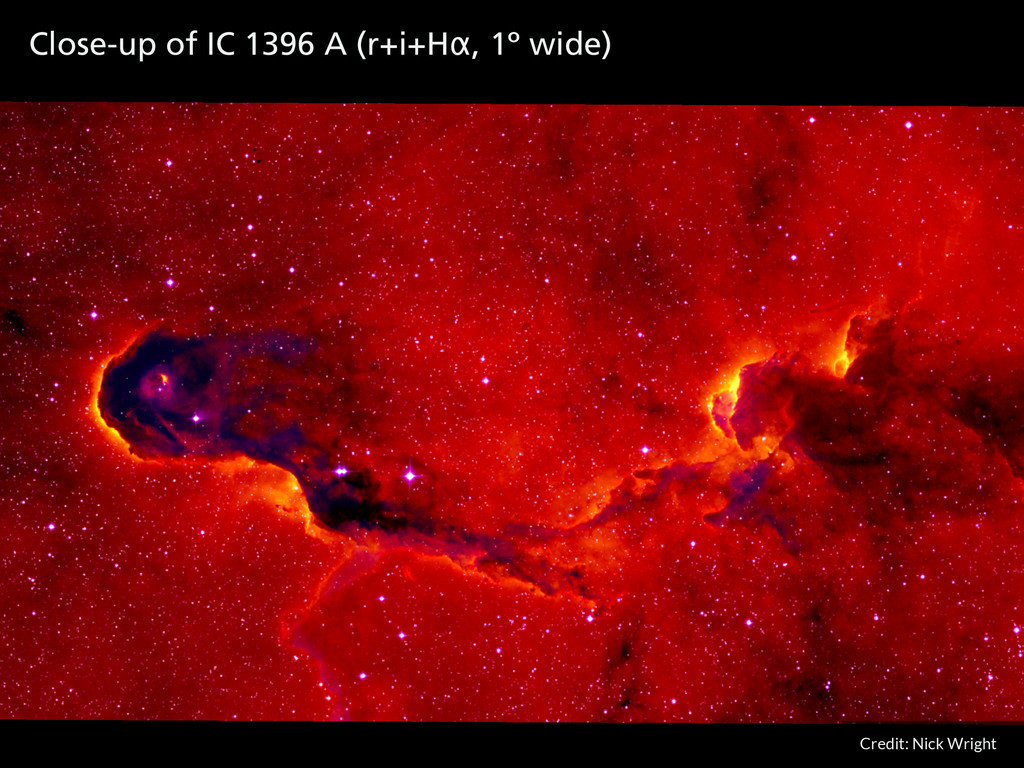
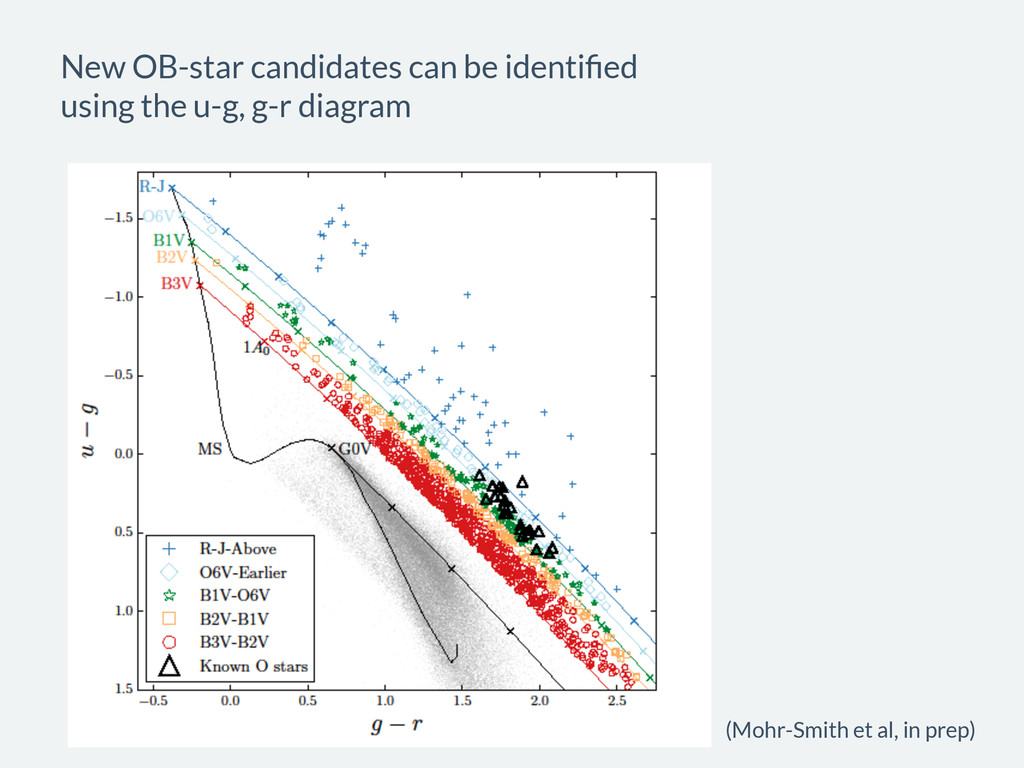
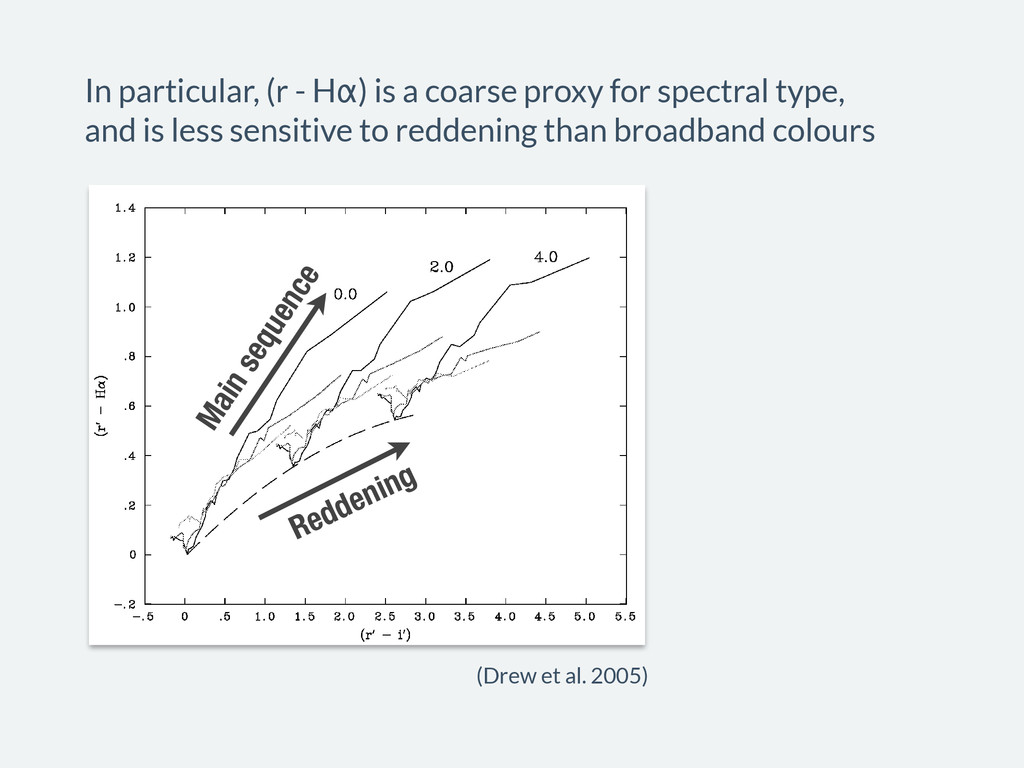
‣ The data is homogeneous: one instrument, one magnitude system, one calibration. ‣ Obvious applications: ‣ the data enables target selection across wide areas; ‣ globally calibrated magnitudes enable luminosities (and ~ages) to be estimated in a uniform way across clusters; ‣ Hα images provide context (e.g. cometary globules, ionised rims, outflows); ‣ Hα photometry reveals emission-line objects (e.g. useful to understand the completeness of a GES sample with respect to accreting stars). ‣ Specialist applications: ‣ (r-Hα) is a proxy for the intrinsic stellar colour => 3D extinction maps; ‣ the u-g, g-r diagram reveals new OB stars; ‣ Hα images can inform sky background subtraction (to some extent).
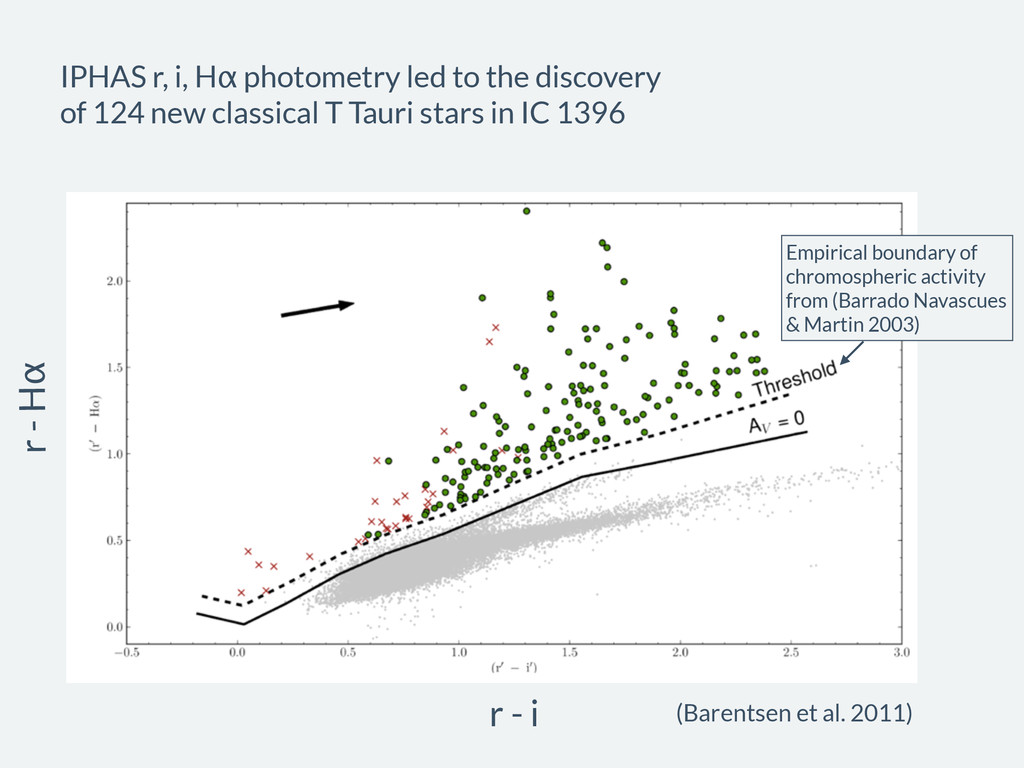
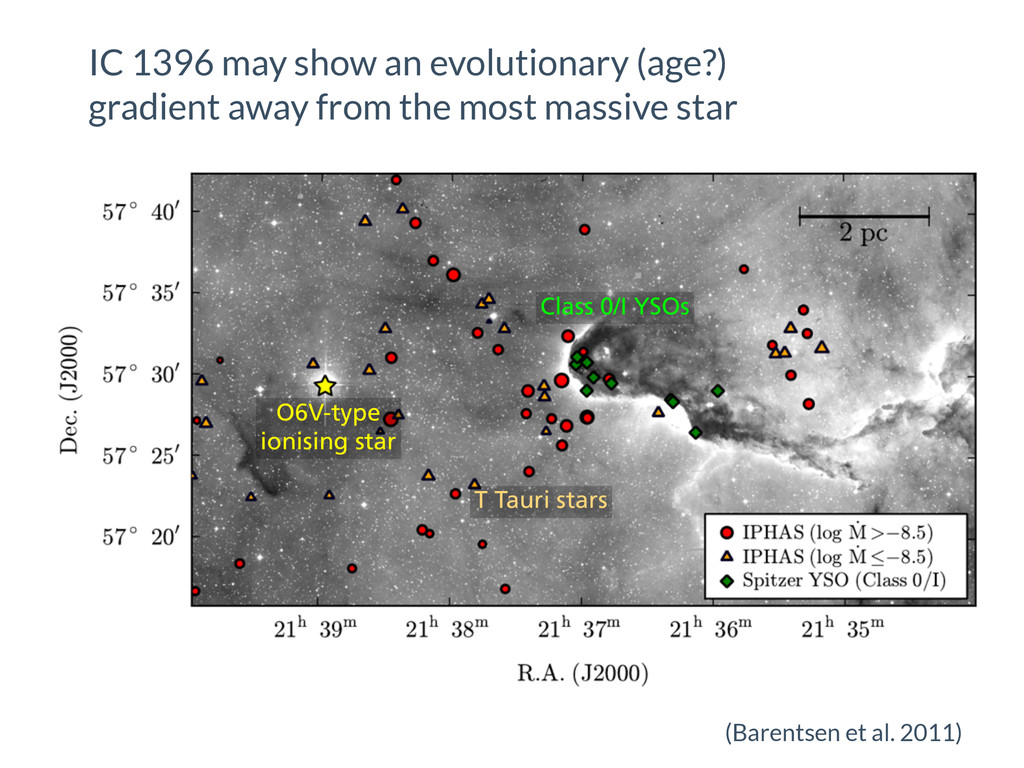
124 new classical T Tauri stars in IC 1396 Empirical boundary of chromospheric activity from (Barrado Navascues & Martin 2003) r - Hα r - i (Barentsen et al. 2011)
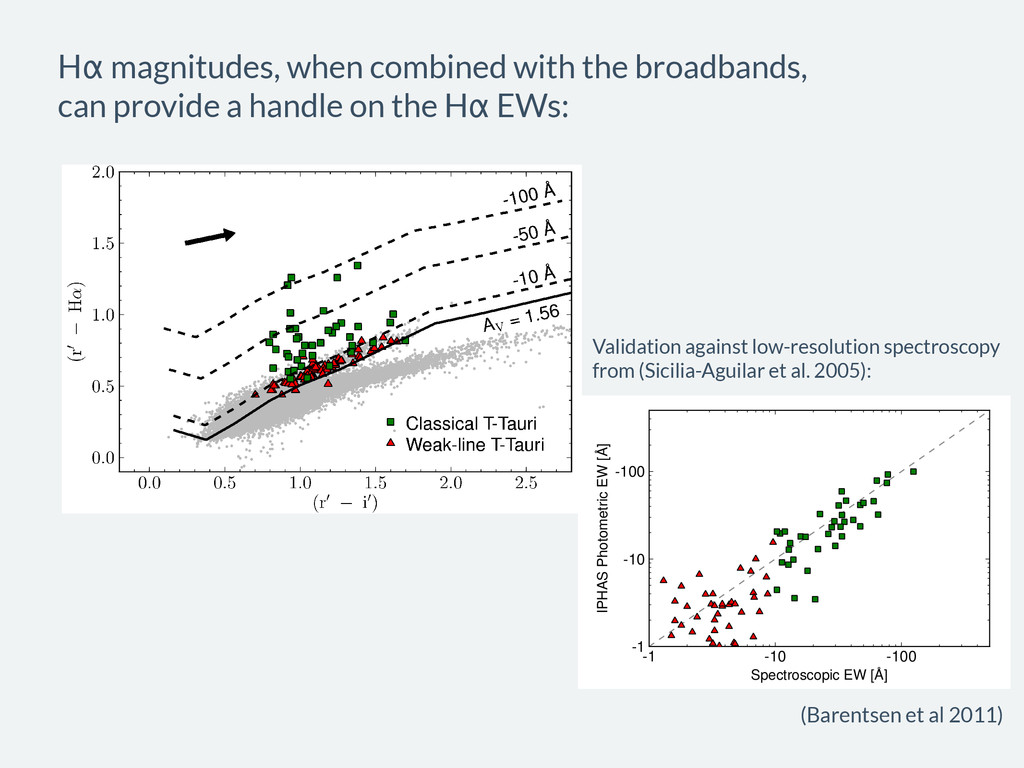
IPHAS colours of known T Tauri stars in IC 1396 from Sicilia-Aguilar et al. (2005). Green squares are classical T Tauri stars (CTTS) with spectroscopic EWH↵ stronger than - 10 ˚ A. Red triangles are weak-line T Tauri stars (WTTS) with EWH↵ weaker than -10 ˚ A. The solid line shows the simulated main sequence curve at the mean reddening of the cluster ( ¯ AV = 1.56). Dashed lines shows the position of stars at increasing levels of H↵ emission as predicted by our simulated tracks. Grey dots show field stars in the region. The arrow shows the reddening shift for an M0V-type object being reddened from AV = 0 to AV = 1.56 (note that the true reddening tracks are curved in a is the typical reddening found by SA05). W the classical T Tauri stars are well separated stars (shown as grey points): most are abo EW boundary as predicted by the drawn grid trast the weak-lined stars fall within the mai blending in with normal less-reddened stars. reddening raises the EW threshold for the c of emission line stars is a recognised property colour-colour plane (see Drew et al. 2005). One weak-lined object, named 73-537 in seen to fall somewhat below the simulated (solid line in Fig. 4). The aberrant position i the high reddening of the object, AV = 3. outlier in terms of reddening compared to t sample. To validate the grid in more detail, we in tracks to derive H↵ EWs for the known T These values are then plotted against the spe ues from SA05. The comparison is shown in F a strong correlation between the photometri scopic estimates, albeit with a large scatter o 5 to 10 ˚ A. Figure 4. IPHAS colours of known T Tauri stars in IC 1396 from Sicilia-Aguilar et al. (2005). Green squares are classical T Tauri stars (CTTS) with spectroscopic EWH↵ stronger than - 10 ˚ A. Red triangles are weak-line T Tauri stars (WTTS) with EWH↵ weaker than -10 ˚ A. The solid line shows the simulated main sequence curve at the mean reddening of the cluster ( ¯ AV = 1.56). Dashed lines shows the position of stars at increasing levels of H↵ emission as predicted by our simulated tracks. Grey dots show field stars in the region. The arrow shows the reddening shift for an M0V-type object being reddened from AV = 0 to AV = 1.56 (note that the true reddening tracks are curved in a way that depends on the SED and the amount of reddening, see Drew et al. 2005) -1 -10 -100 Spectroscopic EW [ ˚ A] -1 -10 -100 IPHAS Photometric EW [ ˚ A] Figure 5. Comparison of IPHAS photometric EWH↵ with spec- troscopic values from Sicilia-Aguilar et al. (2005). The grey dashed line shows the unity relation. The scatter is thought to Hα magnitudes, when combined with the broadbands, can provide a handle on the Hα EWs: Validation against low-resolution spectroscopy from (Sicilia-Aguilar et al. 2005): (Barentsen et al 2011)
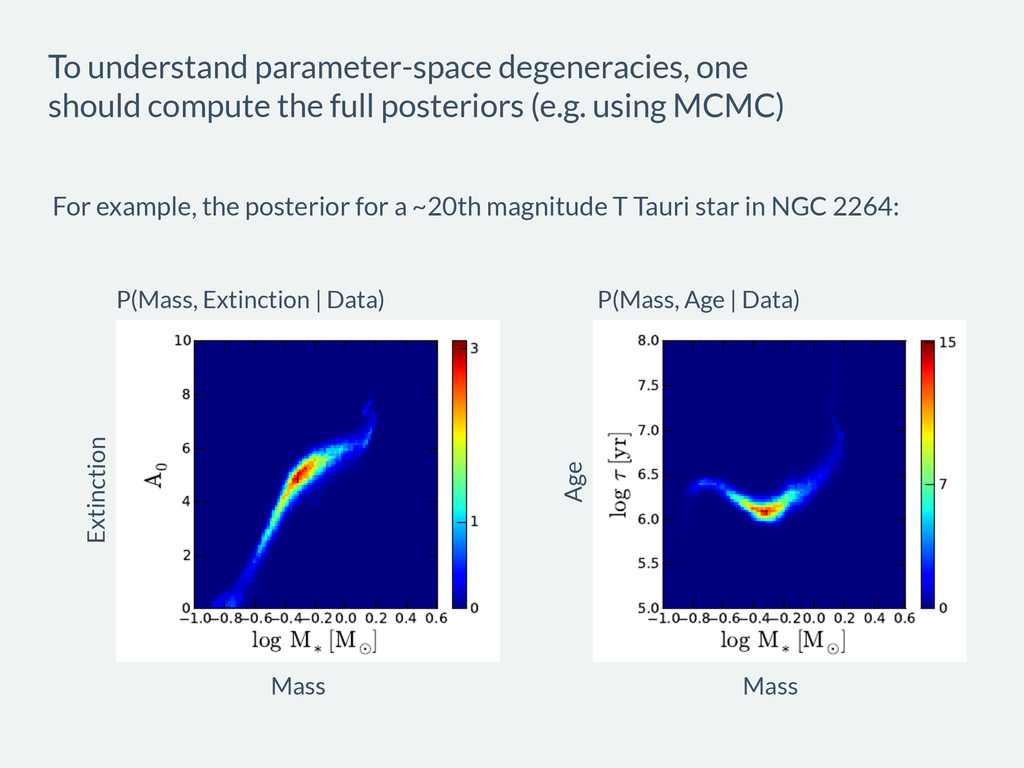
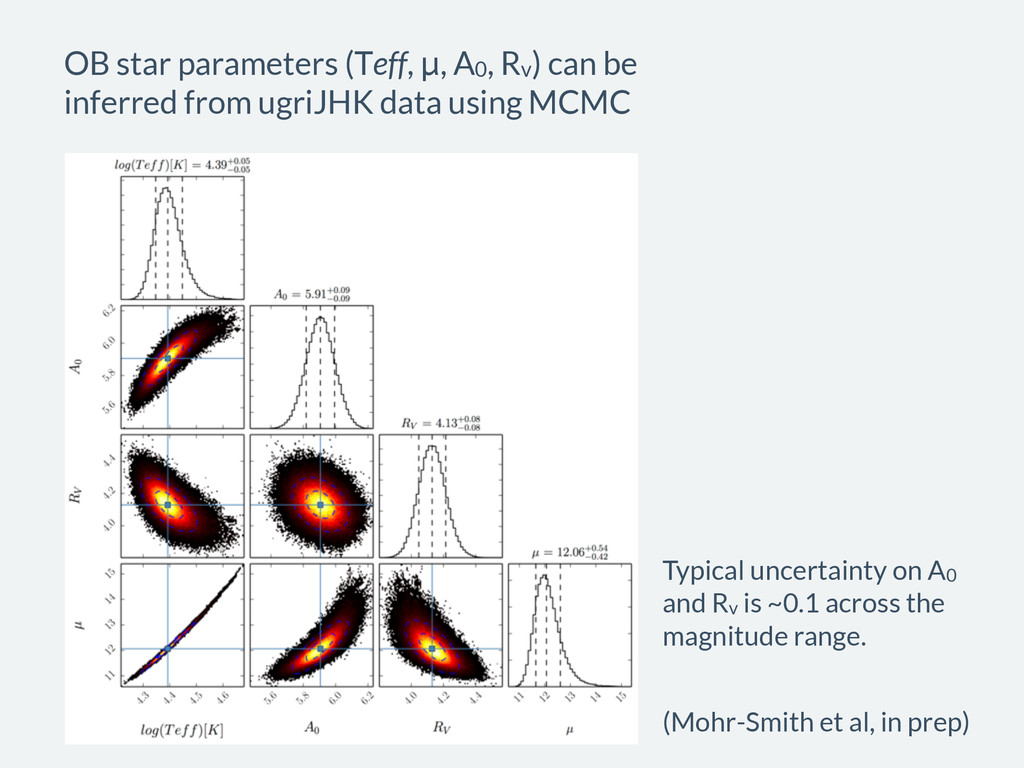
compute the full posteriors (e.g. using MCMC) P(Mass, Extinction | Data) P(Mass, Age | Data) For example, the posterior for a ~20th magnitude T Tauri star in NGC 2264:
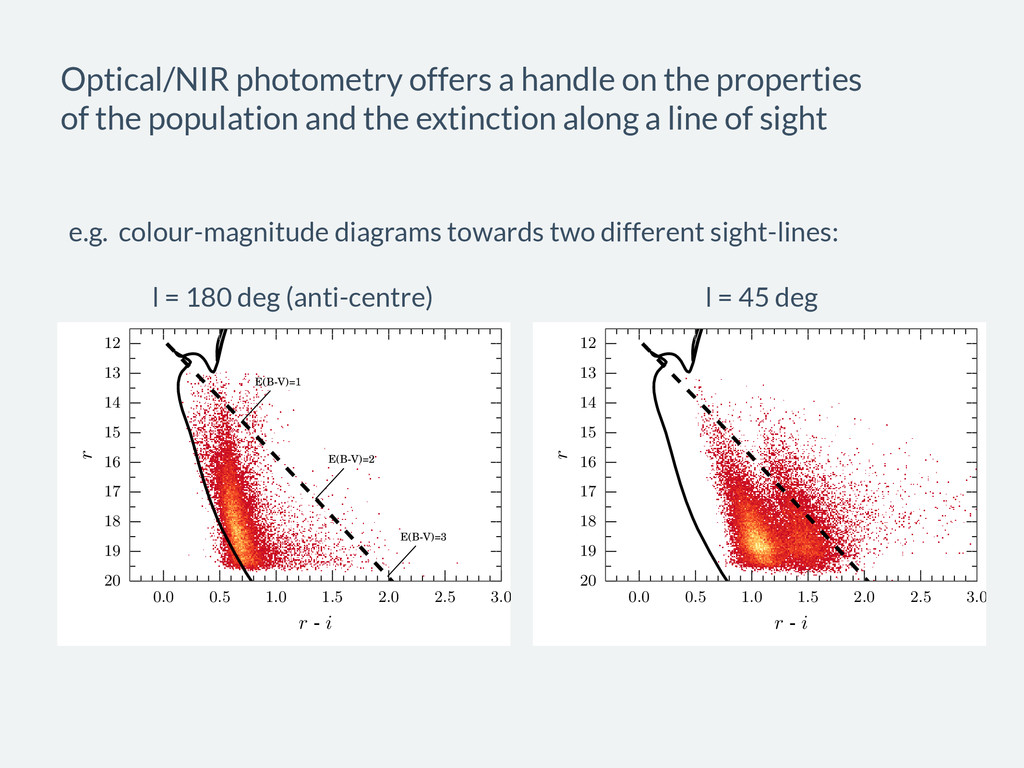
12 13 14 15 16 17 18 19 20 r 0.0 0.5 1.0 1.5 2.0 2.5 3.0 r - i 12 13 14 15 16 17 18 19 20 r E(B-V)=1 E(B-V)=2 E(B-V)=3 Optical/NIR photometry offers a handle on the properties of the population and the extinction along a line of sight l = 180 deg (anti-centre) l = 45 deg e.g. colour-magnitude diagrams towards two different sight-lines:
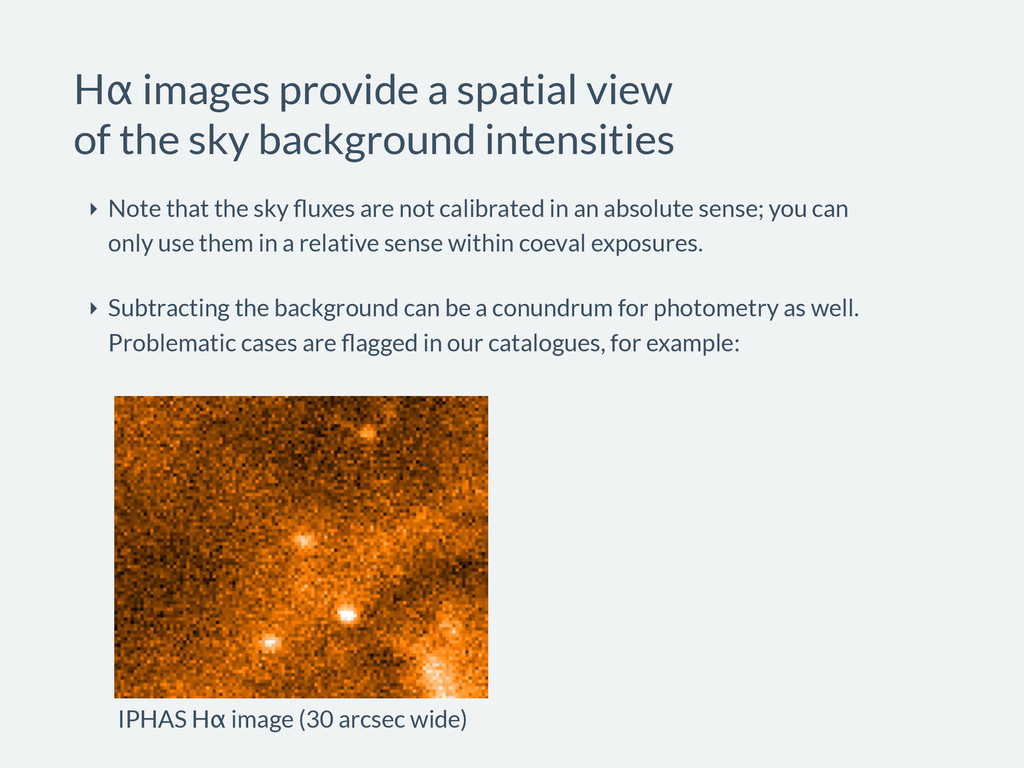
background intensities ‣ Note that the sky fluxes are not calibrated in an absolute sense; you can only use them in a relative sense within coeval exposures. ‣ Subtracting the background can be a conundrum for photometry as well. Problematic cases are flagged in our catalogues, for example: IPHAS Hα image (30 arcsec wide)
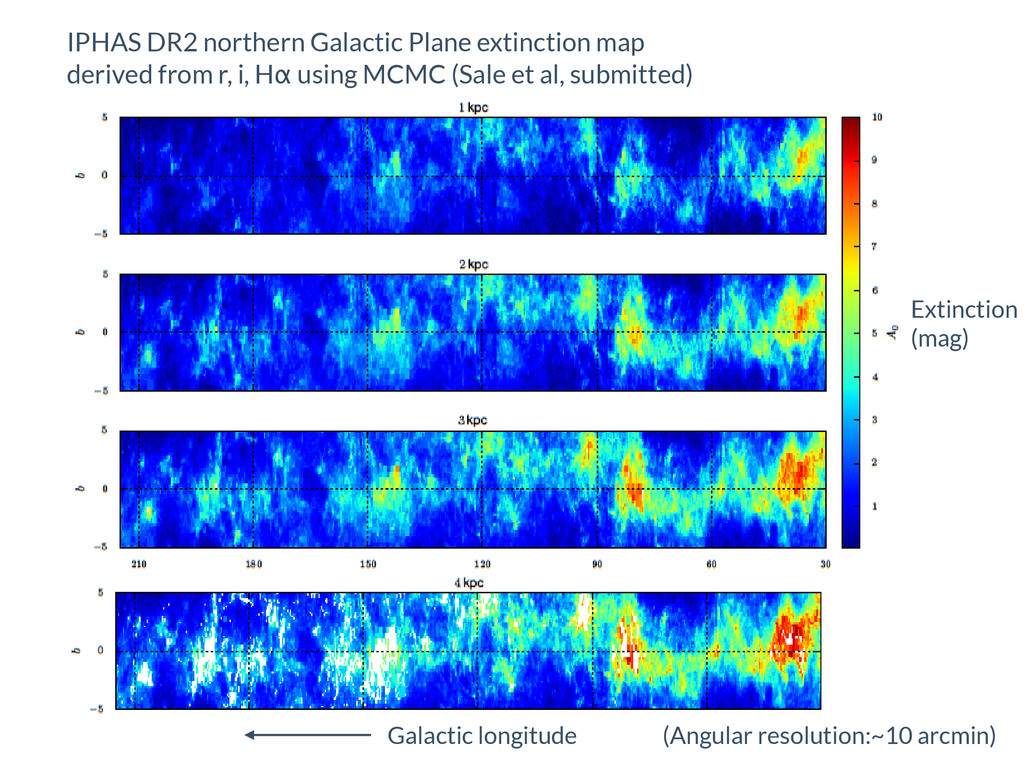
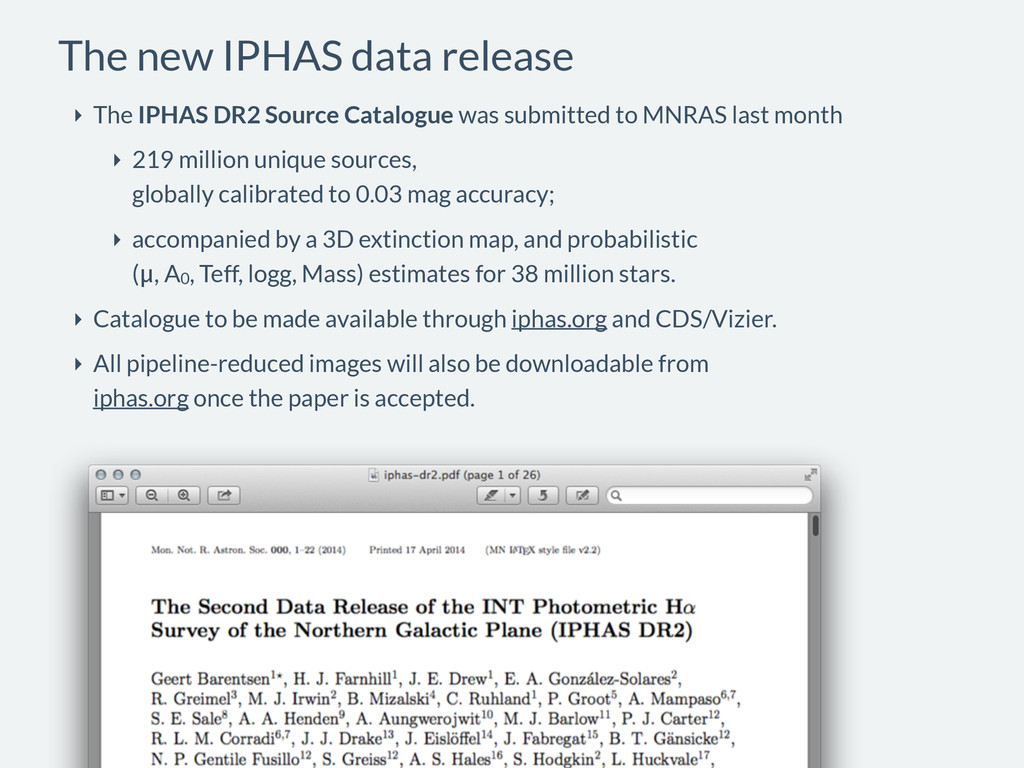
Catalogue was submitted to MNRAS last month ‣ 219 million unique sources, globally calibrated to 0.03 mag accuracy; ‣ accompanied by a 3D extinction map, and probabilistic (μ, A0, Teff, logg, Mass) estimates for 38 million stars. ‣ Catalogue to be made available through iphas.org and CDS/Vizier. ‣ All pipeline-reduced images will also be downloadable from iphas.org once the paper is accepted.
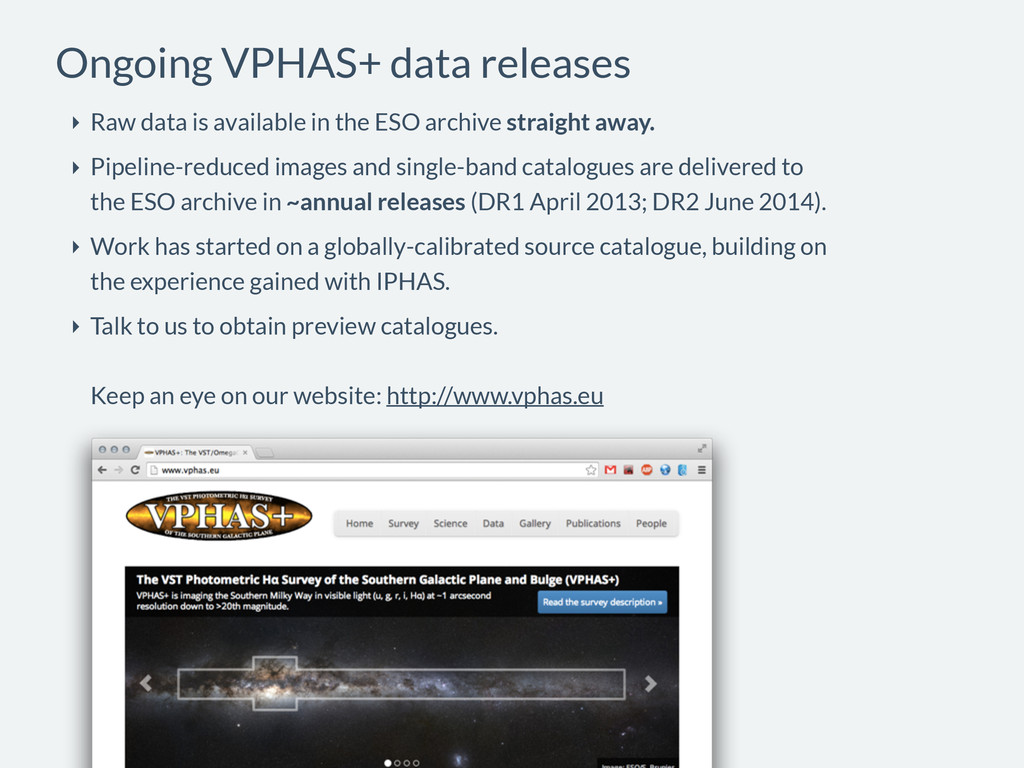
the ESO archive straight away. ‣ Pipeline-reduced images and single-band catalogues are delivered to the ESO archive in ~annual releases (DR1 April 2013; DR2 June 2014). ‣ Work has started on a globally-calibrated source catalogue, building on the experience gained with IPHAS. ‣ Talk to us to obtain preview catalogues. Keep an eye on our website: http://www.vphas.eu
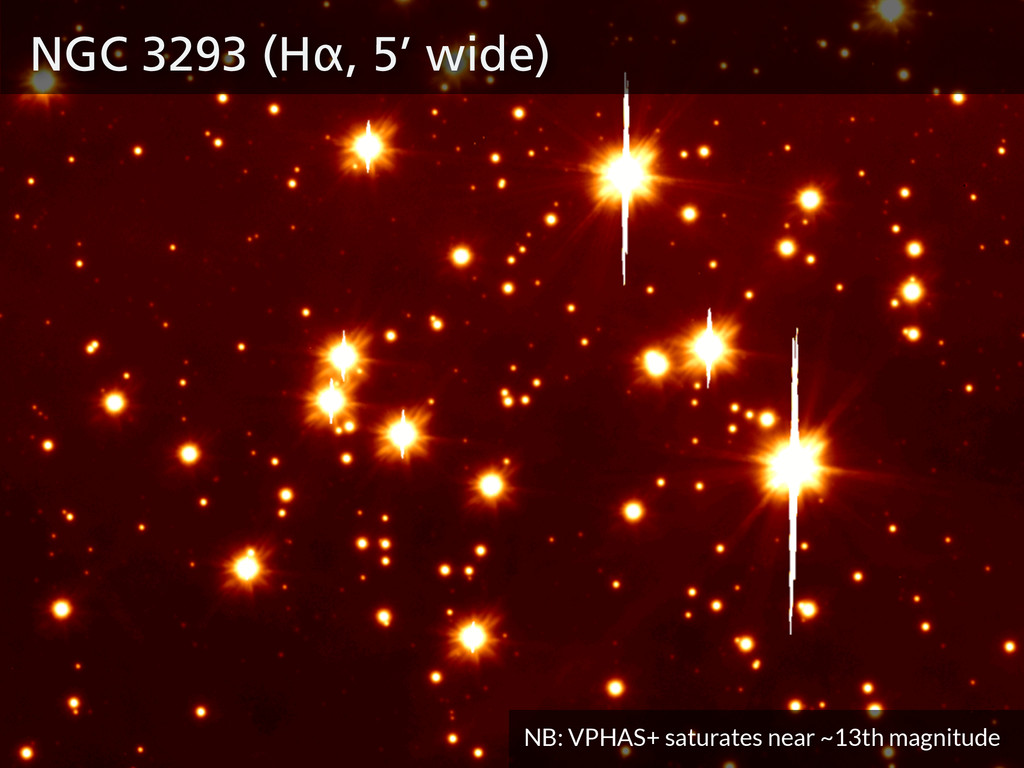
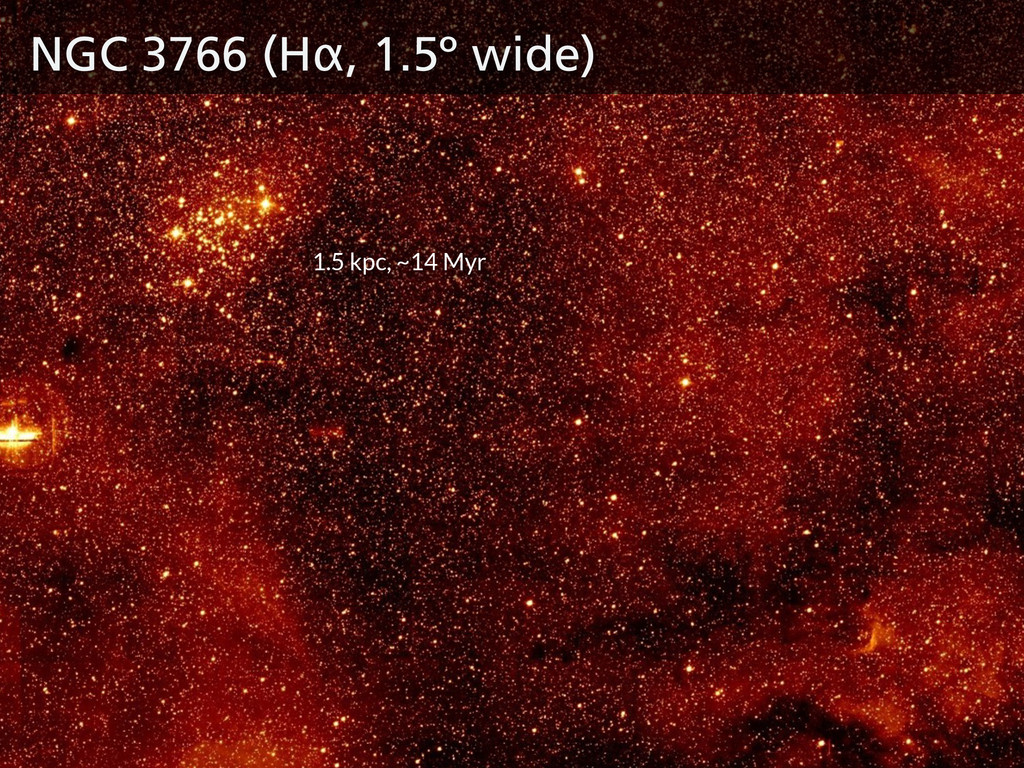
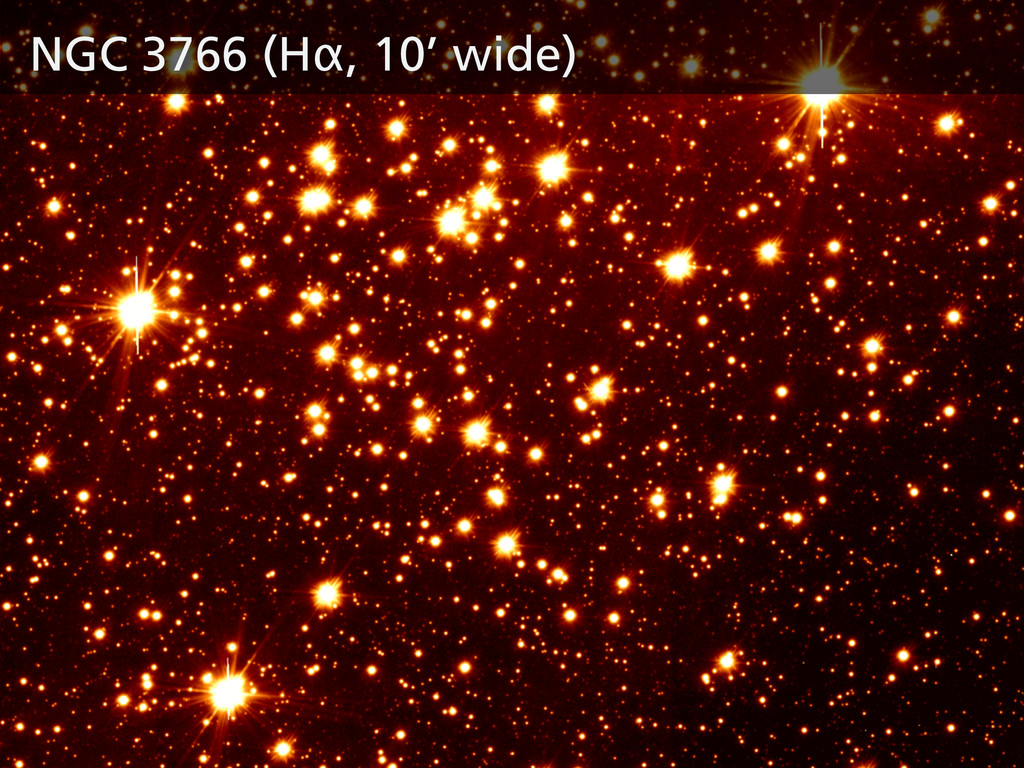
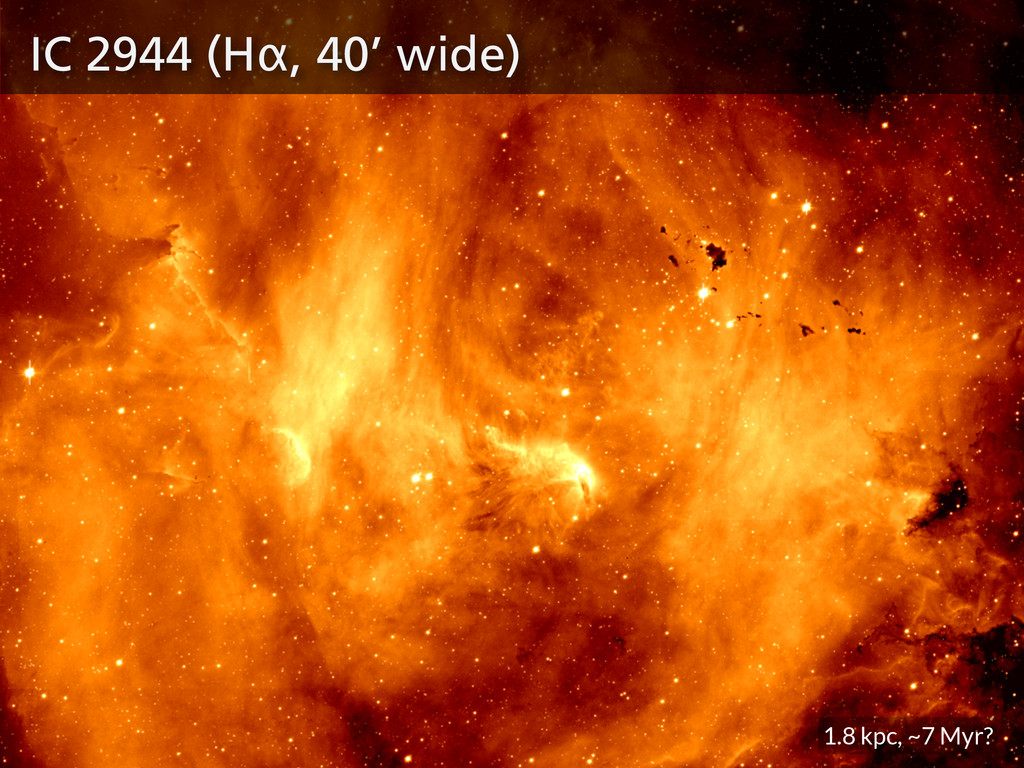
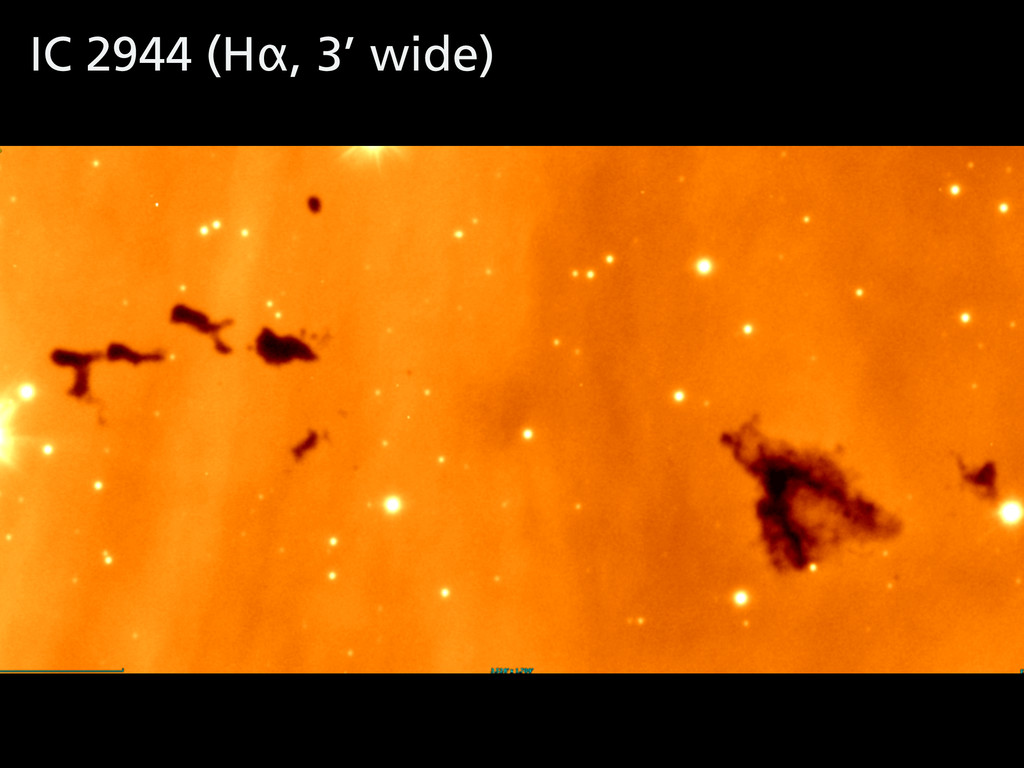
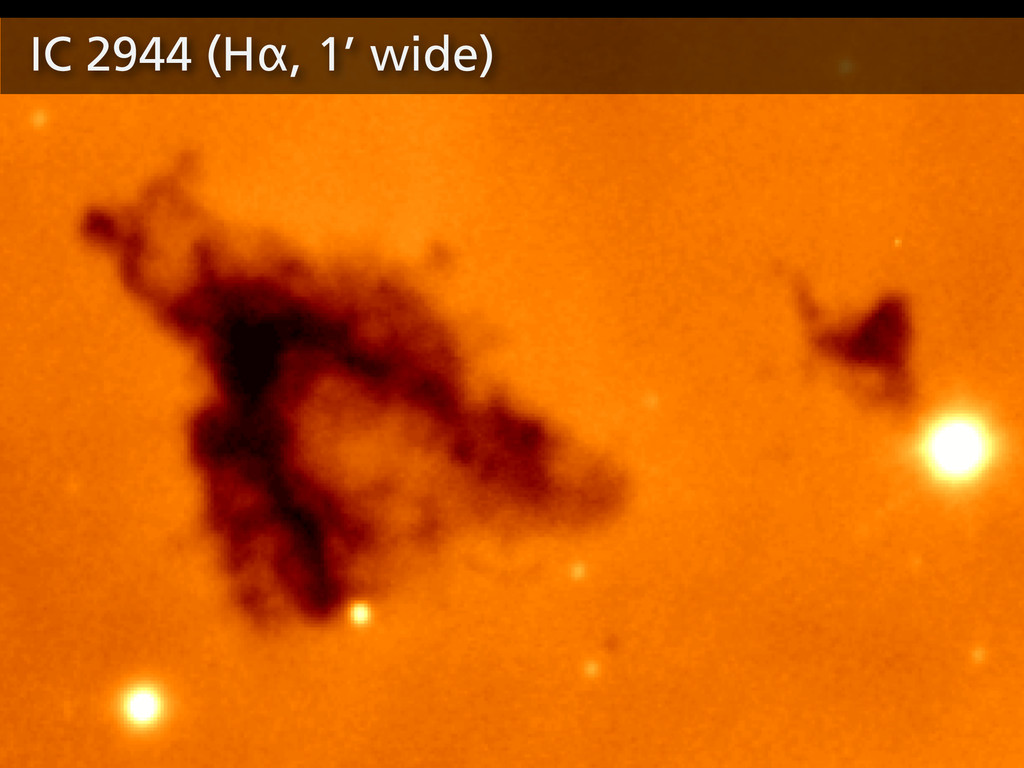
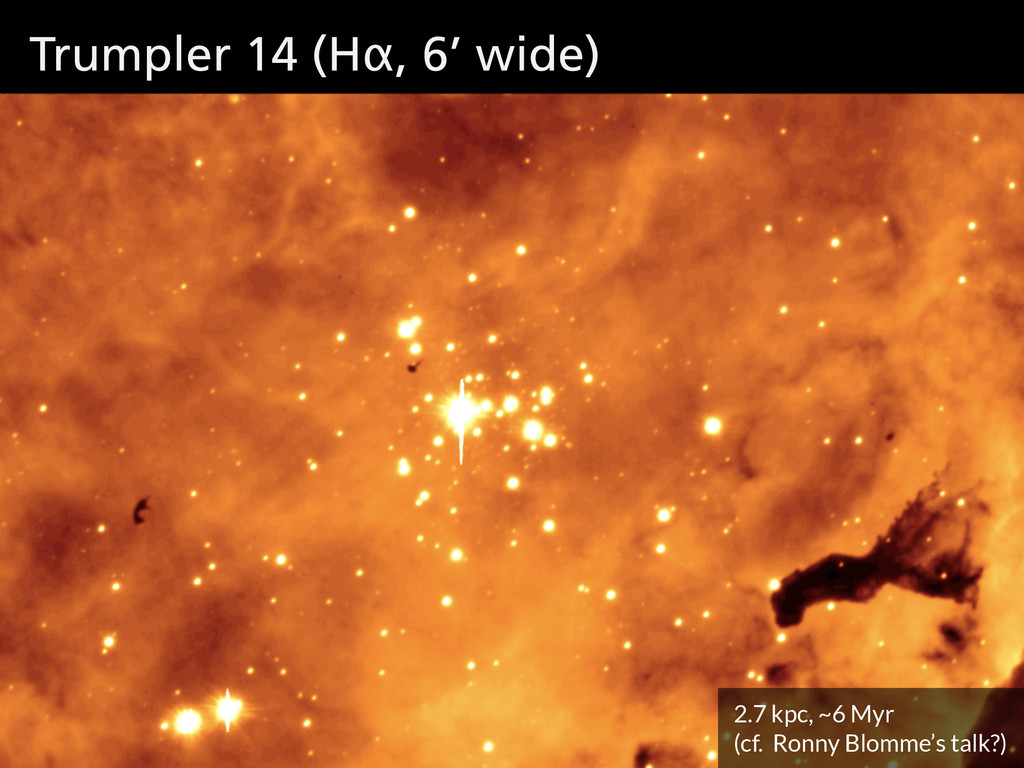
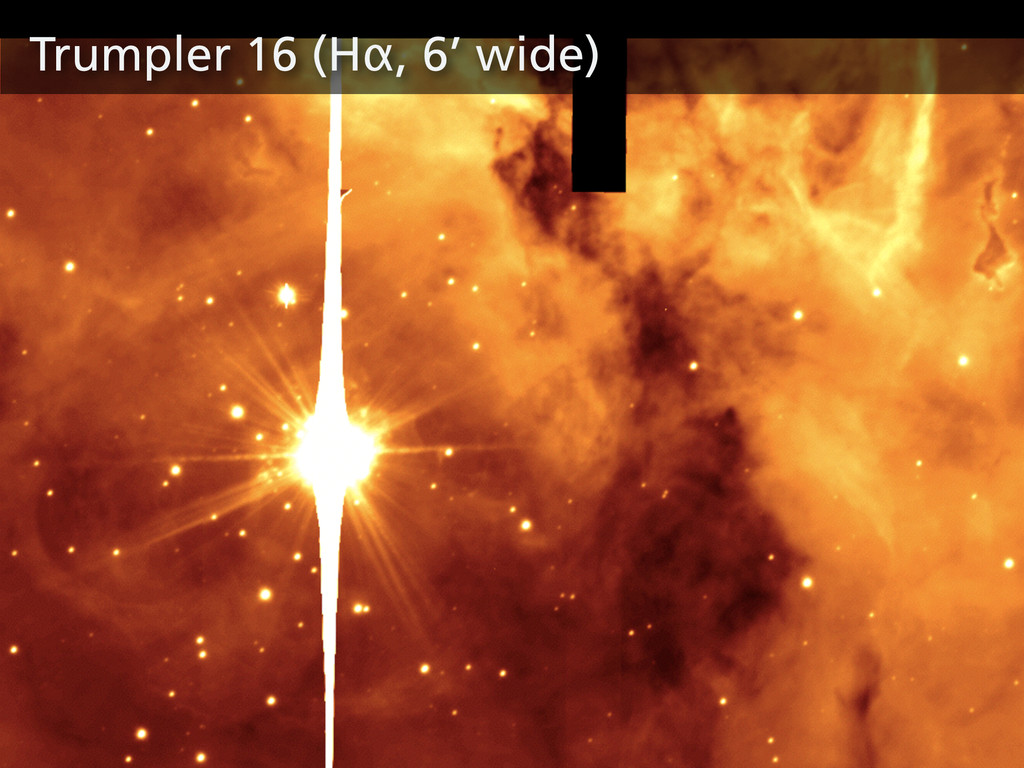
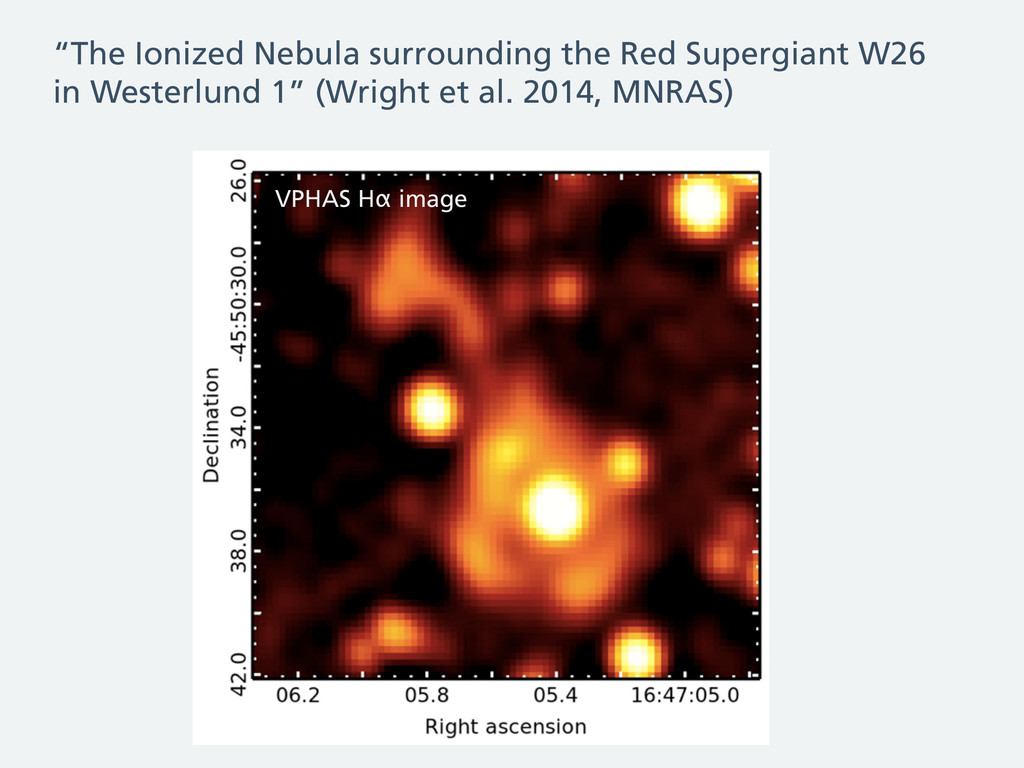
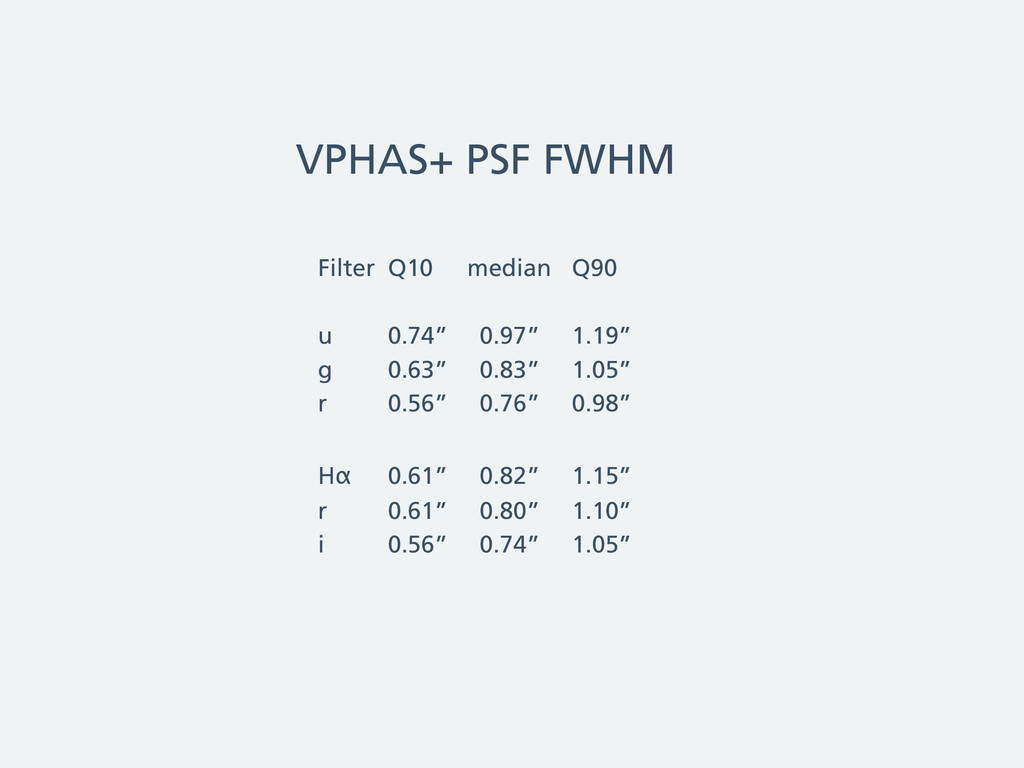
photometry down to ~21st magnitude. ‣ u- and Hα-band sensitivity, along with the excellent PSF quality, are the unique strengths. ‣ High-res Hα images provide contextual information on the morphology of star-forming regions. ‣ Major data releases are happening right now.
![Hi. I am Geert [ɣeːrt], a postdoc in Hertfordshire (UK)](https://files.speakerdeck.com/presentations/33f54390c350013147053ea215ba4b0b/slide_1.jpg)