UX IS ABOUT SATISFACTION.
UX IS DESIGNING FOR USER TO COME BACK THE SITE.
UX FOCUSES ON THE STRUCTURE & LAYOUT OF CONTENT, NAVIGATION AND HOW USERS INTERACT WITH THEM.
functionality. UX IS DESIGNING FOR USER TO COME BACK THE SITE. ps: I’m not talking about UI : ) UI is designing for customer to reach their goal when on site. UX FOCUSES ON THE STRUCTURE & LAYOUT OF CONTENT, NAVIGATION AND HOW USERS INTERACT WITH THEM. UI focuses on functionality with nice look and feel.
ROI, of doing user experience work. ROI BECAUSE UX MEASURES THE ROI OF USABILITY TO LOOK FOR; - more frequent visits to your Web site. - increased return visits to your site. - users staying longer on your site. - increased sales. - decreased user errors. - decreased customer support costs. - reduced word-of-mouth complaints.
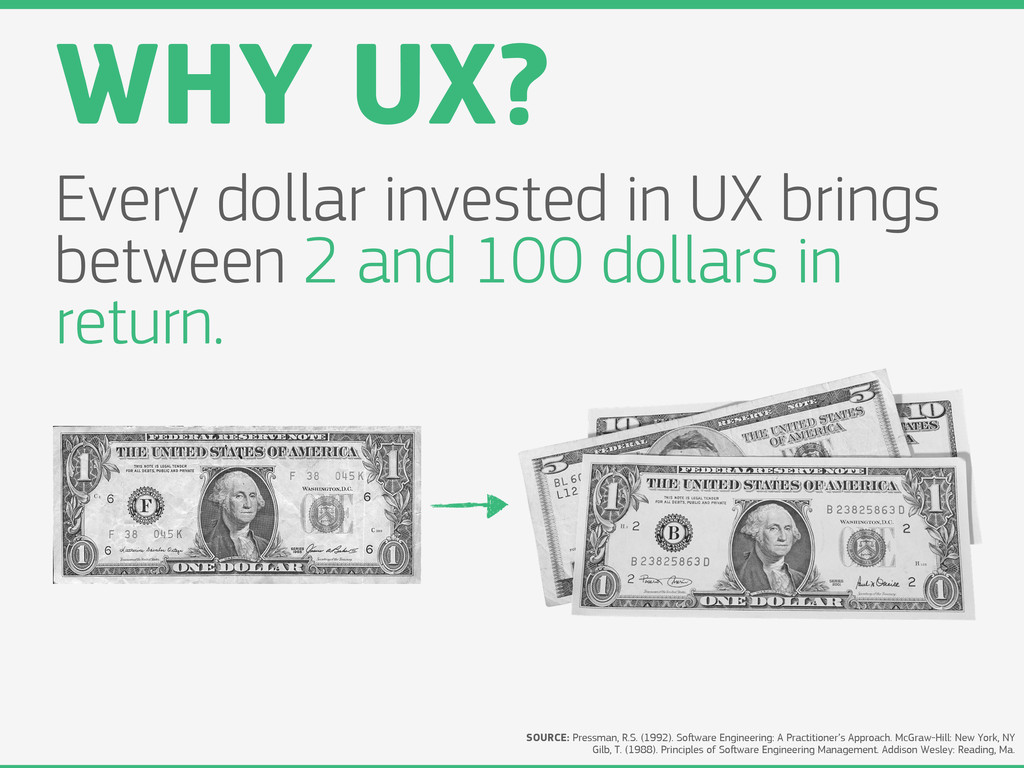
Approach. McGraw-Hill: New York, NY Gilb, T. (1988). Principles of Soſtware Engineering Management. Addison Wesley: Reading, Ma. Every dollar invested in UX brings between 2 and 100 dollars in return.
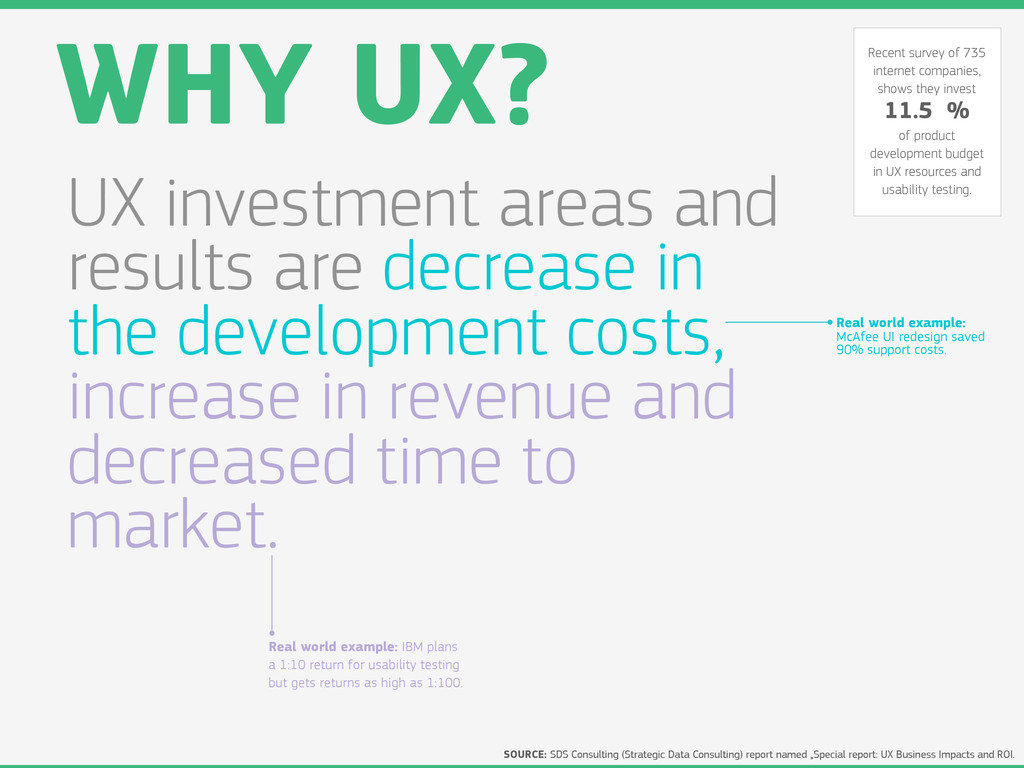
the development costs, increase in revenue and decreased time to market. SOURCE: SDS Consulting (Strategic Data Consulting) report named „Special report: UX Business Impacts and ROI. Recent survey of 735 internet companies, shows they invest 11.5 % of product development budget in UX resources and usability testing. Real world example: McAfee UI redesign saved 90% support costs. Real world example: IBM plans a 1:10 return for usability testing but gets returns as high as 1:100.
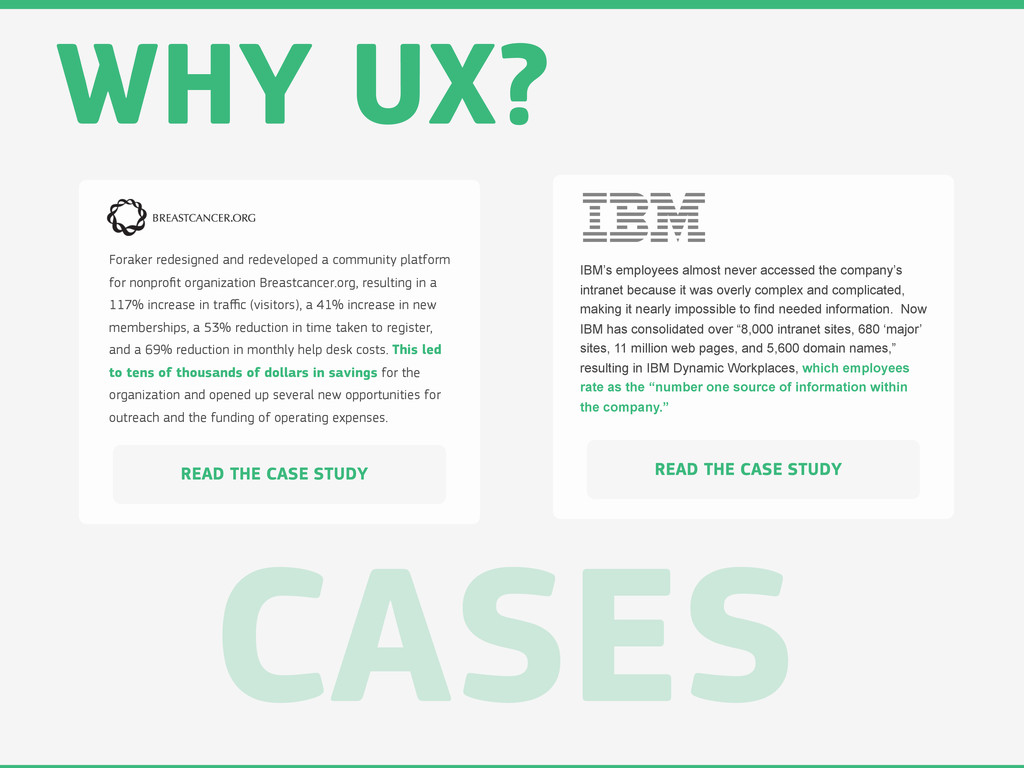
nonprofit organization Breastcancer.org, resulting in a 117% increase in traffic (visitors), a 41% increase in new memberships, a 53% reduction in time taken to register, and a 69% reduction in monthly help desk costs. This led to tens of thousands of dollars in savings for the organization and opened up several new opportunities for outreach and the funding of operating expenses. READ THE CASE STUDY IBM’s employees almost never accessed the company’s intranet because it was overly complex and complicated, making it nearly impossible to find needed information. Now IBM has consolidated over “8,000 intranet sites, 680 ‘major’ sites, 11 million web pages, and 5,600 domain names,” resulting in IBM Dynamic Workplaces, which employees rate as the “number one source of information within the company.” READ THE CASE STUDY CASES
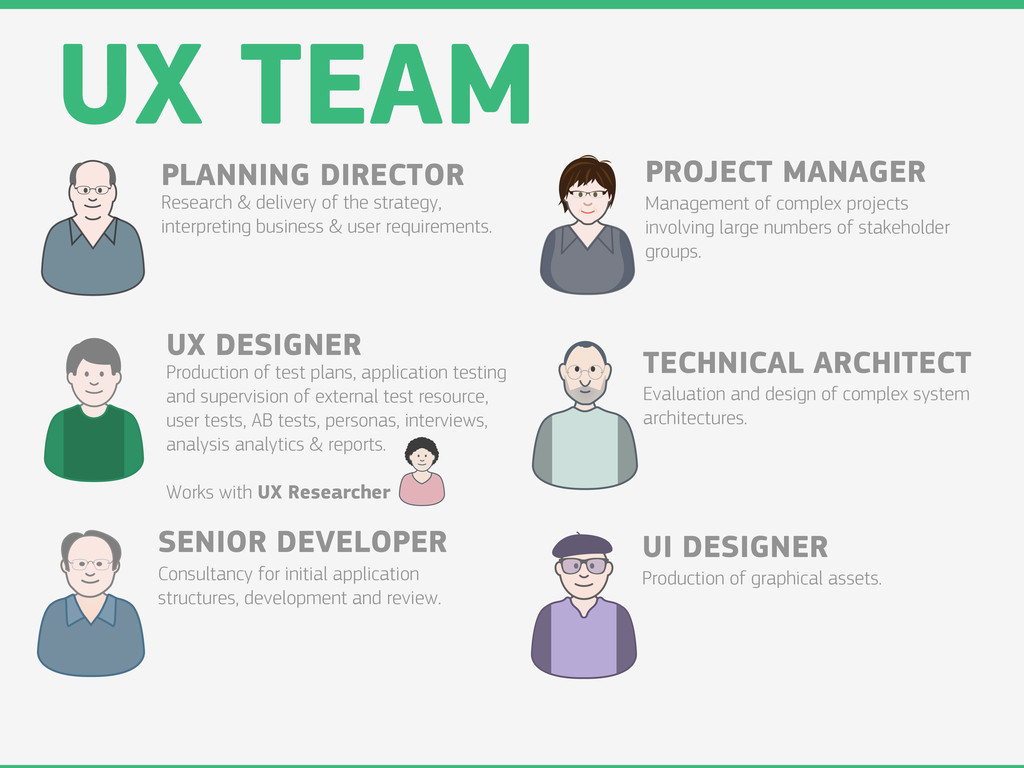
PLANNING DIRECTOR Research & delivery of the strategy, interpreting business & user requirements. Production of test plans, application testing and supervision of external test resource, user tests, AB tests, personas, interviews, analysis analytics & reports. Works with UX Researcher Evaluation and design of complex system architectures. Consultancy for initial application structures, development and review. Production of graphical assets. UX DESIGNER SENIOR DEVELOPER PROJECT MANAGER TECHNICAL ARCHITECT UI DESIGNER UX TEAM
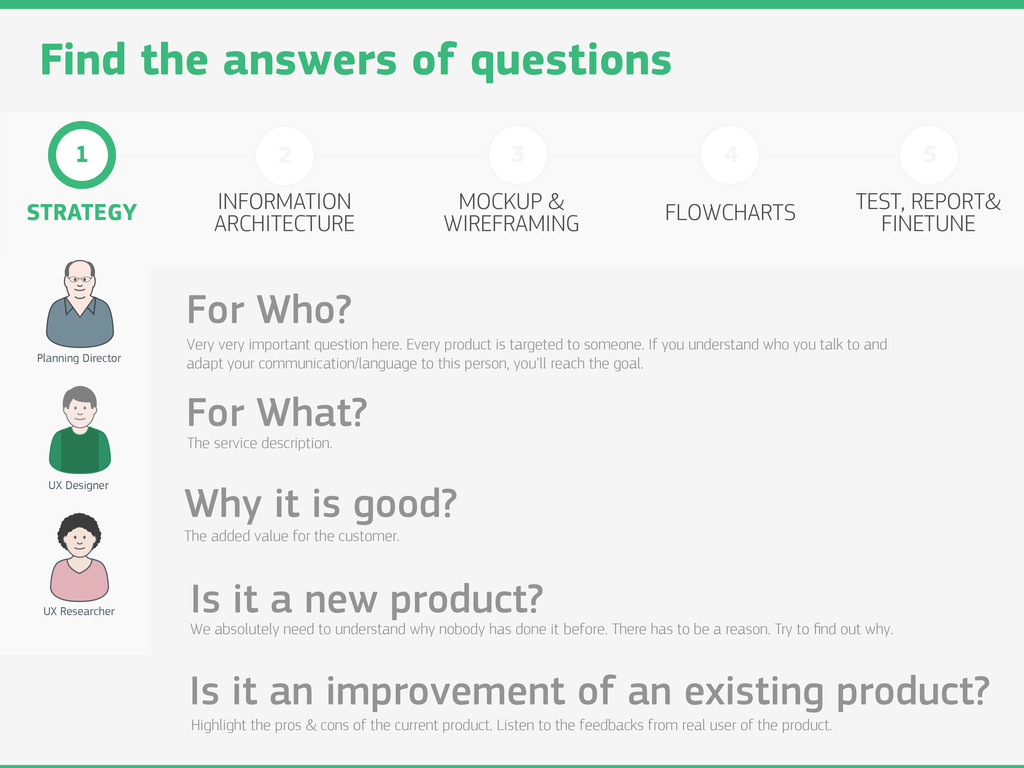
question here. Every product is targeted to someone. If you understand who you talk to and adapt your communication/language to this person, you’ll reach the goal. For What? The service description. Why it is good? The added value for the customer. Is it a new product? We absolutely need to understand why nobody has done it before. There has to be a reason. Try to find out why. Is it an improvement of an existing product? Highlight the pros & cons of the current product. Listen to the feedbacks from real user of the product. 1 2 3 4 5 STRATEGY INFORMATION ARCHITECTURE MOCKUP & WIREFRAMING FLOWCHARTS TEST, REPORT& FINETUNE UX Designer Planning Director UX Researcher
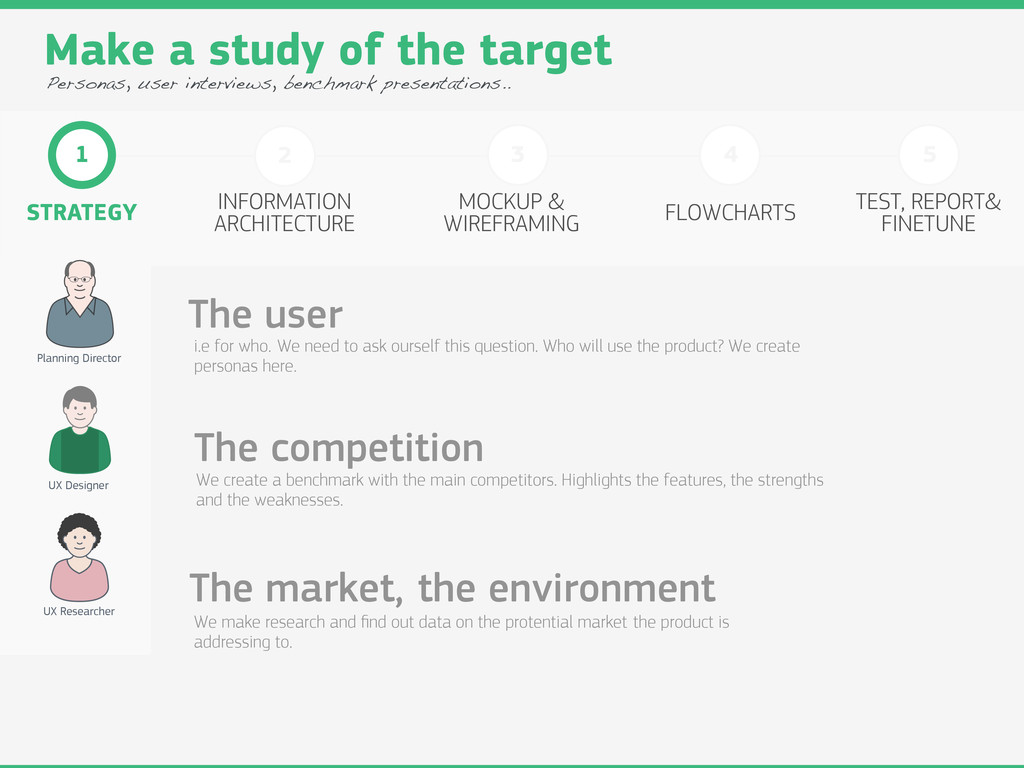
WIREFRAMING FLOWCHARTS TEST, REPORT& FINETUNE Personas, user interviews, benchmark presentations.. Make a study of the target The market, the environment We make research and find out data on the protential market the product is addressing to. The competition We create a benchmark with the main competitors. Highlights the features, the strengths and the weaknesses. i.e for who. We need to ask ourself this question. Who will use the product? We create personas here. The user UX Designer Planning Director UX Researcher
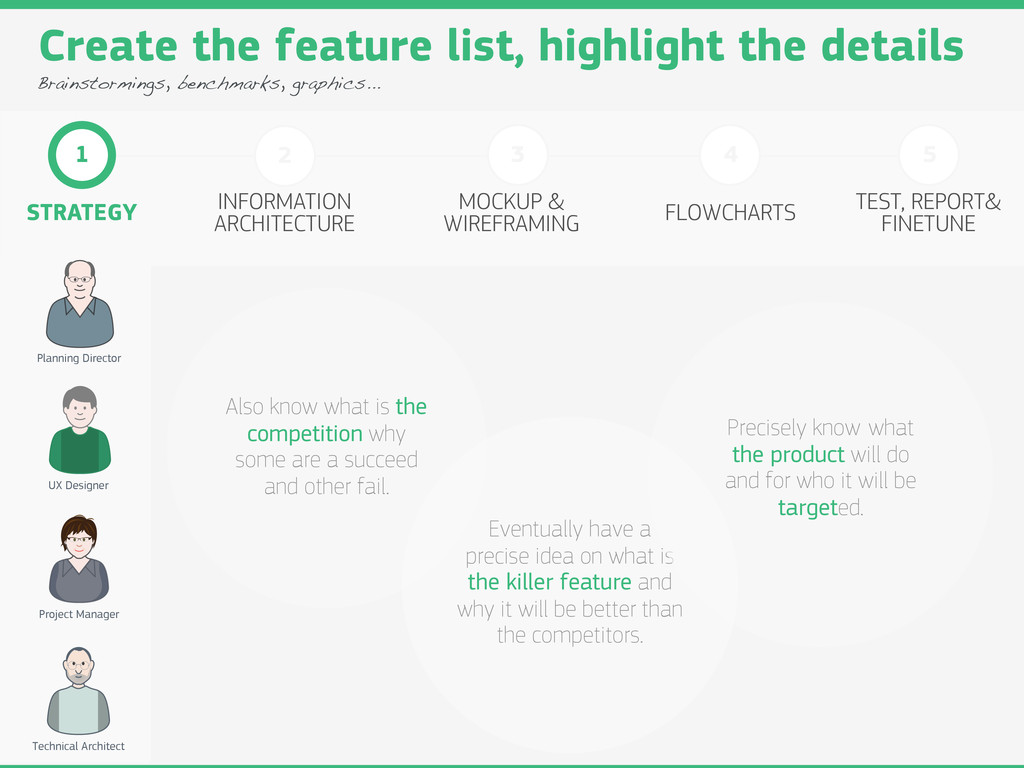
MOCKUP & WIREFRAMING FLOWCHARTS TEST, REPORT& FINETUNE Planning Director Project Manager Technical Architect Create the feature list, highlight the details Brainstormings, benchmarks, graphics... Eventually have a precise idea on what is the killer feature and why it will be better than the competitors. Precisely know what the product will do and for who it will be targeted. Also know what is the competition why some are a succeed and other fail.
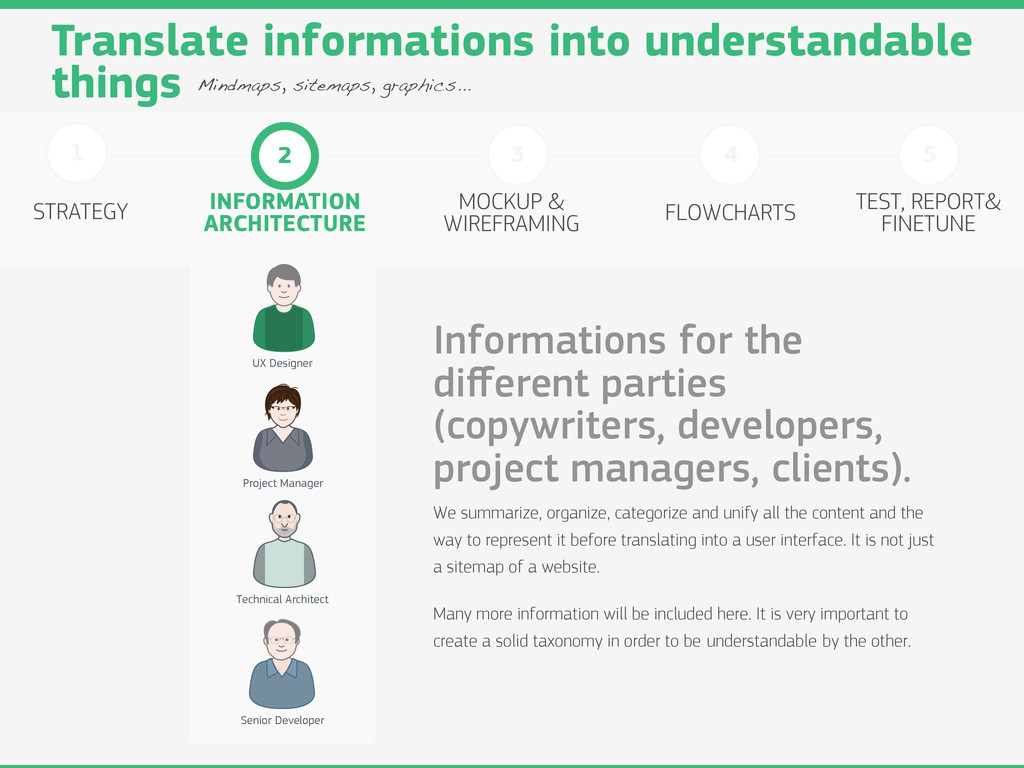
TEST, REPORT& FINETUNE 1 STRATEGY UX Designer Project Manager Technical Architect Senior Developer Translate informations into understandable things Mindmaps, sitemaps, graphics... Informations for the different parties (copywriters, developers, project managers, clients). We summarize, organize, categorize and unify all the content and the way to represent it before translating into a user interface. It is not just a sitemap of a website. Many more information will be included here. It is very important to create a solid taxonomy in order to be understandable by the other.
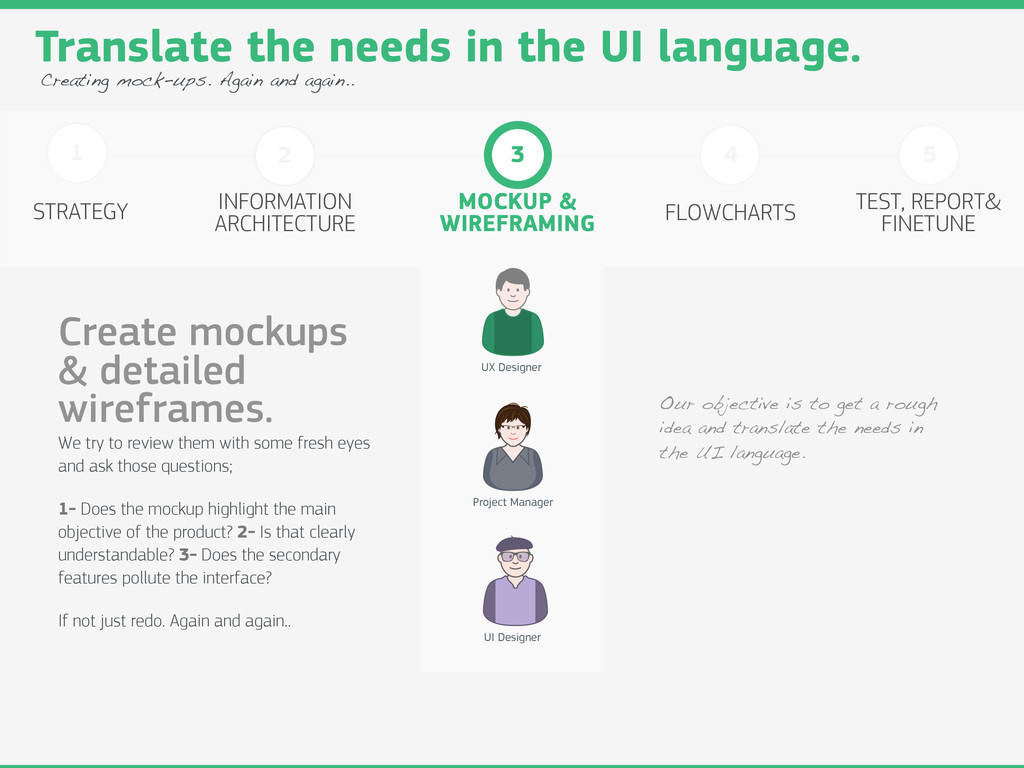
TEST, REPORT& FINETUNE 1 STRATEGY UX Designer Project Manager UI Designer Creating mock-ups. Again and again.. Translate the needs in the UI language. Create mockups & detailed wireframes. We try to review them with some fresh eyes and ask those questions; 1- Does the mockup highlight the main objective of the product? 2- Is that clearly understandable? 3- Does the secondary features pollute the interface? If not just redo. Again and again.. Our objective is to get a rough idea and translate the needs in the UI language.
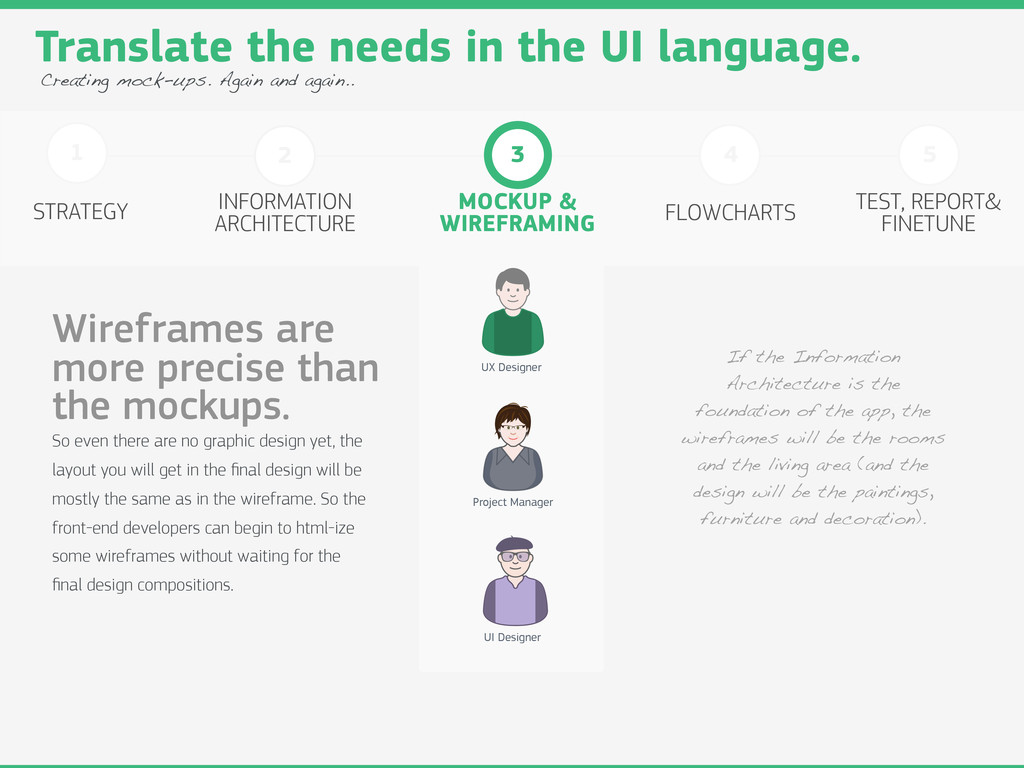
TEST, REPORT& FINETUNE 1 STRATEGY UX Designer Project Manager UI Designer Creating mock-ups. Again and again.. Translate the needs in the UI language. Wireframes are more precise than the mockups. So even there are no graphic design yet, the layout you will get in the final design will be mostly the same as in the wireframe. So the front-end developers can begin to html-ize some wireframes without waiting for the final design compositions. If the Information Architecture is the foundation of the app, the wireframes will be the rooms and the living area (and the design will be the paintings, furniture and decoration).
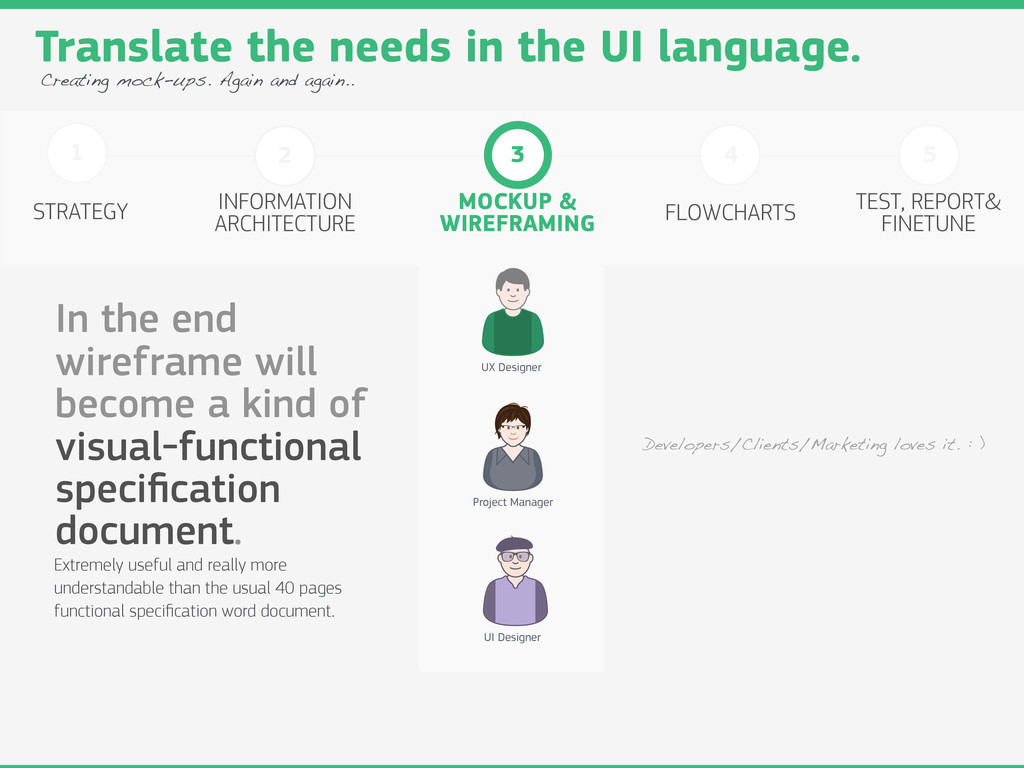
TEST, REPORT& FINETUNE 1 STRATEGY UX Designer Project Manager UI Designer Creating mock-ups. Again and again.. Translate the needs in the UI language. In the end wireframe will become a kind of visual-functional specification document. Extremely useful and really more understandable than the usual 40 pages functional specification word document. Developers/Clients/Marketing loves it. : )
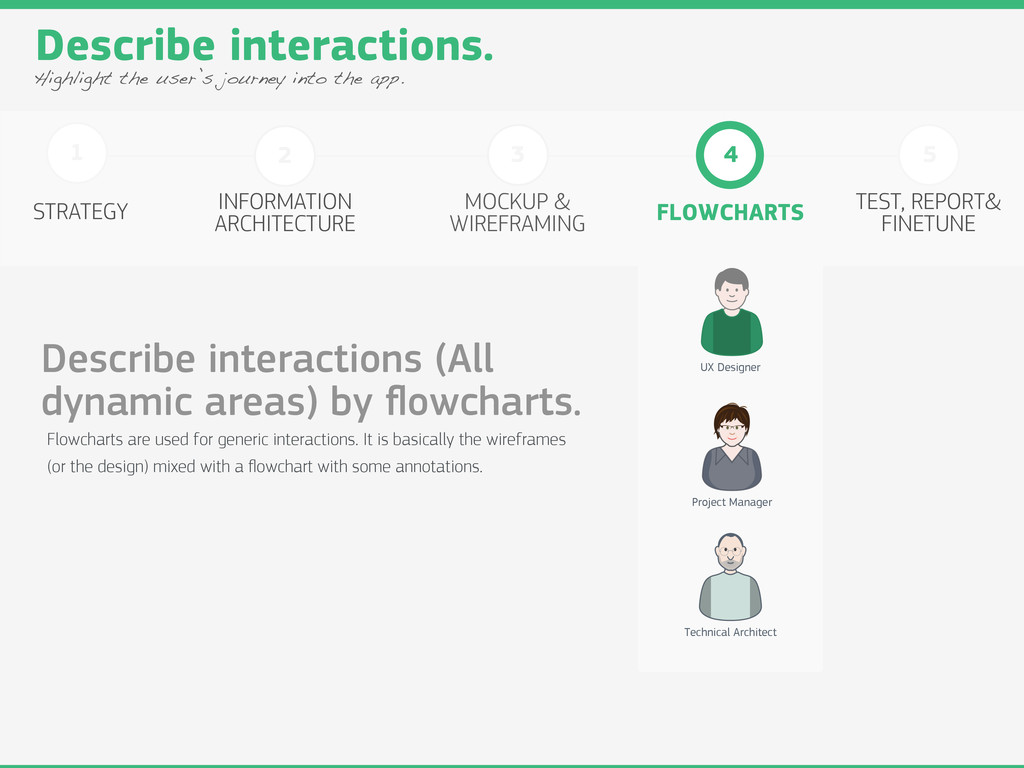
TEST, REPORT& FINETUNE 1 STRATEGY UX Designer Project Manager Technical Architect Highlight the user’s journey into the app. Describe interactions (All dynamic areas) by flowcharts. Flowcharts are used for generic interactions. It is basically the wireframes (or the design) mixed with a flowchart with some annotations. Describe interactions.
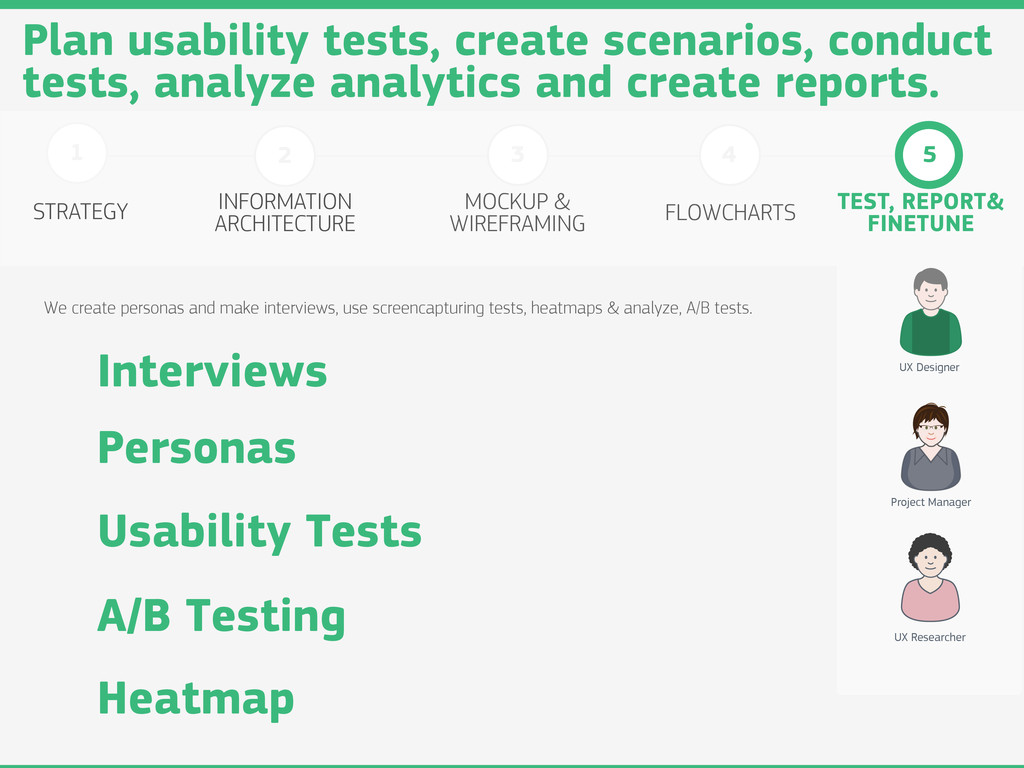
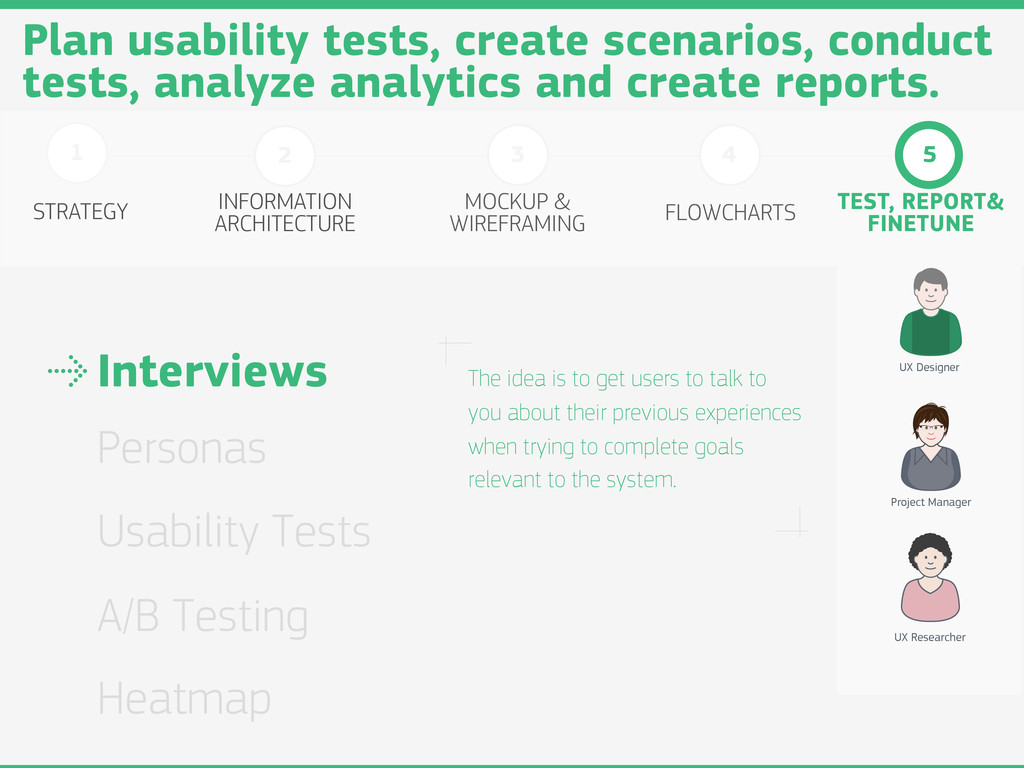
TEST, REPORT& FINETUNE 1 STRATEGY UX Designer Project Manager Personas Heatmap Usability Tests Interviews A/B Testing Plan usability tests, create scenarios, conduct tests, analyze analytics and create reports. UX Researcher The idea is to get users to talk to you about their previous experiences when trying to complete goals relevant to the system.
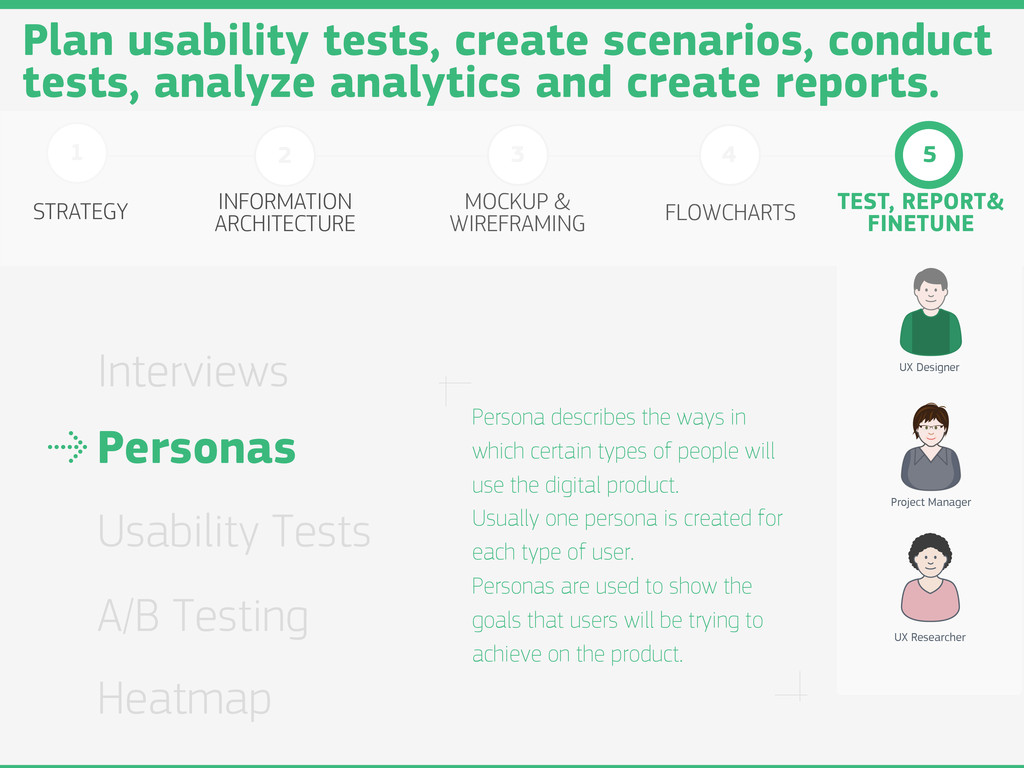
TEST, REPORT& FINETUNE 1 STRATEGY UX Designer Project Manager Personas Heatmap Usability Tests Interviews A/B Testing Plan usability tests, create scenarios, conduct tests, analyze analytics and create reports. UX Researcher Persona describes the ways in which certain types of people will use the digital product. Usually one persona is created for each type of user. Personas are used to show the goals that users will be trying to achieve on the product.
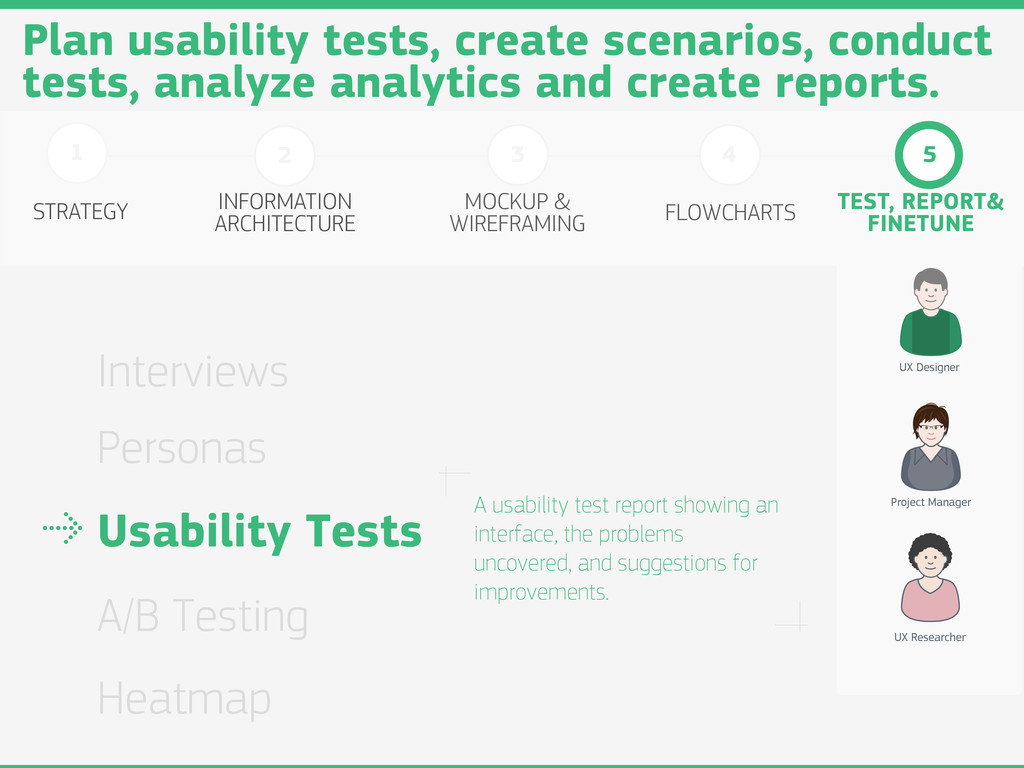
TEST, REPORT& FINETUNE 1 STRATEGY UX Designer Project Manager Personas Heatmap Usability Tests Interviews A/B Testing Plan usability tests, create scenarios, conduct tests, analyze analytics and create reports. UX Researcher A usability test report showing an interface, the problems uncovered, and suggestions for improvements.
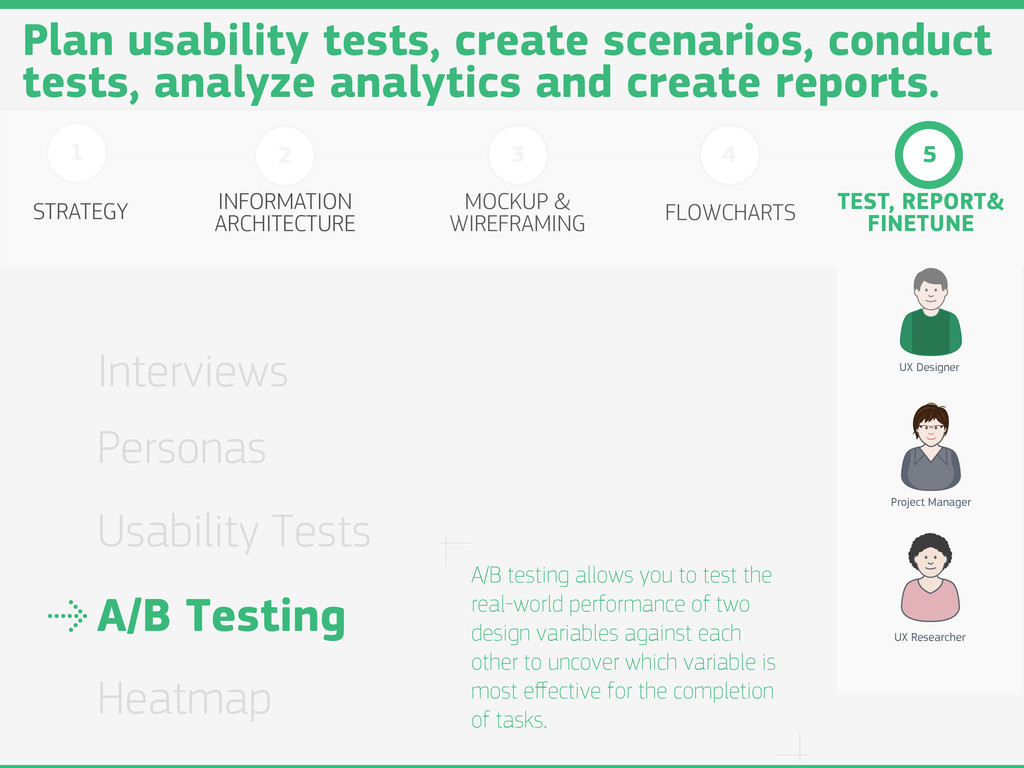
TEST, REPORT& FINETUNE 1 STRATEGY UX Designer Project Manager Personas Heatmap Usability Tests Interviews A/B Testing Plan usability tests, create scenarios, conduct tests, analyze analytics and create reports. UX Researcher A/B testing allows you to test the real-world performance of two design variables against each other to uncover which variable is most effective for the completion of tasks.
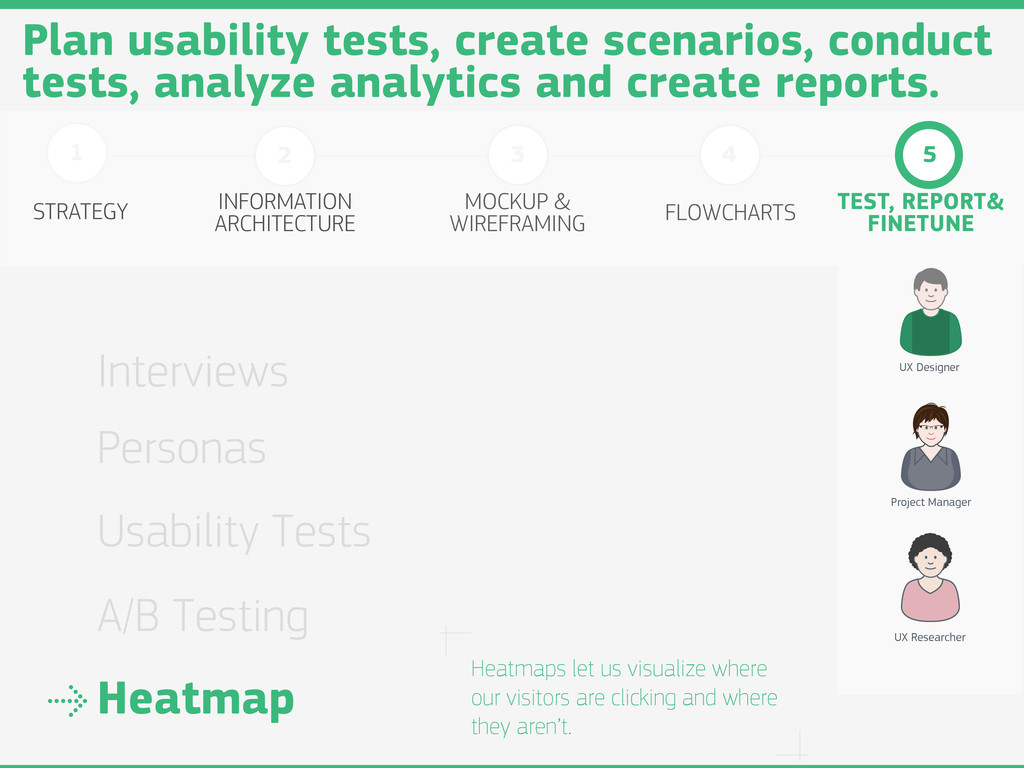
TEST, REPORT& FINETUNE 1 STRATEGY UX Designer Project Manager Personas Heatmap Usability Tests Interviews A/B Testing Plan usability tests, create scenarios, conduct tests, analyze analytics and create reports. UX Researcher Heatmaps let us visualize where our visitors are clicking and where they aren’t.