Upgrade to Pro — share decks privately, control downloads, hide ads and more …

Staggeringly Large File Systems

Staggeringly Large File Systems

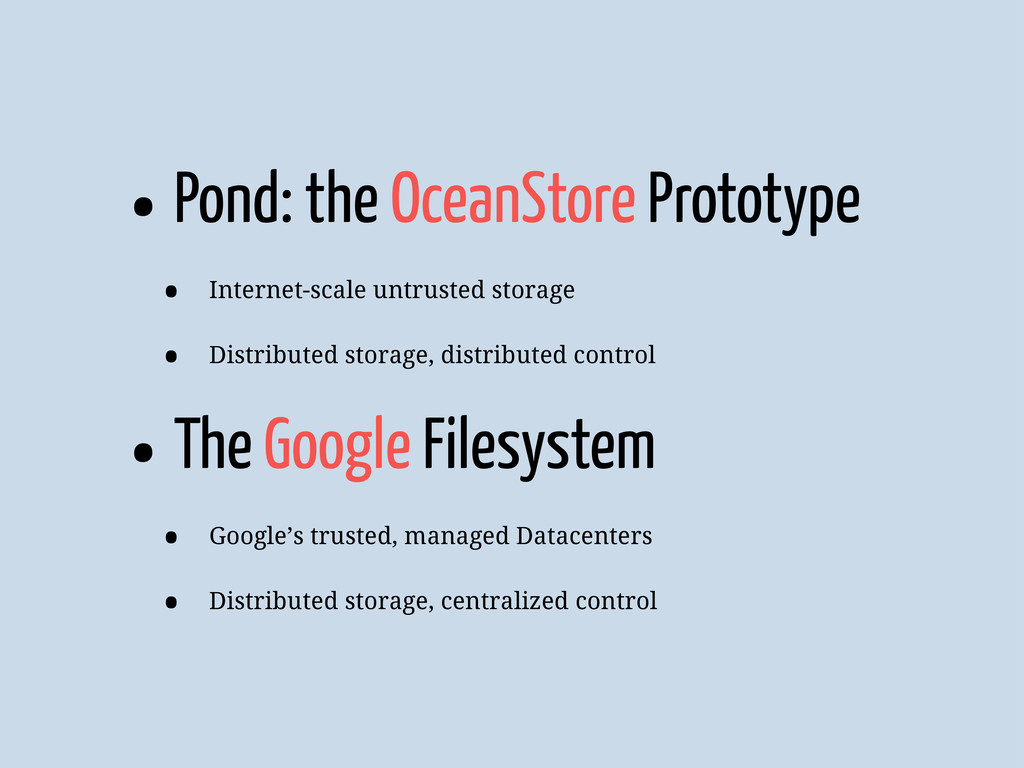
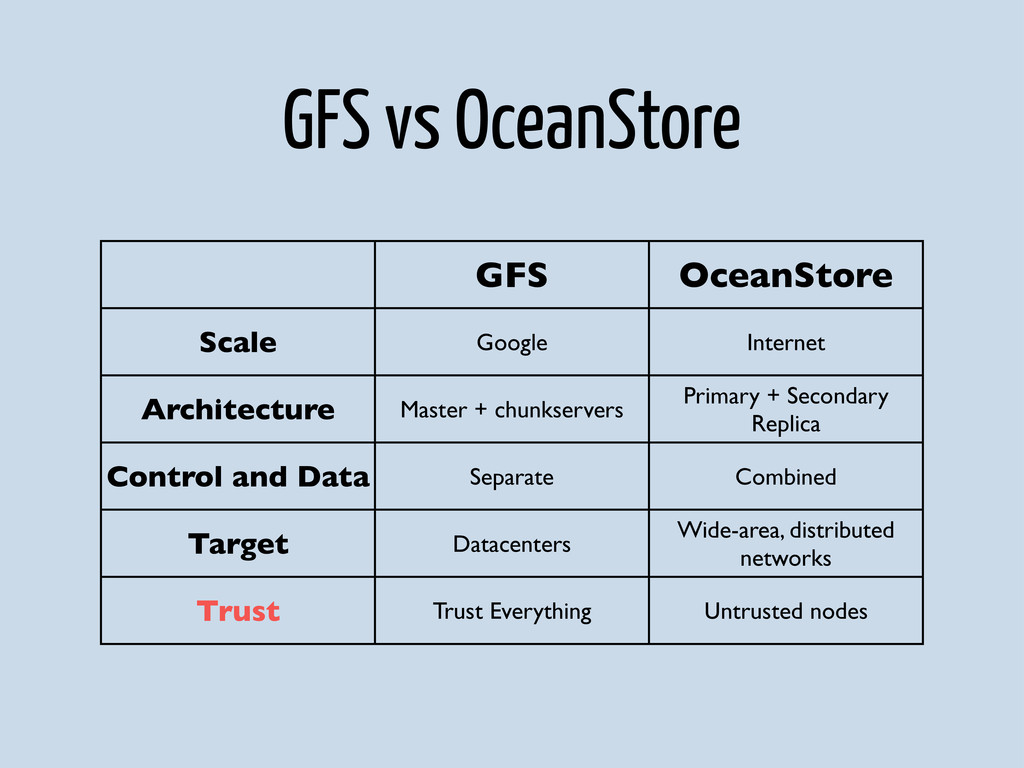
Describing and comparing two massively distributed file-systems: the Google File System and the OceanStore Prototype file system (named Pond). All content is based on the papers published for both projects in 2003. Images are taken from the papers and hence their copyright restrictions apply.

Avatar for Shrutarshi Basu

Shrutarshi Basu

October 27, 2011
Tweet

Other Decks in Research

Transcript

  1. Motivations • LOTS of data to store • Storage must

    be reliable and available • Lots of cheap distributed storage • High bandwidth data links
  2. •Pond: the OceanStore Prototype • Internet-scale untrusted storage • Distributed

    storage, distributed control •The Google Filesystem • Google’s trusted, managed Datacenters • Distributed storage, centralized control
  3. GFS vs OceanStore GFS OceanStore Scale Google Internet Architecture Master

    + chunkservers Primary + Secondary Replica Control and Data Separate Combined Target Datacenters Wide-area, distributed networks Trust Trust Everything Untrusted nodes
  4. Pond The OceanStore Prototype Sean Rhea, Patrick Eaton, Dennis Geels,

    Hakim Weatherspoon, Ben Zhao, John Kubiatowicz
  5. Outline • Problems and Assumptions • Data Model • System

    Architecture • Pond Prototype • Evaluation
  6. 1 1 1 2 2 2 2 2 2 2

    3 3 3 3 3 3 3
  7. OceanStore Principles • The unit of storage is the data

    object • Information must be universally accessible • Balance between the shared and the private • Consistency, Performance and Durability • Privacy complements integrity
  8. Description ash of a block of data e root block

    of a version mplete stream of versions e Identifiers (GUIDs). thout warning. Such n difficult for admin- , the system must be deally, it will be self- level of adaptability olerate faults and dy- ze this redundancy. then, is to design a sive storage interface durability atop an un- se. In this paper, we otype. This prototype ntial to a full system; ation and routing in- ates new replicas of erns, it utilizes fault- vices, and it durably . Most importantly, ete implementation of easonable estimate of indirect blocks data blocks root block backpointer AGUID VGUID VGUID copy on write copy on write i i+1 M 3 d d 7 d 5 4 d 2 d d 1 d 6 d d6 ’ ’ 7 M Figure 1: A data object is a sequence of read-only versions, collectively named by an active GUID, or AGUID. Each ver- sion is a B-tree of read-only blocks; child pointers are secure hashes of the blocks to which they point and are called block GUIDs. User data is stored in the leaf blocks. The block GUID of the top block is called the version GUID, or VGUID. Here, in version , only data blocks 6 and 7 were changed from version , so only those two new blocks (and their new parents) are added to the system; all other blocks are simply referenced by the same BGUIDs as in the previous version. cation model. As an additional benefit, it allows for time travel, as popularized by Postgres [34] and the Elephant File System [30]; users can view past versions of a file or Storage Organization
  9. Application-specific Consistency • An update adds a version to the

    head of an update stream • Updates are applied atomically • Updates are: • an array of potential actions • each action is guarded by a predicate • Support a variety of consistency semantics • No support for explicit locks; reliance on atomic update model instead
  10. System Architecture • Unit of synchronization is the data object

    • Changes to different objects are independent
  11. Virtualization through Tapestry • Resources are identified by a GUID

    • Not tied to any particular hardware • Tapestry is a decentralized object location and routing system • Objects addressed via GUID, not IP • Tapestry routes messages to a physical host containing a resource with matching GUID
  12. Replication and Consistency • Hosts publish BGUIDs of blocks they

    store • Primary-copy replication • Digital Certificates: Heartbeats • Let’s take a closer look at primary replicas
  13. Primary Replicas • Primary Replica is a virtual resource •

    The Inner Ring is a small set of servers • A Byzantine fault-tolerance protocol • Push based update of secondaries • Application level multicast tree
  14. Primary Replicas Continued • (3f + 1) servers, at most

    f may fail • Use public key cryptography to communicate outside the Inner Ring • Secondaries can locally verify authenticity • Updates without authenticating individually • Proactive threshold signatures and the responsible parties
  15. Storage and Caching • Durability: • Erasure codes achieve higher

    fault tolerance for the same additional cost • New blocks are erasure code and fragments are distributed across Tapestry • Performance (whole block caching): • First hosts retrieves and combines fragments • First host publishes the cached block • Second host finds the cached copy
  16. App App Tarchive (Inner Ring) Primary Replica Replica Secondary Replica

    Secondary Replica Secondary Thop T req Tagree Tdisseminate Time Archive Figure 2: The path of an OceanStore update. An update pro- ceeds from the client to the primary replica for its target data object. There, it is serialized with other updates and applied to that target. A heartbeat is generated, certifying the new latest version, and multicast along with the update down the dissem- ination tree to other replicas. Simultaneously, the new version is erasure-coded and sent to archival storage servers. 3.6 The Pri Section 3.2 show assigned an inne object’s primary updates and crea rent writes, enfo cates, and sign a To construct manner, we adap oped by Castro a distributed decis ticipants reach t two-thirds of th rectly. That is, than servers m fail arbitrarily: t or deliberately t nately, Byzantin sages quadratic i feasible for use i Full Update Path
  17. ts of the imple- e ways in which Event-Driven Ar-

    search indicates gracefully under echanisms [39]. s a stage, a self- and thread pool. sending events. ond and their in- required for all dded or removed eft are necessary s on the right are nes. ns approximately Inner Ring Update Object Agreement Init Aggrement Exec Read Object Get Heartbeat Applications OSRead OSWrite OSCreate Byzantine Agreement Preprepare Prepare Commit Disseminate Frags Generate Frags Archive Store Frag Get Frag Dissemination Tree / Replica Up Tree Down Tree Interface Client Create Object Update Object Down Tree Msg Tapestry Network (Java NBIO) Figure 3: Prototype Software Architecture. Pond is built atop SEDA. Components within a single host are implemented as stages (shown as boxes) which communicate through events (shown as arrows). Not all stages run on every host; only inner ring hosts run the Byzantine agreement stage, for example. happen often, it can add several seconds of delay to a task normally measured in tens of milliseconds. To adjust for these anomalies, we report the median value and the 0th and 95th percentile values for exper- iments that are severely effected by garbage collection Pond Prototype
  18. larger updates, the time to apply and archive the update

    domi- nates signature time. Inner Avg. Update Update Latency (ms) Ring Client Ping Size 5% Median 95% Cluster Cluster 0.2 4 kB 98 99 100 2 MB 1098 1150 1448 Cluster UCSD 27.0 4 kB 125 126 128 2 MB 2748 2800 3036 Bay UCSD 23.2 4 kB 144 155 166 Area 2 MB 8763 9626 10231 Table 4: Results of the Latency Microbenchmark Run in the Wide Area. All tests were run with the archive enabled using 1024-bit keys. “Avg. Ping” is the average ping time in millisec- onds from the client machine to each of the inner ring servers. UCSD is the University of California at San Diego. Wide Area Latency
  19. Takeaways • Internet-scale persistent data storage • Incremental scalability, secure

    sharing and durability • Byzantine updates, push updates, archival by erasure coding • Pond prototype supporting multiple applications
  20. Outline • Problems and Assumptions • Design Overview • System

    Interactions • Master Operation • Measurements • Takeaways
  21. Google-scale Problems • Component failures are the norm • Files

    are huge by traditional standards • Appending is more common than over- writing • Benefits of co-designing apps and file system
  22. Assumptions • Targeting Google Datacenters • Cheap commodity components that

    fail often • System stores a modest number of large files • Large streaming and small random reads • Many large, sequential writes • Well-defined semantics for concurrent appends • High sustained bandwidth over low latency
  23. Legend: Data messages Control messages Application (file name, chunk index)

    (chunk handle, chunk locations) GFS master File namespace /foo/bar Instructions to chunkserver Chunkserver state GFS chunkserver GFS chunkserver (chunk handle, byte range) chunk data chunk 2ef0 Linux file system Linux file system GFS client Figure 1: GFS Architecture plication decisions using global knowledge. However, st minimize its involvement in reads and writes so does not become a bottleneck. Clients never read te file data through the master. Instead, a client asks tent TCP connection to the chunkserver over an e period of time. Third, it reduces the size of the m stored on the master. This allows us to keep the m in memory, which in turn brings other advantages Design Overview
  24. Architecture • Single master, multiple chunk servers • 64MB chunk

    size with 64 bit handle • Master metadata • File and chunk namespaces • Mapping from files to chunks • Location of chunk replicas (volatile)
  25. Primary Replica Secondary Replica B Secondary Replica A Master Legend:

    Control Data 3 Client 2 step 1 4 5 6 6 7 Figure 2: Write Control and Data Flow becomes unreachable or replies that it no longer holds a lease. 3. The client pushes the data to all the replicas. A client file region m clients, alth dividual op order on all but undefin 3.2 Dat We decou use the net client to th pushed linea in a pipelin machine’s n and high-la through all To fully data is push than distrib each machi fer the data multiple rec To avoid inter-switch System Interaction
  26. A Typical Read filename + byte offset = chunk index

    Client Master (Filename, chunk index) (Chunk handle, replica location) Replica (Chunk handle, byte range)
  27. Master Operation • Namespace Management and Locking • Replica Placement

    • Creation, Re-replication & Rebalancing • Garbage Collection • Stale Replica Detection
  28. Consistency Model Write Record Append Serial defined defined success interspersed

    with Concurrent consistent inconsistent successes but undefined Failure inconsistent Table 1: File Region State After Mutation Consistent: all clients see the same data Defined: Consistent + clients see complete mutation
  29. Implications for Applications • Favor appends over writes • Checkpoints

    with app-level checksums • Self-validating, self-identifying records
  30. Takeaways • Treat failure as the norm • Monitoring, replication

    and recovery • High throughput for concurrent access • Separate FS control from data transfer
  31. Cluster A B Chunkservers 342 227 Available disk space 72

    TB 180 TB Used disk space 55 TB 155 TB Number of Files 735 k 737 k Number of Dead files 22 k 232 k Number of Chunks 992 k 1550 k Metadata at chunkservers 13 GB 21 GB Metadata at master 48 MB 60 MB Table 2: Characteristics of two GFS clusters longer and continuously generate and process multi-TB data sets with only occasional human intervention. In both cases, a single “task” consists of many processes on many machines Cluster Characteristics
  32. 0 5 10 15 Number of clients N 0 50

    100 Read rate (MB/s) Network limit Aggregate read rate (a) Reads 0 5 10 15 Number of clients N 0 20 40 60 Write rate (MB/s) Network limit Aggregate write rate (b) Writes 0 5 10 15 Number of clients N 0 5 10 Append rate (MB/s) Network limit Aggregate append rate (c) Record appends Figure 3: Aggregate Throughputs. Top curves show theoretical limits imposed by our network topology. Bo show measured throughputs. They have error bars that show 95% confidence intervals, which are illegible in because of low variance in measurements. Cluster A B Read rate (last minute) 583 MB/s 380 MB/s Read rate (last hour) 562 MB/s 384 MB/s Read rate (since restart) 589 MB/s 49 MB/s Write rate (last minute) 1 MB/s 101 MB/s Write rate (last hour) 2 MB/s 117 MB/s Write rate (since restart) 25 MB/s 13 MB/s Master ops (last minute) 325 Ops/s 533 Ops/s 15,000 chunks containing 600 GB of data. To li pact on running applications and provide leeway ing decisions, our default parameters limit thi 91 concurrent clonings (40% of the number of ch where each clone operation is allowed to consu 6.25 MB/s (50 Mbps). All chunks were restored utes, at an effective replication rate of 440 MB/ Microbenchmarks
  33. Figure 3: Aggregate Throughputs. Top curves show theoretica show measured

    throughputs. They have error bars that show 95 because of low variance in measurements. Cluster A B Read rate (last minute) 583 MB/s 380 MB/s Read rate (last hour) 562 MB/s 384 MB/s Read rate (since restart) 589 MB/s 49 MB/s Write rate (last minute) 1 MB/s 101 MB/s Write rate (last hour) 2 MB/s 117 MB/s Write rate (since restart) 25 MB/s 13 MB/s Master ops (last minute) 325 Ops/s 533 Ops/s Master ops (last hour) 381 Ops/s 518 Ops/s Master ops (since restart) 202 Ops/s 347 Ops/s Table 3: Performance Metrics for Two GFS Clusters The read rates were much higher than the write rates. The total workload consists of more reads than writes as we have assumed. Both clusters were in the middle of heavy read activity. In particular, A had been sustaining a read 15 pa in 91 w 6. ut w fa 26 re pu ch 6. Cluster Performance
  34. Operation Read Write Record Append Cluster X Y X Y

    X Y 0K 0.4 2.6 0 0 0 0 1B..1K 0.1 4.1 6.6 4.9 0.2 9.2 1K..8K 65.2 38.5 0.4 1.0 18.9 15.2 8K..64K 29.9 45.1 17.8 43.0 78.0 2.8 64K..128K 0.1 0.7 2.3 1.9 < .1 4.3 128K..256K 0.2 0.3 31.6 0.4 < .1 10.6 256K..512K 0.1 0.1 4.2 7.7 < .1 31.2 512K..1M 3.9 6.9 35.5 28.7 2.2 25.5 1M..inf 0.1 1.8 1.5 12.3 0.7 2.2 Table 4: Operations Breakdown by Size (%). For reads, the size is the amount of data actually read and trans- ferred, rather than the amount requested. and file systems, but the effect is likely more pronounced in our case. 6.3.2 Chunkserver Workload Table 4 shows the distribution of operations by size. Read sizes exhibit a bimodal distribution. The small reads (un- der 64 KB) come from seek-intensive clients that look up small pieces of data within huge files. The large reads (over 512 KB) come from long sequential reads through entire files. A significant number of reads return no data at all in clus- ter Y. Our applications, especially those in the production systems, often use files as producer-consumer queues. Pro- ducers append concurrently to a file while a consumer reads Operation Read Write Record Append Cluster X Y X Y X Y 1B..1K < .1 < .1 < .1 < .1 < .1 < .1 1K..8K 13.8 3.9 < .1 < .1 < .1 0.1 8K..64K 11.4 9.3 2.4 5.9 2.3 0.3 64K..128K 0.3 0.7 0.3 0.3 22.7 1.2 128K..256K 0.8 0.6 16.5 0.2 < .1 5.8 256K..512K 1.4 0.3 3.4 7.7 < .1 38.4 512K..1M 65.9 55.1 74.1 58.0 .1 46.8 1M..inf 6.4 30.1 3.3 28.0 53.9 7.4 Table 5: Bytes Transferred Breakdown by Opera- tion Size (%). For reads, the size is the amount of data actually read and transferred, rather than the amount re- quested. The two may differ if the read attempts to read beyond end of file, which by design is not uncommon in our workloads. Cluster X Y Open 26.1 16.3 Delete 0.7 1.5 FindLocation 64.3 65.8 FindLeaseHolder 7.8 13.4 FindMatchingFiles 0.6 2.2 All other combined 0.5 0.8 Table 6: Master Requests Breakdown by Type (%) proximates the case where a client deliberately overwrites previous written data rather than appends new data. For Cluster Performance
  35. 1 3 5 7 9 11 13 4 16 64

    256 1024 4096 1 3 5 7 9 11 13 Total Storage Consumed / Object Size Object Size (kB) Storage Overhead vs. Object Size Cauchy Rate 1/4, 32 Fragments Cauchy Rate 1/2, 32 Fragments No Archive Figure 4: Storage Overhead. Objects of size less than the block size of 8 kB still require one block of storage. For suffi- ciently large objects, the metadata is negligible. The cost added by the archive is a function of the encoding rate. For example, a rate 1/4 code increases the storage cost by a factor of 4.8. two 36 GB IBM UltraStar 36LZX hard drives. The ma- chines use a single Intel PRO/1000 XF gigabit Ethernet adaptor to connect to a Packet Engines PowerRail giga- Key Upda Size Size 512 4 kB 2 MB 1024 4 kB 2 MB Table 2: Results Area. All nodes a nodes in the clust and disabled whil 6.1 Storage We first measur data model. As is represented as top block. Whe is smaller than block dominates increases in size Storage Overhead
  36. ) MB Update 0.4 26.6 113.0 566.9 75.8 ate. The

    majority he cluster is spent r the result. With the update domi- e Latency (ms) Median 95% 99 100 1150 1448 126 128 2800 3036 155 166 9626 10231 hmark Run in the 0 20 40 60 80 100 120 140 4 16 64 256 1024 0 2 4 6 8 10 12 Total Update Operations per Second Total Bandwidth (MB/s) Size of Update (kB) Update Throughput vs. Update Size Ops/s, Archive Disabled Ops/s, Archive Enabled MB/s, Archive Disabled MB/s, Archive Enabled Figure 5: Throughput in the Local Area. This graph shows the update throughput in terms of both operations per second (left axis) and bytes per second (right axis) as a function of up- date size. While the ops/s number falls off quickly with update size, throughput in bytes per second continues to increase. All experiments are run with 1024-bit keys. The data shown is the average of three trials, and the standard deviation for all points is less than 3% of the mean. Update Throughput
  37. are run with the archive on and 1024-bit keys. 0

    50 100 150 200 8 16 24 32 Latency (ms) Read Size (kB) Read Latency vs. Read Size Read From Archive Read From Remote Cache Figure 6: Latency to Read Objects from the Archive. The latency to read data from the archive depends on the latency to retrieve enough fragments for reconstruction. test on the cluster. Again, running the test in the local area illustrates the computational limitations of the inner 6.3 Archiv To read a dat cate a replica must be recon latency of acc through Tapes is a more com several fragme data from them To measure archive, we pe ulate the archi to a four-node of the data in client submits suring the time ceived. We per for thirty seco between the re request. For c reading remote Read Latency
  38. 0 20 40 60 80 100 0 20 40 60

    80 100 120 140 160 180 200 Cumulative Percentage of Bytes Sent Link RTT (ms) 50 Replicas 20 Replicas 10 Replicas Figure 7: Results of the Stream Benchmark. The graph shows the percentage of bytes sent over links of different latency as the number of replicas varies. In this benchmark, we create a Tapestry network with 500 virtual OceanStore nodes spread across the hosts in 30 PlanetLab sites. We then create a single shared Tokens OceanS Tapestry TCP/IP Table 6: Results was run at least experiments wa are run using 10 chines that hos experiment. T sage to the coo ken to the nex Tapestry is use other, TCP/IP As demonst semination tree shows that thi Replication