Upgrade to Pro — share decks privately, control downloads, hide ads and more …

Grain Foods Foundation

BEMA
March 01, 2018

Grain Foods Foundation

BEMA

March 01, 2018
Tweet

More Decks by BEMA

Other Decks in Research

Transcript

  1. elevate markets, accelerate results |
    BEMA
    General Meeting
    February 25, 2018

    View Slide

  2. elevate markets, accelerate results |

    View Slide

  3. View Slide

  4. elevate markets, accelerate results |
    SAMPLE TELEVISION

    View Slide

  5. MEDIA
    COVERAGE
    released October 23, 2017
    Total
    Potential
    Audience
    83,150,453
    Total
    Pickups
    250

    View Slide

  6. elevate markets, accelerate results |
    Checkoff Feasibility Update

    View Slide

  7. elevate markets, accelerate results |
    Commercial Bread Unit Sales
    per Capita Index
    80
    85
    90
    95
    100
    105
    110
    2011 2012 2013 2014 2015 2016 2017 2018 2019 2020 2021 2022 2023 2024 2025 2026
    Unit Sales per Capita Index
    (2016 = 100 and in 2016 $’s)
    2016 Constant Unit per Capita Sales Trend Unit per Capita Sales Forecast
    Source: IRI and US Census
    Projection based on past 5 years and US Census Population estimates
    -1.5% / year
    $12.4 Billion
    at risk

    View Slide

  8. elevate markets, accelerate results |
    Market Trends
    Wheat Flour Use 
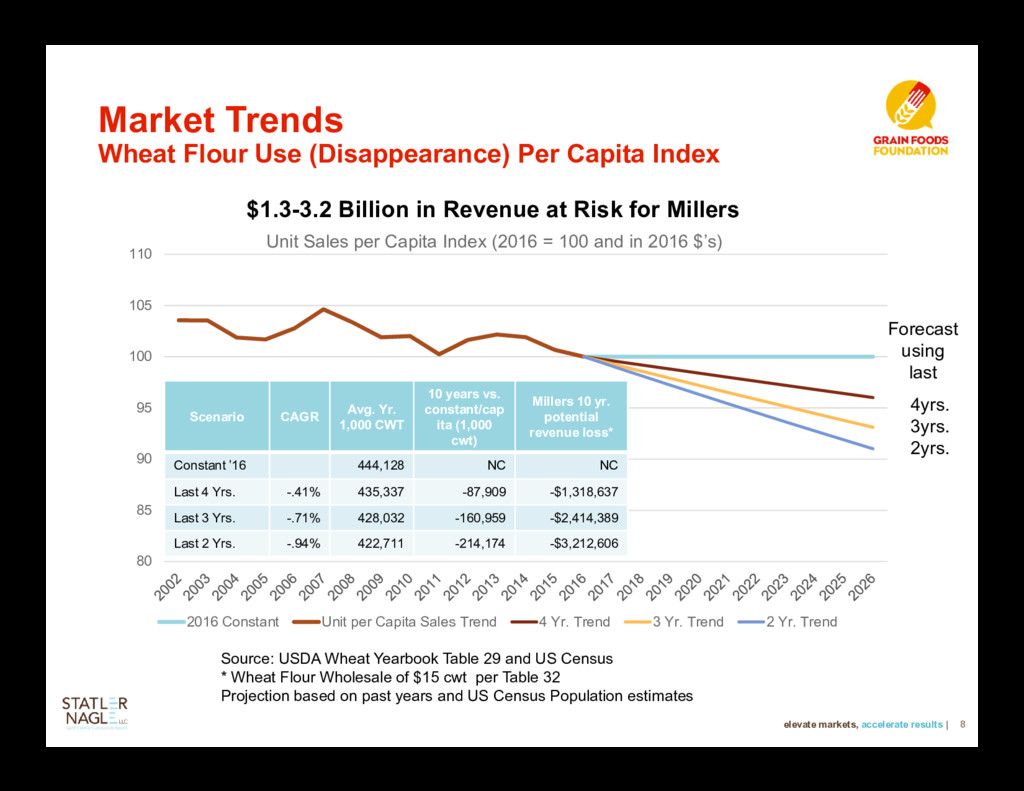
(Disappearance) Per Capita Index
    80
    85
    90
    95
    100
    105
    110
    Unit Sales per Capita Index (2016 = 100 and in 2016 $’s)
    2016 Constant Unit per Capita Sales Trend 4 Yr. Trend 3 Yr. Trend 2 Yr. Trend
    Source: USDA Wheat Yearbook Table 29 and US Census
    * Wheat Flour Wholesale of $15 cwt per Table 32
    Projection based on past years and US Census Population estimates
    $1.3-3.2 Billion in Revenue at Risk for Millers
    4yrs.
    3yrs.
    2yrs.
    Forecast
    using
    last
    Scenario CAGR
    Avg. Yr.
    1,000 CWT
    10 years vs.
    constant/cap
    ita (1,000
    cwt)
    Millers 10 yr.
    potential
    revenue loss*
    Constant ’16 444,128 NC NC
    Last 4 Yrs. -.41% 435,337 -87,909 -$1,318,637
    Last 3 Yrs. -.71% 428,032 -160,959 -$2,414,389
    Last 2 Yrs. -.94% 422,711 -214,174 -$3,212,606

    View Slide

  9. elevate markets, accelerate results |
    • A Threat is Looming and Industry Must Coalesce
    ‐ The Industry is Declining with multiple causes
    • Bread products are foundational product in most severe
    decline
    ‐ Creativity, Education, Innovation Lacking in Industry
    • GFF current program support is firm but, a recognition
    that it is not enough
    • Need Bigger Industry Commitment to Turn the Ship
    ‐ We are Jockeying for Share of Shrinking Pie -- Instead of
    Growing the Pie
    Stakeholder Assessment
    Source: 2013 GFF interviews, and 2017 Statler Nagle interviews; combined over
    65 interviews/35 organizations

    View Slide

  10. elevate markets, accelerate results |
    What Action Has Been Taken?
    • GFF:
    ‐ Restructuring activities to maintain current programming while
    checkoff feasibility is assessed
    ‐ Staffing increases
    ‐ Funding three research projects
    • Checkoff Feasibility Project:
    ‐ Steering Committee formation
    ‐ Engaging the direct funders and other stakeholders in a
    transparent process
    ‐ Initial meeting January 10; Second meeting March 13

    View Slide

  11. elevate markets, accelerate results |
    What to Expect in the Coming Months
    A Deliberative Process
    • Steering Committee Will:
    ‐ Integrate research and analytic findings
    ‐ Construct an ROI model to help define the parameters of funding,
    governance, and strategy
    ‐ Build the architecture of a marketing framework
    ‐ Conduct innovation assessment to determine if a checkoff could
    substantially improve rate and quality of Industry innovation

    View Slide

  12. elevate markets, accelerate results |
    What to Expect in the Coming Months
    Up to now, this is an idea…
    No decision will be made until after AFTER the Steering Committee
    assesses three classes of questions AND determines if there is support
    among companies to be assessed.
    1. The Money Questions:
    ‐ Projected annual assessment necessary to influence sales
    ‐ Product mix to be assessed
    ‐ Level of assessment across the product mix
    2. Market Sizing Questions:
    ‐ Are there exemptions? If so, what?
    ‐ How are imports/exports treated?
    3. Governance:
    ‐ Board representation and nomination process
    ‐ Referendum voting and timing requirements

    View Slide

  13. elevate markets, accelerate results |
    What to Expect in the Coming Months
    Timeline of Key Decisions in Checkoff Decision
    2017 2018
    Q2-Q3
    Final Checkoff Feasibility
    Report Delivered
    GFF BOARD/
    STEERING
    COMMITTEE
    DECISION
    September 19
    GFF Board
    Initiates
    Checkoff Feasibility
    Report
    February
    Consumer/Customer
    Research Completed
    October 11
    Task Forces Meet
    & Launch Research
    Projects
    January 10
    Steering Committee
    Meeting
    March 13
    Steering Committee
    Meeting

    View Slide

  14. elevate markets, accelerate results |
    Got Questions?

    View Slide