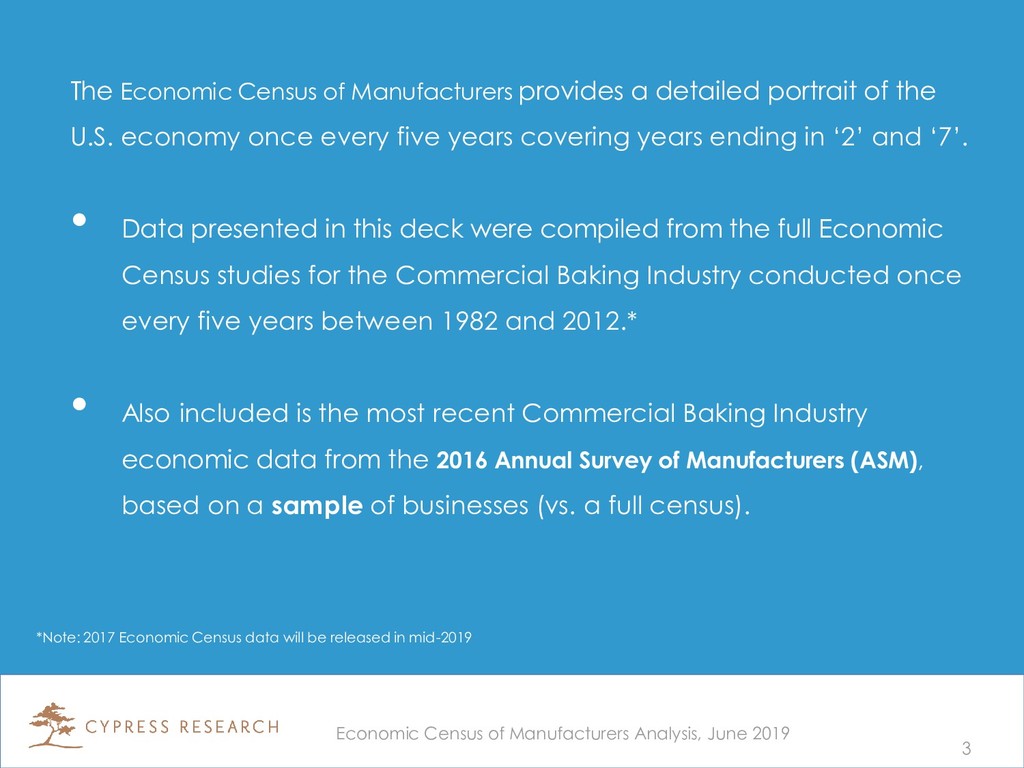
the U.S. economy once every five years covering years ending in ‘2’ and ‘7’. • Data presented in this deck were compiled from the full Economic Census studies for the Commercial Baking Industry conducted once every five years between 1982 and 2012.* • Also included is the most recent Commercial Baking Industry economic data from the 2016 Annual Survey of Manufacturers (ASM), based on a sample of businesses (vs. a full census). *Note: 2017 Economic Census data will be released in mid-2019 3 Economic Census of Manufacturers Analysis, June 2019
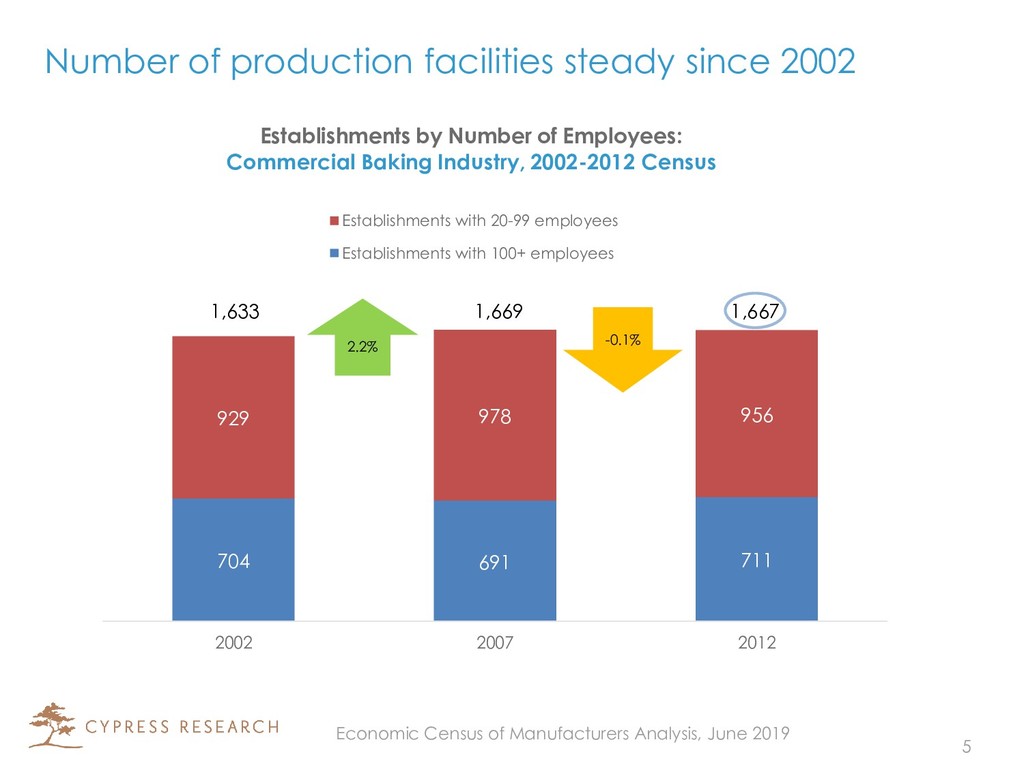
by Number of Employees: Commercial Baking Industry, 2002-2012 Census Establishments with 20-99 employees Establishments with 100+ employees Number of production facilities steady since 2002 2.2% 1,633 1,669 1,667 -0.1% 5 Economic Census of Manufacturers Analysis, June 2019
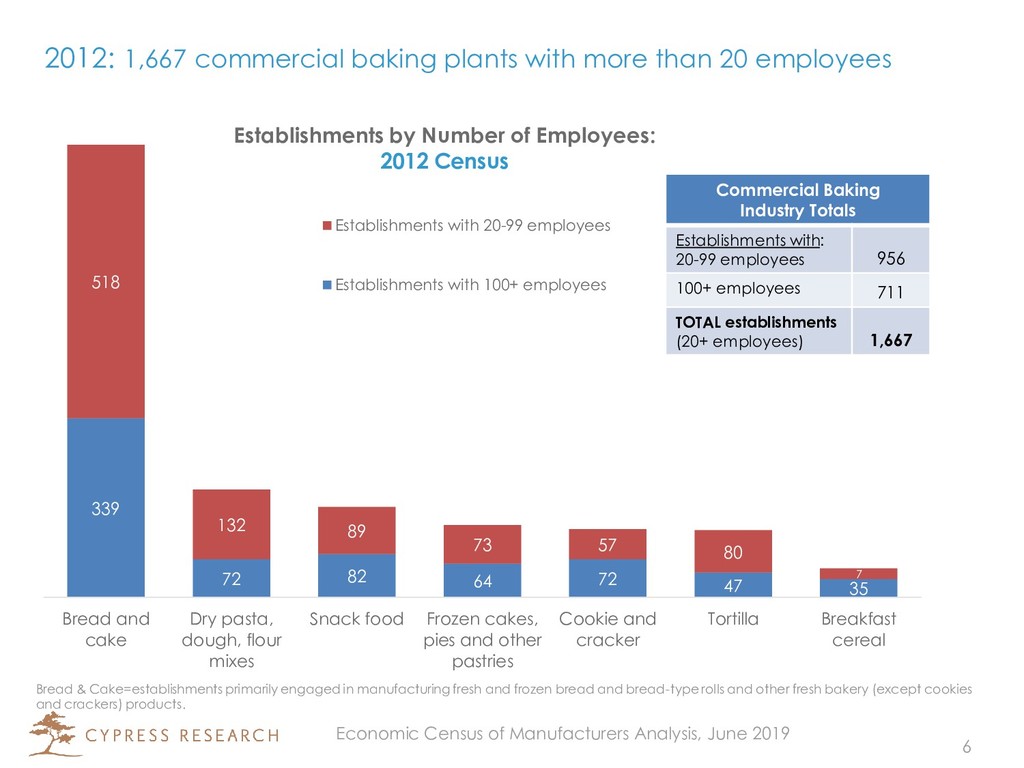
339 72 82 64 72 47 35 518 132 89 73 57 80 7 Bread and cake Dry pasta, dough, flour mixes Snack food Frozen cakes, pies and other pastries Cookie and cracker Tortilla Breakfast cereal Establishments by Number of Employees: 2012 Census Establishments with 20-99 employees Establishments with 100+ employees Commercial Baking Industry Totals Establishments with: 20-99 employees 956 100+ employees 711 TOTAL establishments (20+ employees) 1,667 6 Bread & Cake=establishments primarily engaged in manufacturing fresh and frozen bread and bread-type rolls and other fresh bakery (except cookies and crackers) products. Economic Census of Manufacturers Analysis, June 2019
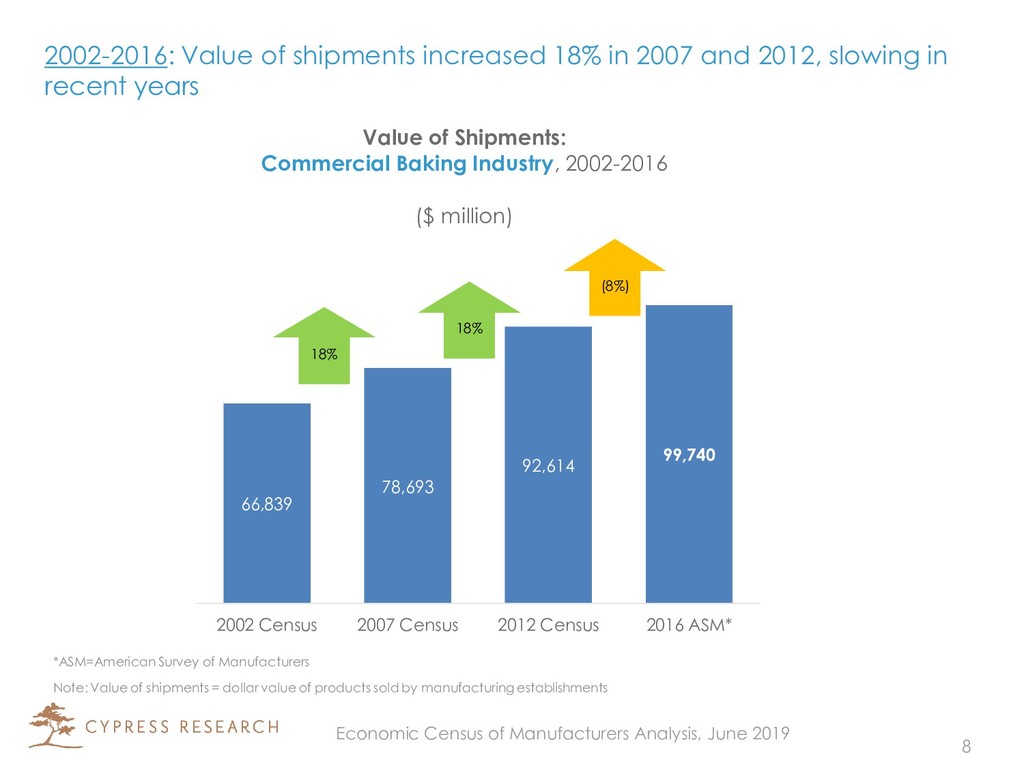
slowing in recent years 66,839 78,693 92,614 99,740 2002 Census 2007 Census 2012 Census 2016 ASM* Value of Shipments: Commercial Baking Industry, 2002-2016 ($ million) (8%) 18% 18% *ASM=American Survey of Manufacturers 8 Note: Value of shipments = dollar value of products sold by manufacturing establishments Economic Census of Manufacturers Analysis, June 2019
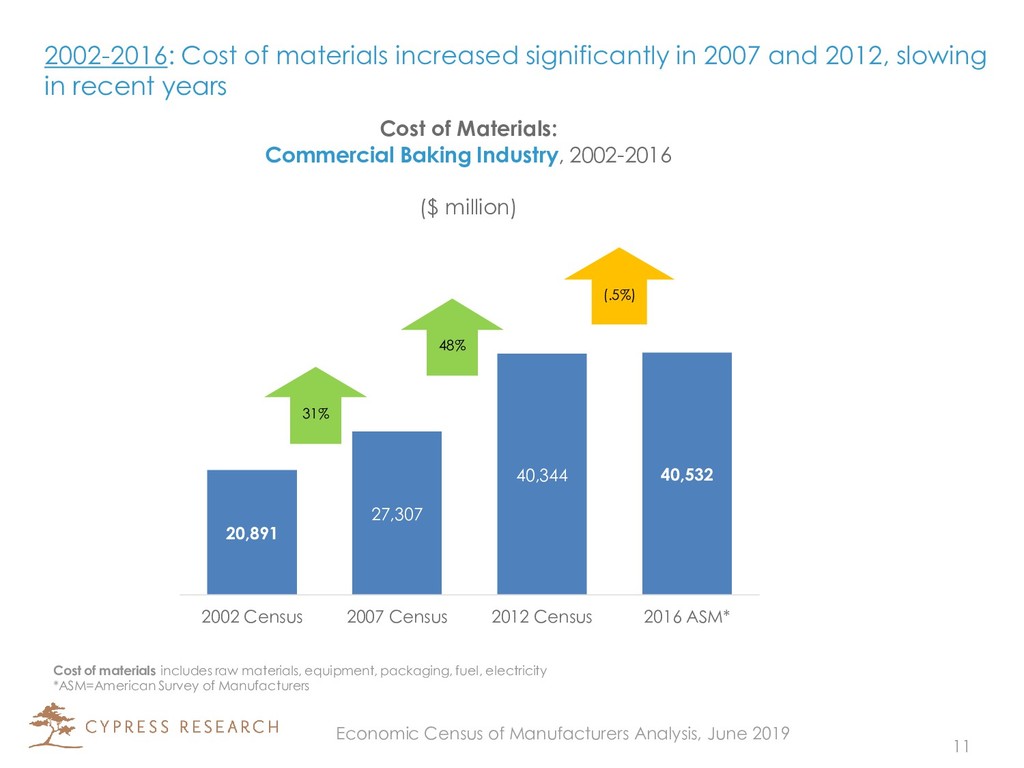
slowing in recent years 20,891 27,307 40,344 40,532 2002 Census 2007 Census 2012 Census 2016 ASM* Cost of Materials: Commercial Baking Industry, 2002-2016 ($ million) (.5%) 48% 31% Cost of materials includes raw materials, equipment, packaging, fuel, electricity *ASM=American Survey of Manufacturers 11 Economic Census of Manufacturers Analysis, June 2019
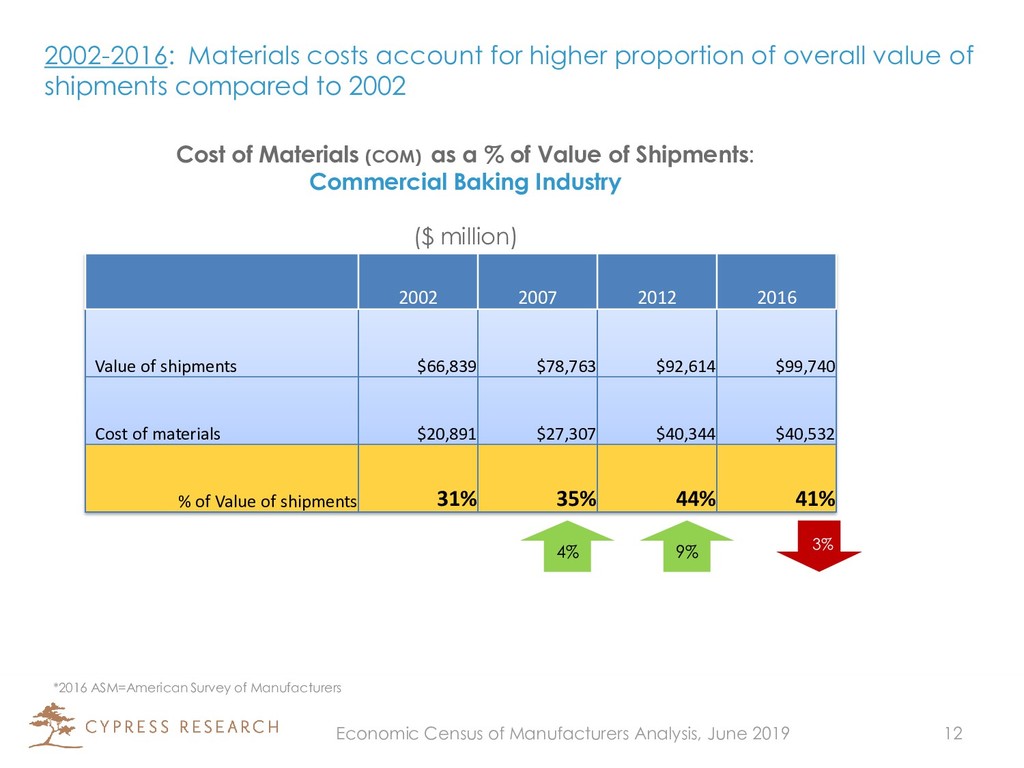
$99,740 Cost of materials $20,891 $27,307 $40,344 $40,532 % of Value of shipments 31% 35% 44% 41% *2016 ASM=American Survey of Manufacturers 12 2002-2016: Materials costs account for higher proportion of overall value of shipments compared to 2002 Cost of Materials (COM) as a % of Value of Shipments: Commercial Baking Industry ($ million) 4% 9% 3% Economic Census of Manufacturers Analysis, June 2019
1744 1939 2091 2002 Census 2007 Census 2012 Census 2016 ASM* Capital Expenditures: Commercial Baking Industry, 2002-2016 ($ million) Machinery & equipment Buildings & other structures (4%) 2,201 2,470 8% *ASM=American Survey of Manufacturers 2,371 1,859 18% 14 Economic Census of Manufacturers Analysis, June 2019
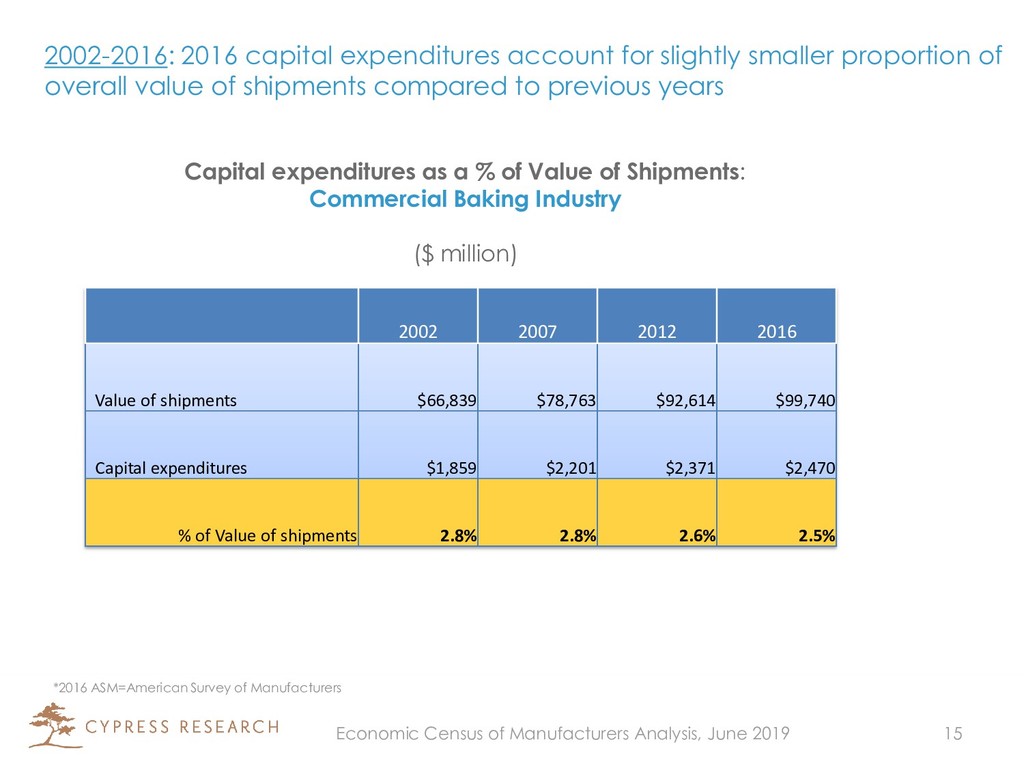
$99,740 Capital expenditures $1,859 $2,201 $2,371 $2,470 % of Value of shipments 2.8% 2.8% 2.6% 2.5% *2016 ASM=American Survey of Manufacturers 15 2002-2016: 2016 capital expenditures account for slightly smaller proportion of overall value of shipments compared to previous years Capital expenditures as a % of Value of Shipments: Commercial Baking Industry ($ million) Economic Census of Manufacturers Analysis, June 2019
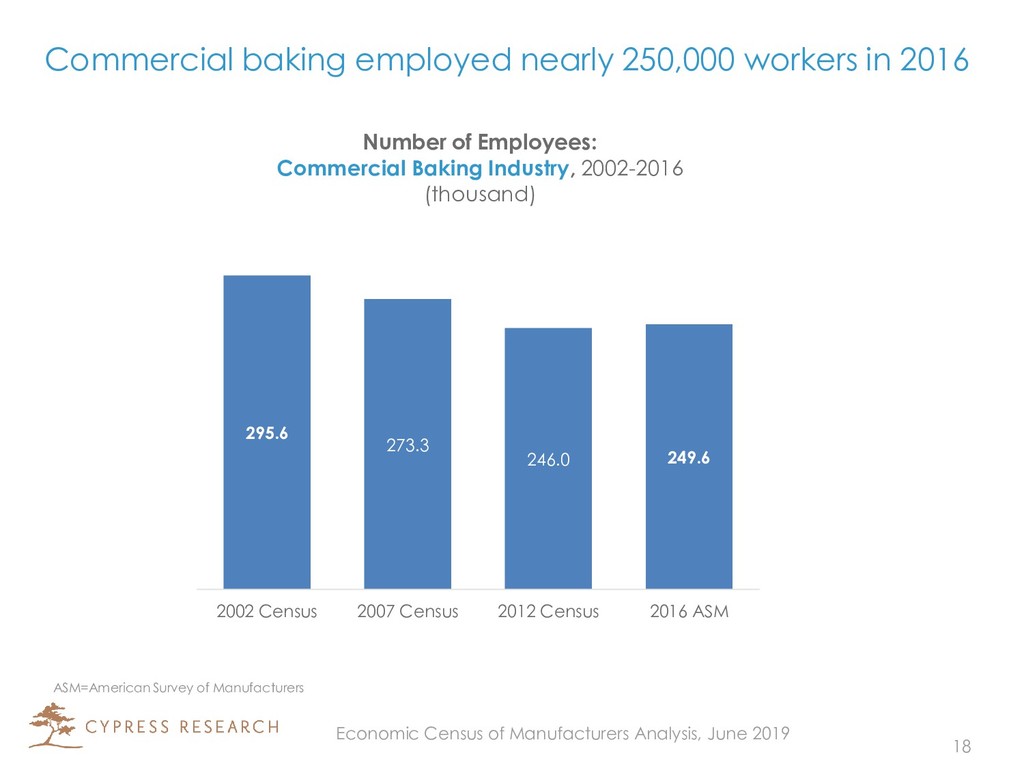
246.0 249.6 2002 Census 2007 Census 2012 Census 2016 ASM Number of Employees: Commercial Baking Industry, 2002-2016 (thousand) ASM=American Survey of Manufacturers 18 Economic Census of Manufacturers Analysis, June 2019
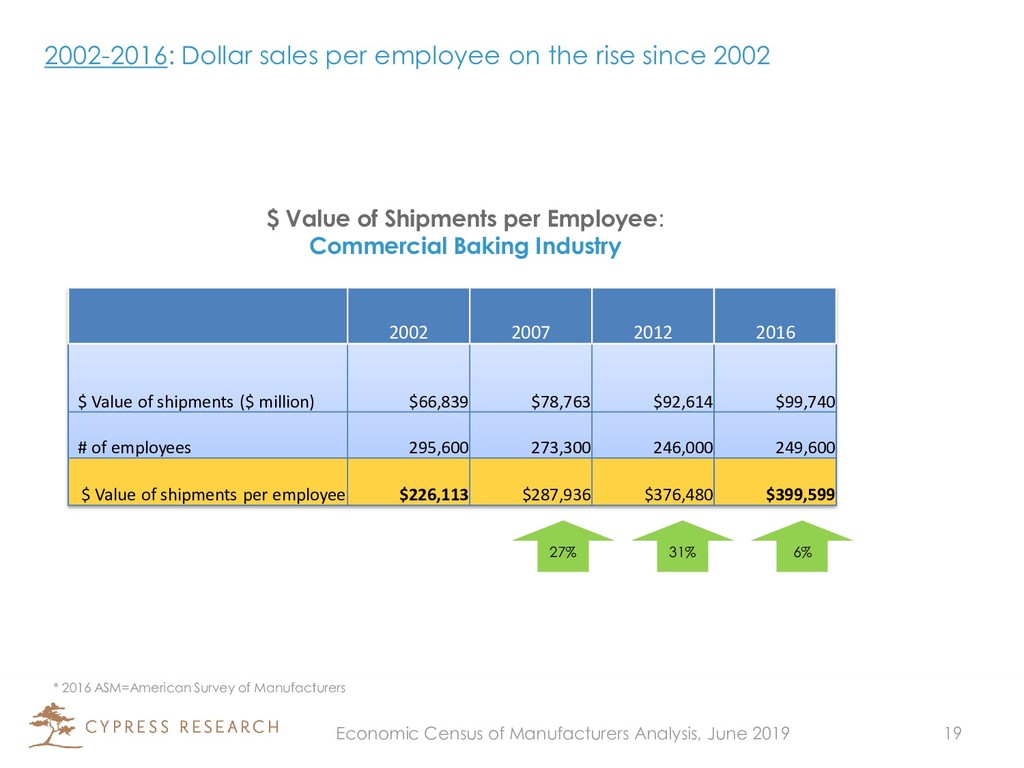
$66,839 $78,763 $92,614 $99,740 # of employees 295,600 273,300 246,000 249,600 $ Value of shipments per employee $226,113 $287,936 $376,480 $399,599 * 2016 ASM=American Survey of Manufacturers 19 2002-2016: Dollar sales per employee on the rise since 2002 $ Value of Shipments per Employee: Commercial Baking Industry 27% 31% 6% Economic Census of Manufacturers Analysis, June 2019
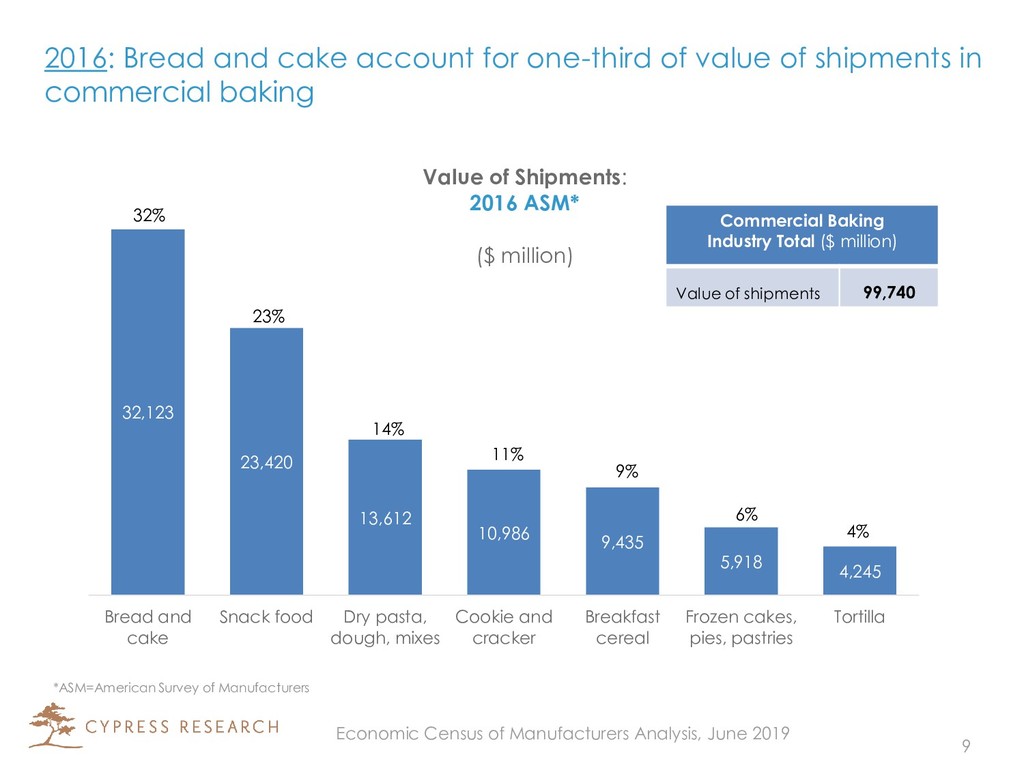
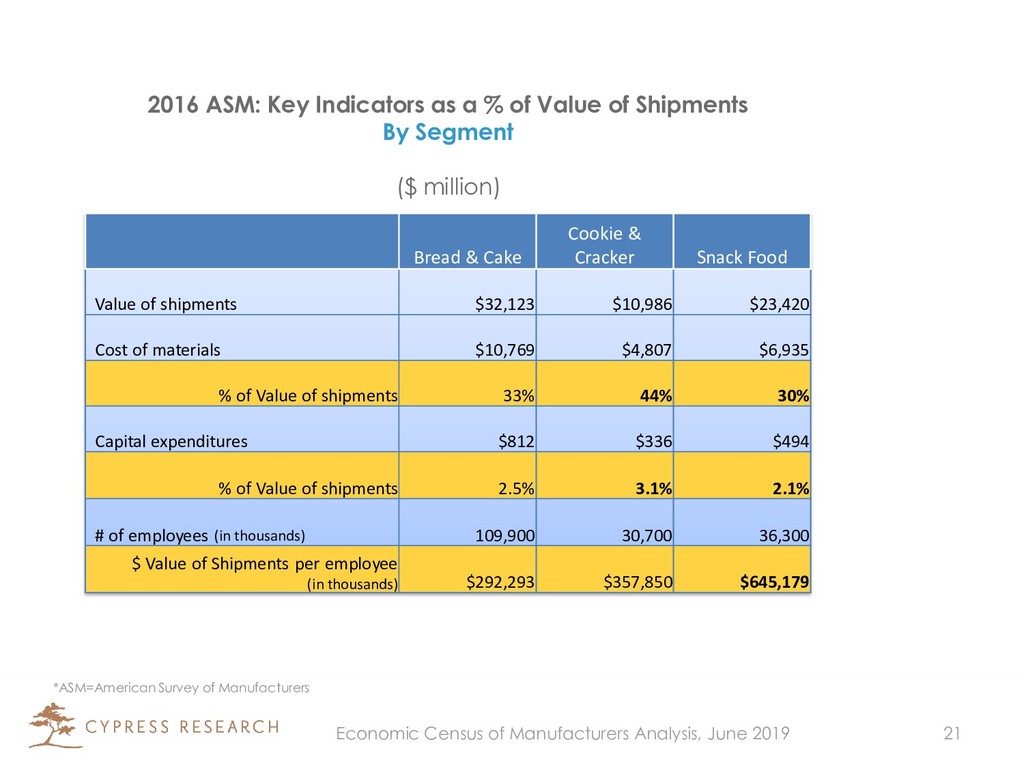
shipments $32,123 $10,986 $23,420 Cost of materials $10,769 $4,807 $6,935 % of Value of shipments 33% 44% 30% Capital expenditures $812 $336 $494 % of Value of shipments 2.5% 3.1% 2.1% # of employees (in thousands) 109,900 30,700 36,300 $ Value of Shipments per employee (in thousands) $292,293 $357,850 $645,179 *ASM=American Survey of Manufacturers 21 2016 ASM: Key Indicators as a % of Value of Shipments By Segment ($ million) Economic Census of Manufacturers Analysis, June 2019