I will show you the most important packages for Data Science in Python. The presentation was delivered at Budapest BI Fórum, 2014. http://2014.budapestbiforum.hu
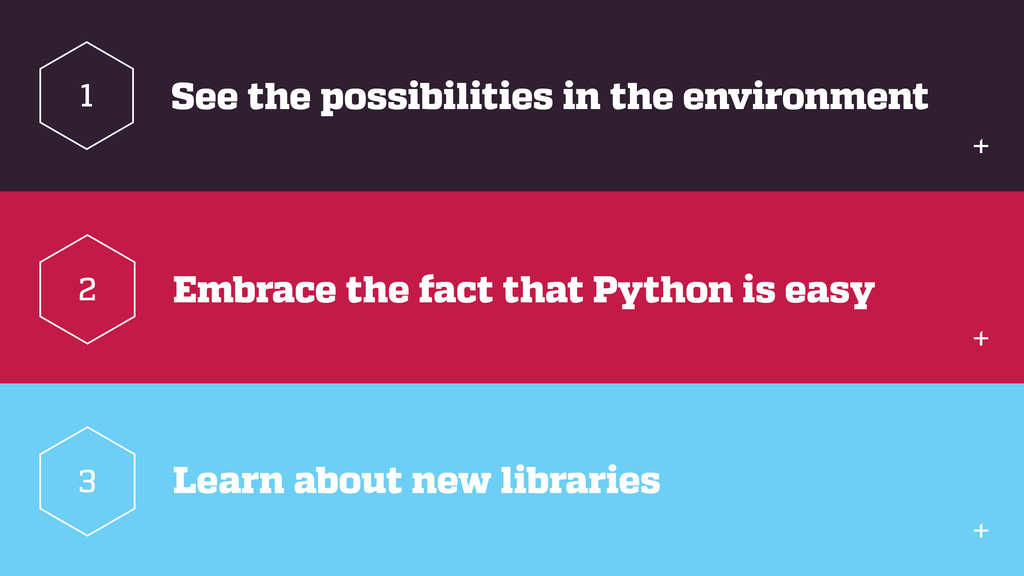
Meetup Support member of budapest.py Meetup Member of Python Software Foundation and NumFOCUS. Bence Faludi | @bfaludi | [email protected] See the possibilities in the environment 1 Learn about new libraries 3 Embrace the fact that Python is easy 2
for large- scale data processing, predictive analytics, and scientific computing. Python 2.7 Python 3.4 Extended support of this end-of- life release. It works perfectly but unicode handling is not a dream. Slightly worse library support. Most of the popular packages were ported to Python 3. Use it if you have the opportunity
with XML parser libraries import requests, bs4 p = bs4.BeautifulSoup( requests.get('http://index.hu').text ) print( p.select('div.cim h1.cikkcim a’)[0] ) with Scrapy framework
bs4 data = {} def crawler( url, level = 0, maximum_depth = None ): if maximum_depth and level >= maximum_depth: return data[ url ] = requests.get( url ).text p = bs4.BeautifulSoup( data[ url ] ) for a in p.select('a'): if not a.attrs.get('href') and not a.attrs['href'].startswith('http') and a.attrs['href'] in data.keys(): continue crawler( a.attrs['href'], level+1, maximum_depth ) crawler( 'http://index.hu', maximum_depth = 3 )
to get structured data for analysis. You can use validation libraries for individual data. phonenumbers validate_email Other libraries for standardisation. dateutil …
array object. Linear algebra operations with speed in mind. Vectorisation, broadcasting, aggregation functions. Easy interface to C/C++/Fortan code. Simple to understand data-structure.
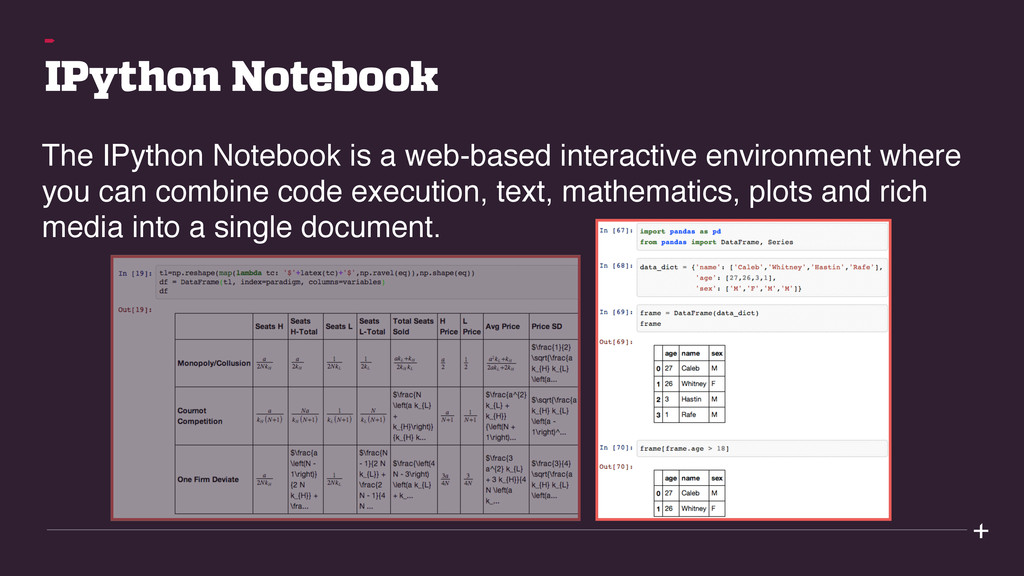
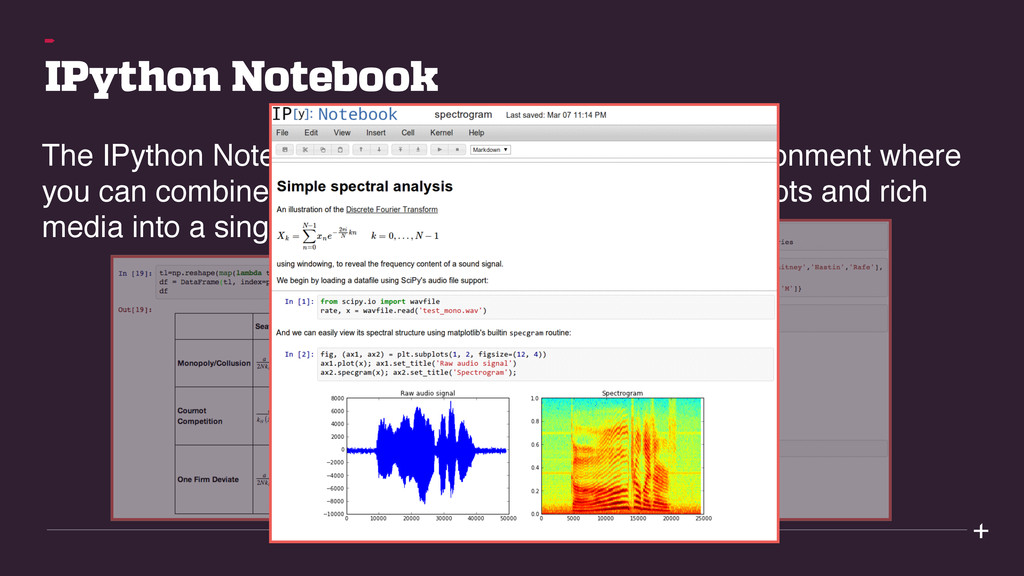
with support of code, text, mathematical expressions, inline plots, etc. Flexible, embeddable interpereters. Easy to use. Architecture for parallel computing.
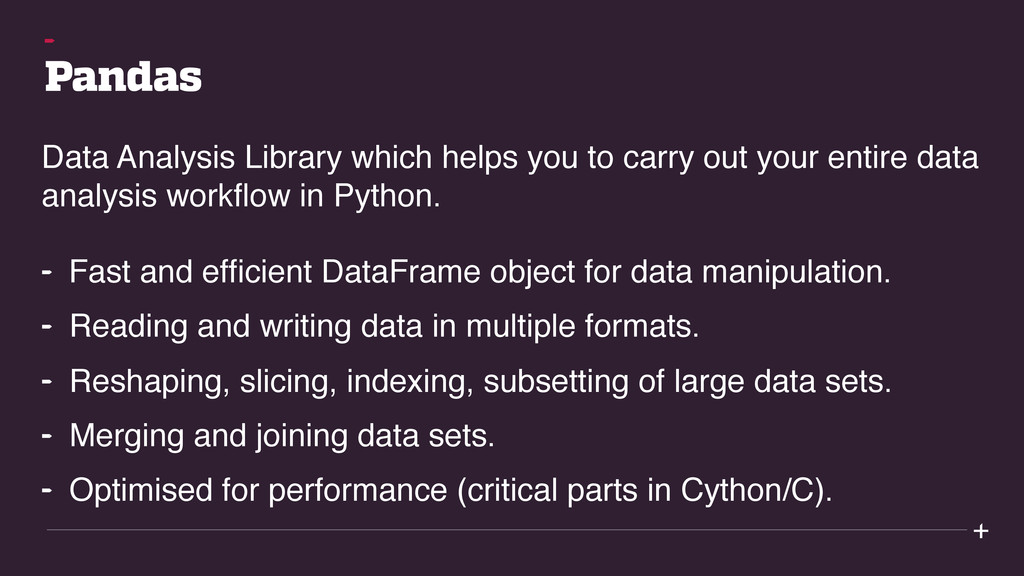
your entire data analysis workflow in Python. Fast and efficient DataFrame object for data manipulation. Reading and writing data in multiple formats. Reshaping, slicing, indexing, subsetting of large data sets. Merging and joining data sets. Optimised for performance (critical parts in Cython/C).
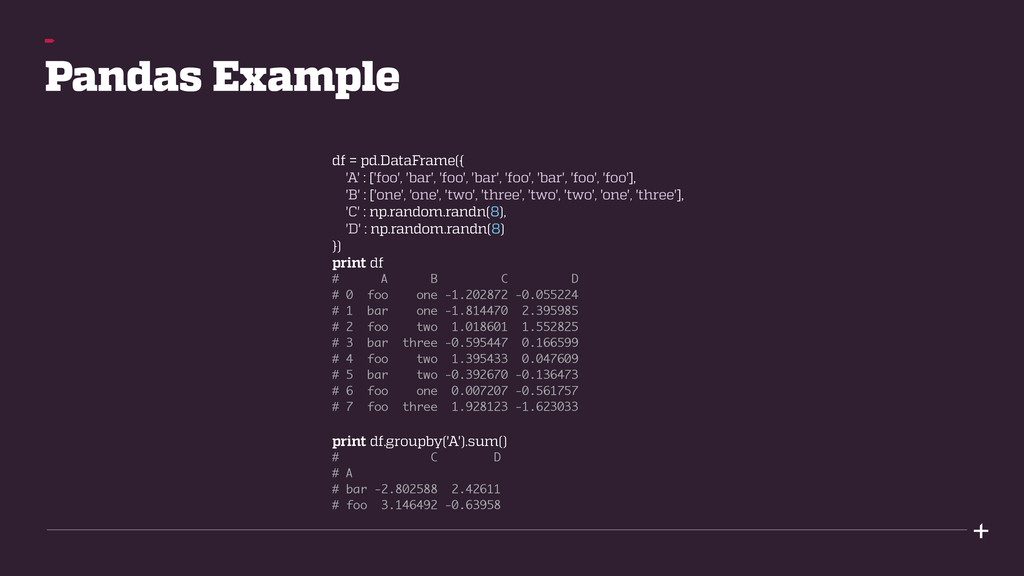
'bar', 'foo', 'bar', 'foo', 'foo'], 'B' : ['one', 'one', 'two', 'three', 'two', 'two', 'one', 'three'], 'C' : np.random.randn(8), 'D' : np.random.randn(8) }) print df # A B C D # 0 foo one -1.202872 -0.055224 # 1 bar one -1.814470 2.395985 # 2 foo two 1.018601 1.552825 # 3 bar three -0.595447 0.166599 # 4 foo two 1.395433 0.047609 # 5 bar two -0.392670 -0.136473 # 6 foo one 0.007207 -0.561757 # 7 foo three 1.928123 -1.623033 print df.groupby('A').sum() # C D # A # bar -2.802588 2.42611 # foo 3.146492 -0.63958
to work with human language data. Over 50 lexical resources included. Tokenizing: breaking text into segments. Stemming: splitting word before the stem. Classification: organising text based on tags and rules. Tagging: adding tense, related terms, properties, etc.
data accessible – by providing tools for streamline publishing, sharing, finding and using data. Web interface with API. Data visualisation and analytics. Workflow support. Integrated data storage.
measurement. p = Pipeline() p.source_object("csv_source", "data.csv") p.distinct("category") p.pretty_print() p.run() Abstraction from the backend storage. Focus on the pipeline. Easy SCDs. Extensible.
![names = [] if name == ‘John’: names.append({ ‘name’: name,](https://files.speakerdeck.com/presentations/363c7610584e01328683667ba65f86a2/slide_11.jpg)