Upgrade to Pro — share decks privately, control downloads, hide ads and more …

A new streaming computation engine for real-time analytics by Michael Barton at Big Data Spain 2015

A new streaming computation engine for real-time analytics by Michael Barton at Big Data Spain 2015

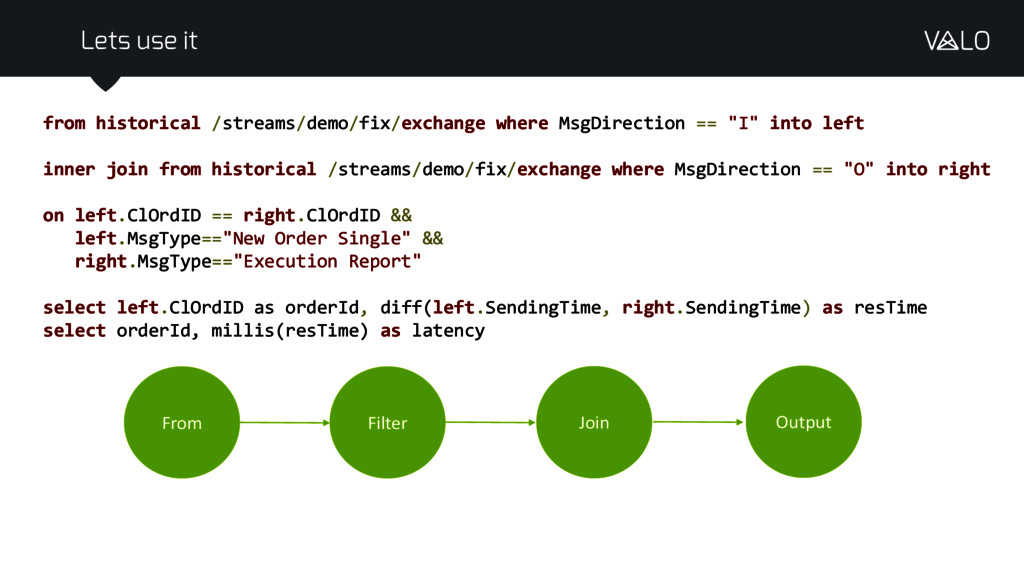
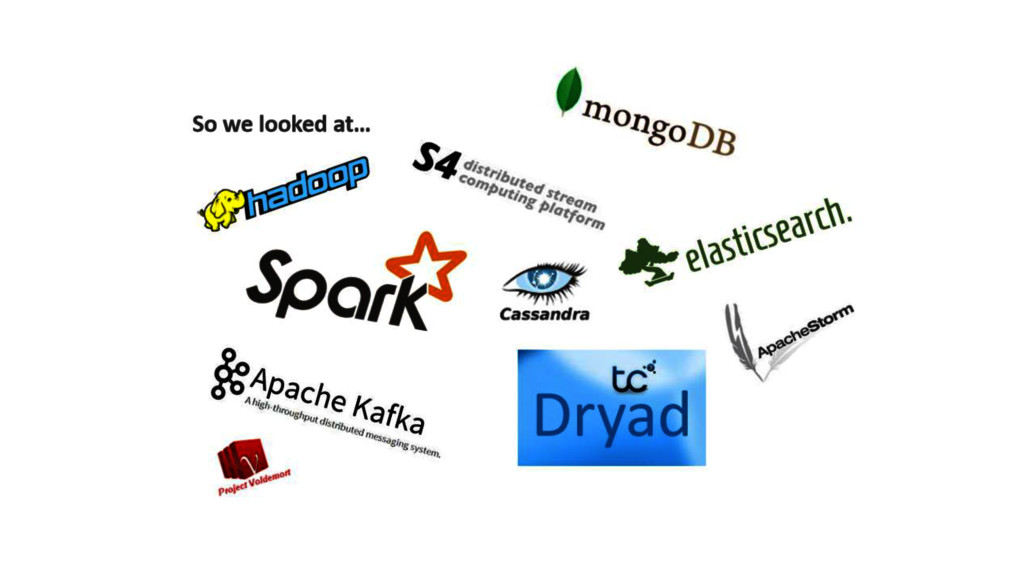
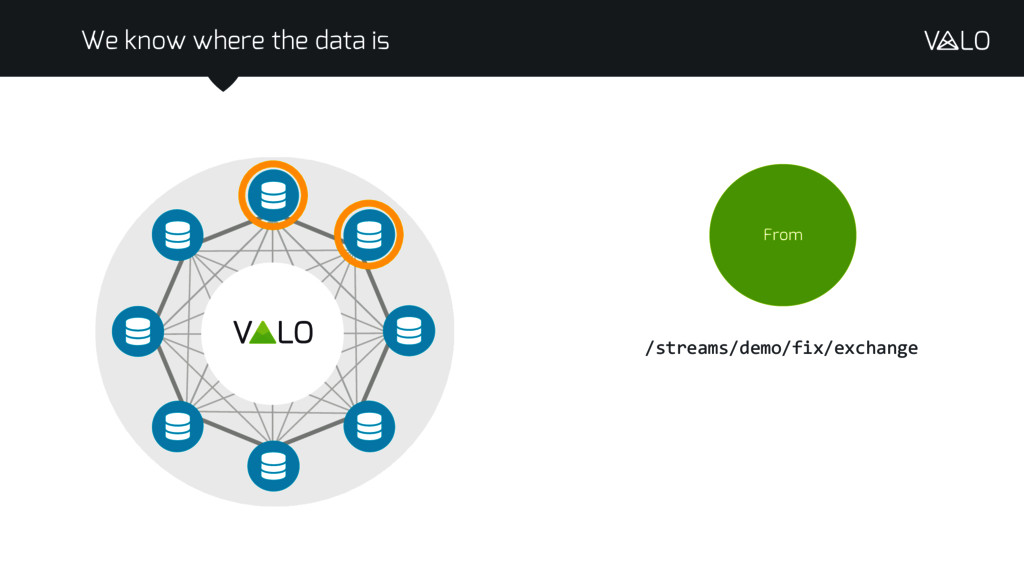
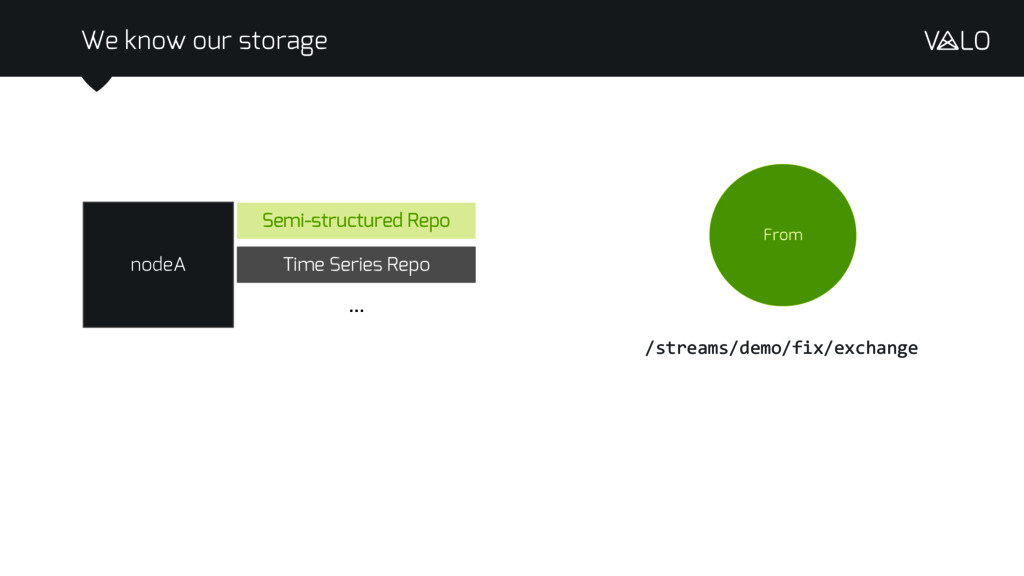
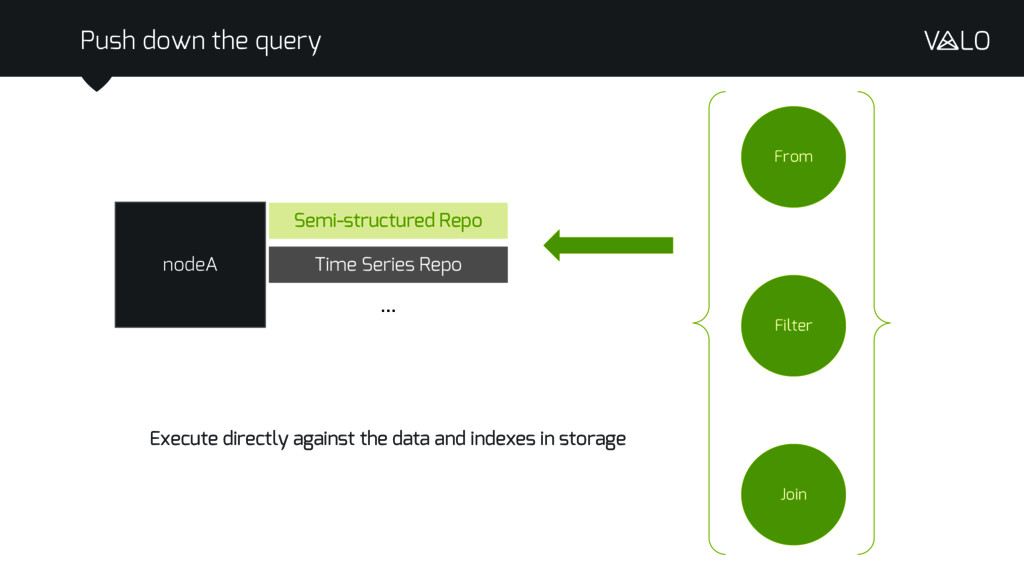
Apache Spark has successfully built on Hadoop infrastructure to encompass real-time processing, moving from rigid Map-Reduce operations to general purpose functional operations distributed across a cluster of machines. However data storage has become a black box. The source data for a query has to be retrieved in full and sent through the analysis pipeline rather than processing the data where it is stored, as in traditional database systems. This introduces significant cost, both in network utilisation and in the time taken to produce a result.

Session presented at Big Data Spain 2015 Conference
15th Oct 2015
Kinépolis Madrid
http://www.bigdataspain.org
Event promoted by: http://www.paradigmatecnologico.com
Abstract: http://www.bigdataspain.org/program/thu/slot-14.html

Big Data Spain

October 21, 2015
Tweet

More Decks by Big Data Spain

Other Decks in Technology

Transcript

  1. We have a big complicated trading system Can we calculate

    the latency of each order? Lets say I work in a bank entry point exit point
  2. HTTP POST { “MsgDirection”: “I”, “SendingTime”: “2015-04-05T14:30Z”, … } Simple

    to publish data entry point exit point HTTP POST { “MsgDirection”: “I”, “SendingTime”: “2015-04-05T14:31Z”, … } { “MsgDirection”: “O”, “SendingTime”: “2015-04-05T14:33Z”, … } { “MsgDirection”: “O”, “SendingTime”: “2015-04-05T14:32Z”, … }
  3. Tell Valo the schema? { "schema": { "version": "1.0.0", "config":

    {}, "topDef": { "type": "record", "properties": { ... "MsgDirection": { "type": "string", "comments": "I for input message, O for output" }, "Account": { "type": "string", "optional": "true", "comments": "Account mnemonic as agreed between buy and sell sides" }, ... "SendingTime": { "type": "datetime", "comments": "Time of message transmission (always expressed in UTC (Univ }, "Side": { "type": "string", "optional": "true", "comments": "Side" }, "Symbol": { "type": "string", "optional": "true", "comments": "Ticker symbol. Common, human understood representation of t }, { “MsgDirection”: “I”, “SendingTime”: “2015-04-05T14:30Z”, … } { “MsgDirection”: “I”, “SendingTime”: “2015-04-05T14:31Z”, … } { “MsgDirection”: “O”, “SendingTime”: “2015-04-05T14:33Z”, … } { “MsgDirection”: “O”, “SendingTime”: “2015-04-05T14:32Z”, … }
  4. Lets use it from historical /streams/demo/fix/exchange where MsgDirection == "I"

    into left inner join from historical /streams/demo/fix/exchange where MsgDirection == "O" into right on left.ClOrdID == right.ClOrdID && left.MsgType=="New Order Single" && right.MsgType=="Execution Report" select left.ClOrdID as orderId, diff(left.SendingTime, right.SendingTime) as resTime select orderId, millis(resTime) as latency
  5. Lets use it from historical /streams/demo/fix/exchange where MsgDirection == "I"

    into left inner join from historical /streams/demo/fix/exchange where MsgDirection == "O" into right on left.ClOrdID == right.ClOrdID && left.MsgType=="New Order Single" && right.MsgType=="Execution Report" select left.ClOrdID as orderId, diff(left.SendingTime, right.SendingTime) as resTime select orderId, millis(resTime) as latency From Filter Join Output
  6. Cluster of nodes Commodity hardware Uniform architecture No special leaders

    or roles Streams of data Immutable, append-only, distributed Eventual consistency in failure cases It’s just VALO
  7. nodeA Semi-structured Repo Time Series Repo … We know our

    storage From /streams/demo/fix/exchange
  8. nodeA Semi-structured Repo Time Series Repo … We know our

    storage Semi-structured Repo Hierarchical Document Data Flexible schemas Lucene Indexes Taxonomies and Facets Time Series Repo Well defined schema Custom I/O layer Bitmap B+Tree Indices
  9. From nodeA Semi-structured Repo Time Series Repo … Filter Join

    Execute directly against the data and indexes in storage Push down the query
  10. ward-G5 ward-G3 intensive-care Can we look for unusual activity in

    the ECG monitors? Lets say I work in a hospital
  11. Assumption-Free Anomaly Detection in Time Series Li Wei Nitin Kumar

    Venkata Lolla Eamonn Keogh Stefano Lonardi Chotirat Ann Ratanamahatana University of California – Riverside Department of Computer Science & Engineering Riverside, CA 92521, USA http://alumni.cs.ucr.edu/~ratana/SSDBM05.pdf http://alumni.cs.ucr.edu/~wli/SSDBM05/ Here’s an interesting paper
  12. @ValoOnlineFunction("anomaly") @ValoOnlineFunctionAnnotation(SchemaAnnotations.ANALYTICS.ANOMALY) @ValoOnlineFunctionDescription("Unsupervised anomaly detection for time series") object OnlineAnomalyDetectionFactory

    extends OnlineAlgorithmFactory[OnlineAnomalyDetectionParams, Double, OnlineAnomalyDetectionResult] { override val isCommutative: Boolean = false override val isAssociative: Boolean = false override val isMergeable: Boolean = false override def getDependency(windowType: WindowType): AlgoDependency = AlgoDependency.NoDependencies override def init(args: OnlineAnomalyDetectionParams): OnlineAlgorithm[Double, OnlineAnomalyDetectionResult] = { new OnlineAnomalyDetection(args.lagWindow, args.leadWindow, args.featureSize, 3, 5) } } final case class OnlineAnomalyDetectionParams(lagWindow: Int, leadWindow: Int, featureSize: Int) final case class OnlineAnomalyDetectionResult(isTraining: Boolean, point: Double, signal: Double) Full algorithm code omitted for brevity! So lets implement it!
  13. HTTP POST { “ts”: “2015-04-05T14:30Z”, “contributor”: “ward-g3-monitor0” “value”: 0.25443 }

    { “ts”: “2015-04-05T14:30Z”, “contributor”: “ward-g3-monitor1” “value”: 0.36432 } { “ts”: “2015-04-05T14:30Z”, “contributor”: “intensive-care” “value”: 0.46580 } { “ts”: “2015-04-05T14:31Z”, “contributor”: “ward-g3-monitor0” “value”: 0.26073 } ward-G3 intensive-care Simple to publish data
  14. final case class OnlineAnomalyDetectionParams(lagWindow: Int, leadWindow: Int, featureSize: Int) Lets

    use it from /streams/demo/infrastructure/ecg group by contributor select contributor, anomaly(200, 40, 20, value) as result emit every value
  15. One type of monitor is consistently have issues and producing

    bad results. Can we monitor which ones? ward-G3 intensive-care ward-G5 Can we re-use the analysis?
  16. Live updating sets of contributors to data manufacturer == “ACME”

    Re-use the same query across domains ACME Monitors Domains ward-G3 intensive-care ward-G5
  17. Same algorithm Similar queries Real-time and historical Can we re-use

    the analysis? http://collections.rmg.co.uk/mediaLib/476/media- 476182/large.jpg CC BY-NC-SA