Upgrade to Pro — share decks privately, control downloads, hide ads and more …

GrimoireCon North America 2017. Session 2: Creating Visualizations and Dashboards

GrimoireCon North America 2017. Session 2: Creating Visualizations and Dashboards

GrimoireCon North America 2017. Session 2: Creating Visualizations and Dashboards

Bitergia

May 08, 2017
Tweet

More Decks by Bitergia

Other Decks in Technology

Transcript

  1. Outline Bitergia Analytics Dashboard The Kibana editor Visualizations and Searches

    Modifying and creating dashboards Dashboard: https://xxx.biterg.io Editor: https://xxx.biterg.io/edit ElasticSearch: https://xxx.biterg.io/data
  2. Some Features Drill down Time frame selection Sharing / embedding

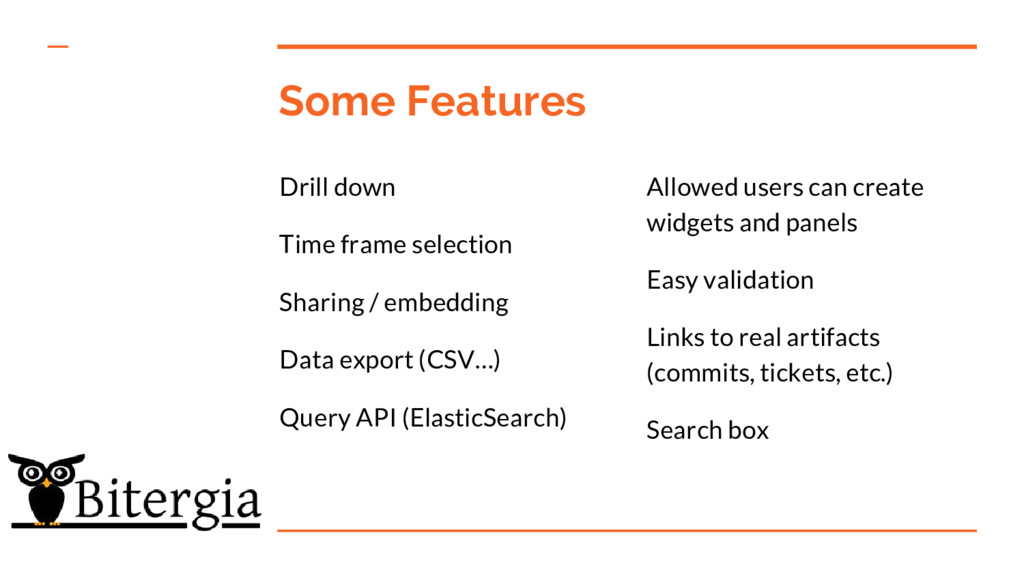
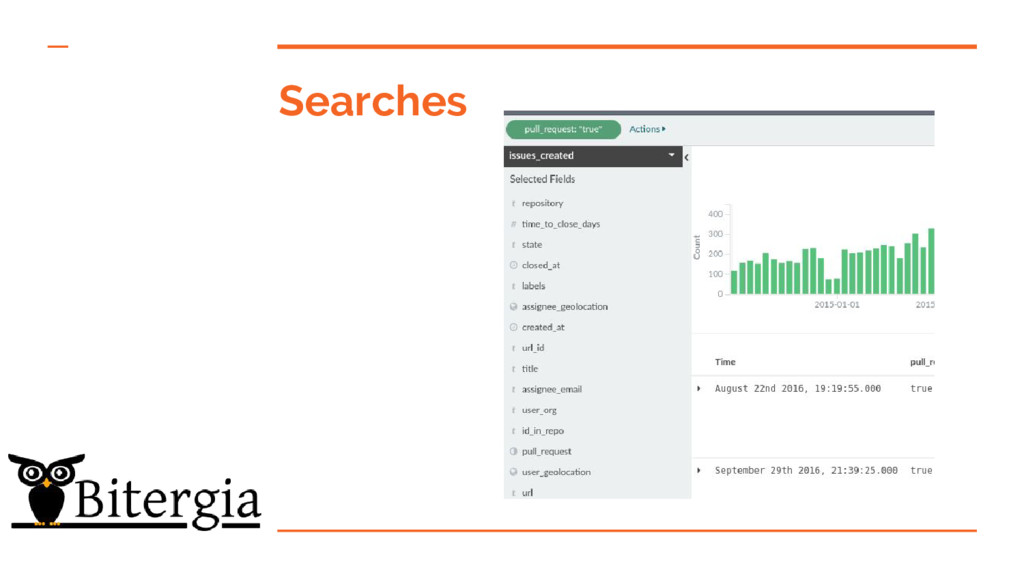
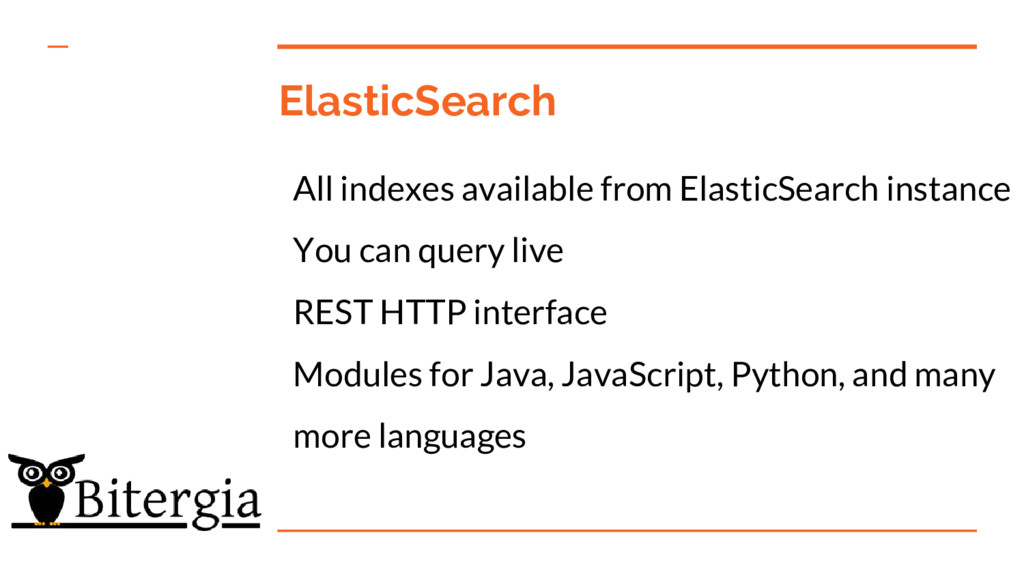
    Data export (CSV…) Query API (ElasticSearch) Allowed users can create widgets and panels Easy validation Links to real artifacts (commits, tickets, etc.) Search box
  3. Kibana editor for the dashboard Same data, with interface for

    editing - Edit & create visualizations - Tweak searches - Build your own panels
  4. Main components Index patterns (mapping to ES indexes) Searches (may

    include filters) Visualizations (on top of searches or indexes) Dashboards (panels)
  5. Index patterns Mapping in Kibana of one or more Elasticsearch

    indexes Fields of different types (number, string, date) Unfolding items, field contents are shown… ...and they can be used as filters
  6. Searches Views for index patterns May include a filter May

    include only some fields Can be included in a dashboard Can be saved / recovered
  7. Visualizations Based on an index pattern, or in a search

    Different kinds Data organized in metrics and buckets Can be saved / retrieved / edited
  8. Dashboards (panels) • Visualizations can be added, removed, moved, edited

    • Dashboards can be saved, retrieved • Filters, date filters can be saved with the dashboard • Dashboards can be shated, bookmarked
  9. Retrieving data with Perceval In a Python3 environment… $ pip3

    install perceval $ perceval git https://github.com/grimoirelab/perceval.git [2016-10-03 00:47:46,632] - Sir Perceval is on his quest. [2016-10-03 00:47:46,633] - Fetching commits: 'https://github.com/grimoirelab/perceval.git' git repository from 1970-01-01 00:00:00+00:00; all branches { "backend_name": "Git", "backend_version": "0.3.0", "data": { "Author": "Santiago Due\u00f1as <[email protected]>", "AuthorDate": "Tue Aug 18 18:08:27 2015 +0200", "Commit": "Santiago Due\u00f1as <[email protected]>", "CommitDate": "Tue Aug 18 18:08:27 2015 +0200", "commit": "dc78c254e464ff334892e0448a23e4cfbfc637a3", ….
  10. Retrieving data with Perceval from Python from perceval.backends.core.github import GitHub

    # GitHub object for owner / repo, repo_dir for cloning repo = GitHub(owner=owner, repository=repo, api_token=args.token) # fetch all issues/pull requests for item in repo.fetch(): if 'pull_request' in item['data']: kind = 'Pull request' else: kind = 'Issue' print(item['data']['number'], ':', kind)
  11. Creating indexes for a dashboard $ pip install grimoire-elk $

    pip install grimoire-kidash $ p2o.py --enrich --index git_raw --index-enrich git \ -e http://localhost:9200 --no_inc --debug \ git https://github.com/grimoirelab/perceval.git $ kidash.py -e http://localhost:9200 \ --import git-dashboard.json Results: Raw index: git_raw Kibana dashboard Enriched index: git
  12. ElasticSearch All indexes available from ElasticSearch instance You can query

    live REST HTTP interface Modules for Java, JavaScript, Python, and many more languages
  13. Querying ElasticSearch API $ curl -XGET "http://elasticsearch_url/git/_search/?size=1&pretty" {... "hits" :

    { "total" : 407, "hits" : [ { "_index" : "commits", "_type" : "summary", "_id" : "AVfPp9Po5xUyv5saVPKU", "_score" : 1.0, "_source" : { "hash" : "d1253dd9876bb76e938a861acaceaae95241b46d", "commit" : "Santiago Dueñas <[email protected]>", "author" : "Santiago Dueñas <[email protected]>", "author_date" : "Wed Nov 18 10:59:52 2015 +0100", "files_no" : 3, "commit_date" : "Wed Nov 18 14:41:21 2015 +0100" }} ] } }
  14. Python scripting from elasticsearch import Elasticsearch from elasticsearch_dsl import Search

    es = Elasticsearch(["elasticsearch_url”] s = Search(using=es, index=’git’) s = s.filter('range', files={'gt':0}) s = s.filter('range', author_date={'gt': datetime(2016, 7, 1)}) s.aggs.metric('commits', 'cardinality', field='hash') s.aggs.bucket('histogram', 'date_histogram', field='author_date', interval='quarter') by_q = s.execute() for quarter in by_q.to_dict()['aggregations']['histogram']['buckets']: print("Unique commits for quarter starting on ", Quarter['key_as_string'], ": ", quarter['doc_count'])
  15. How to play You can create your own Start by

    saving panels with a new name Edit visualizations (save with different names) If needed, modify the searches
  16. Documentation A lot of documentation & videos are available: -

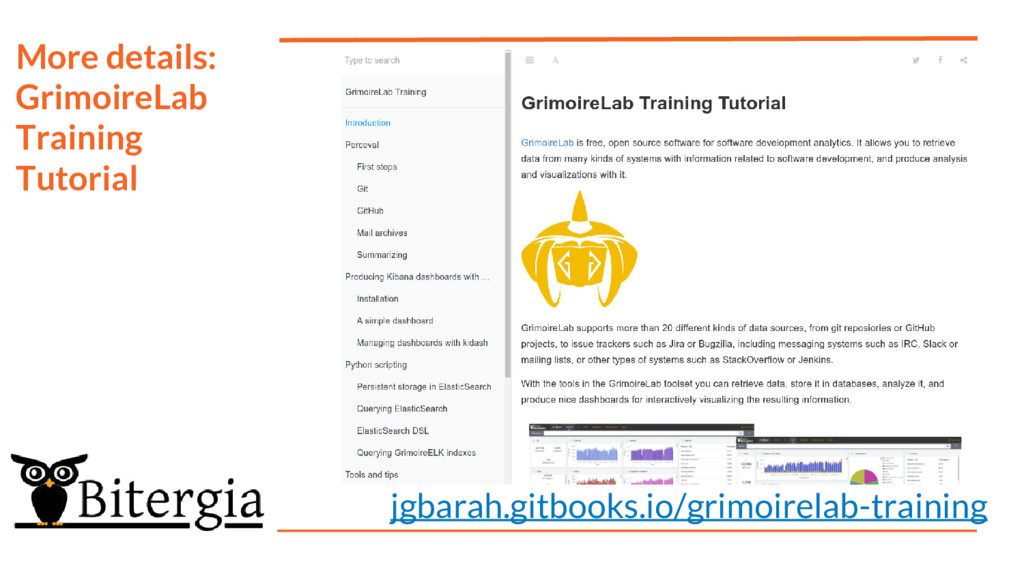
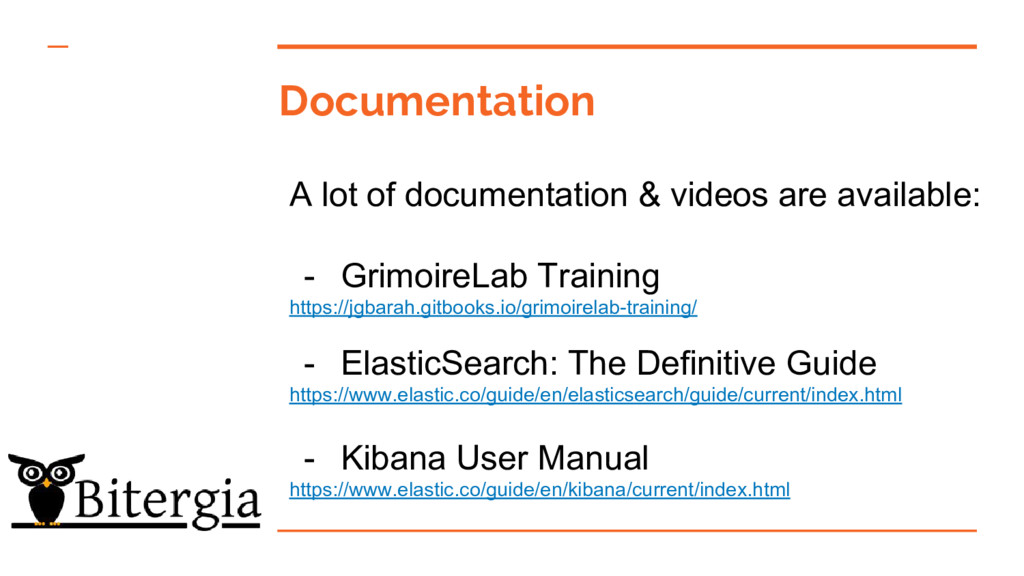
    GrimoireLab Training https://jgbarah.gitbooks.io/grimoirelab-training/ - ElasticSearch: The Definitive Guide https://www.elastic.co/guide/en/elasticsearch/guide/current/index.html - Kibana User Manual https://www.elastic.co/guide/en/kibana/current/index.html
  17. Come and play Feel free to play with the dashboard

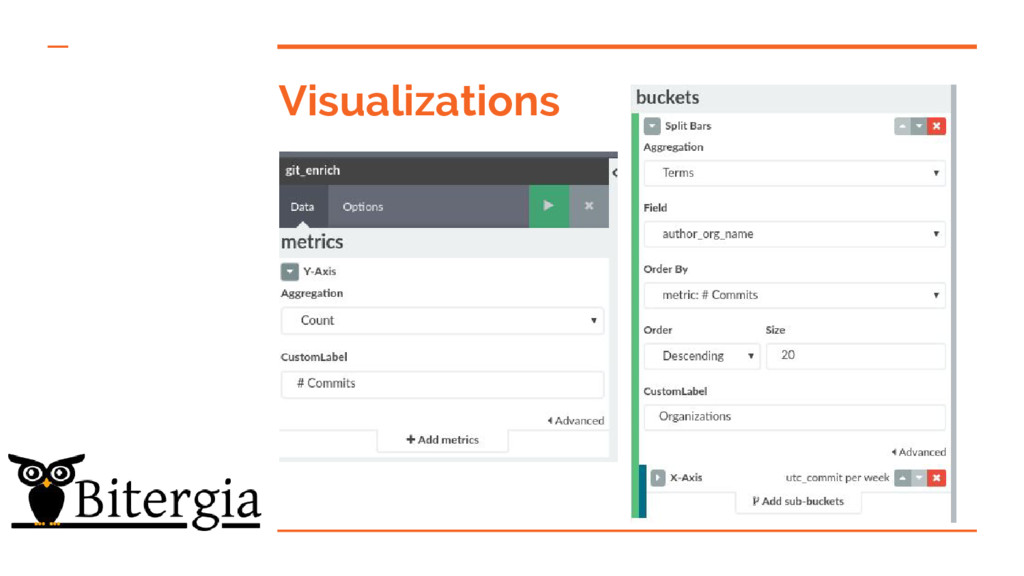
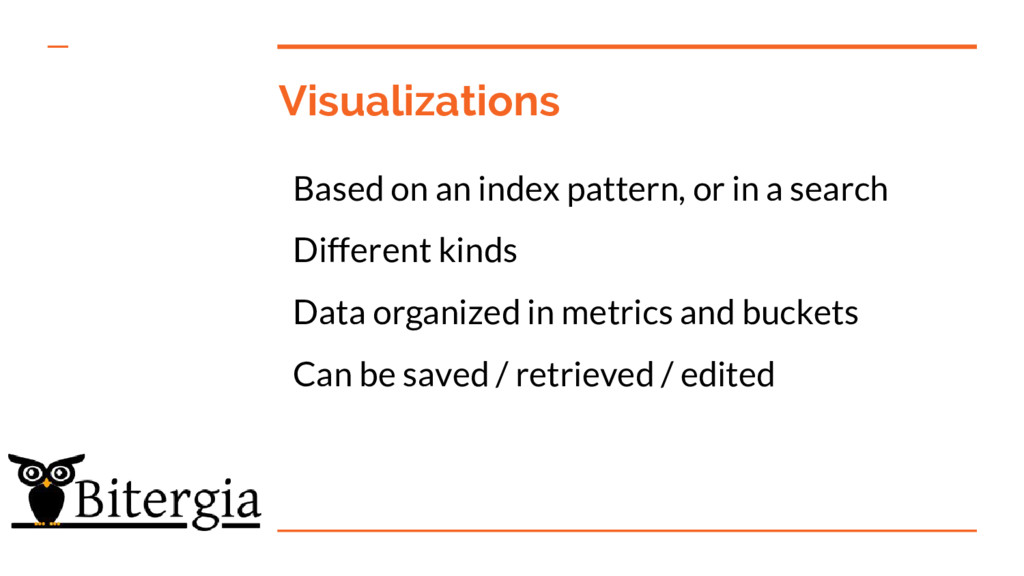
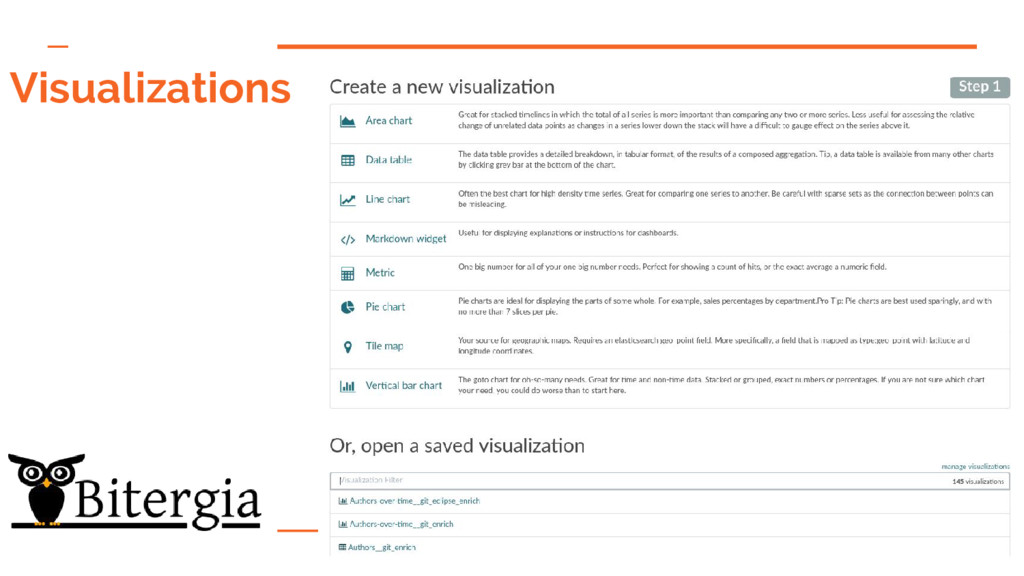
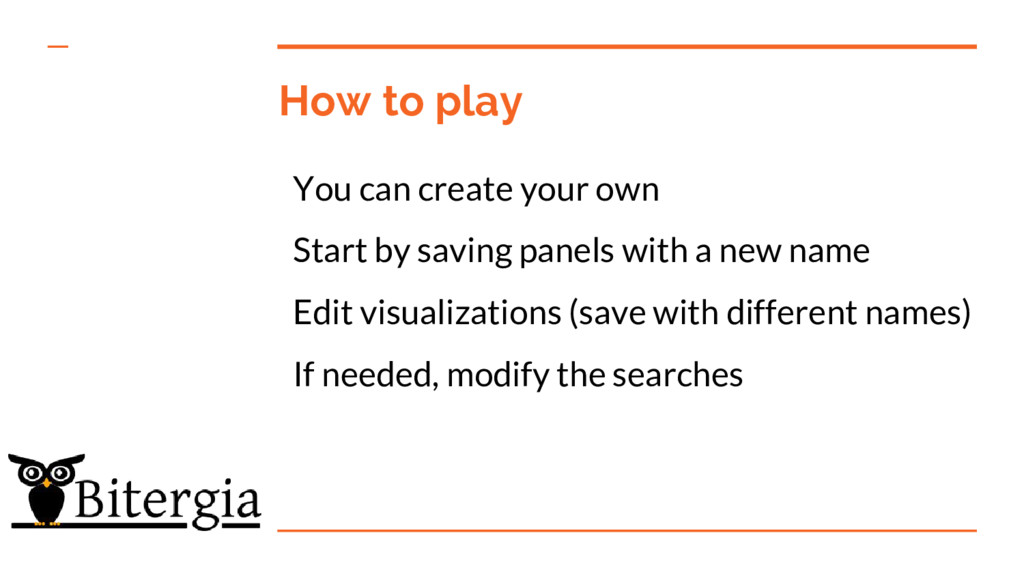
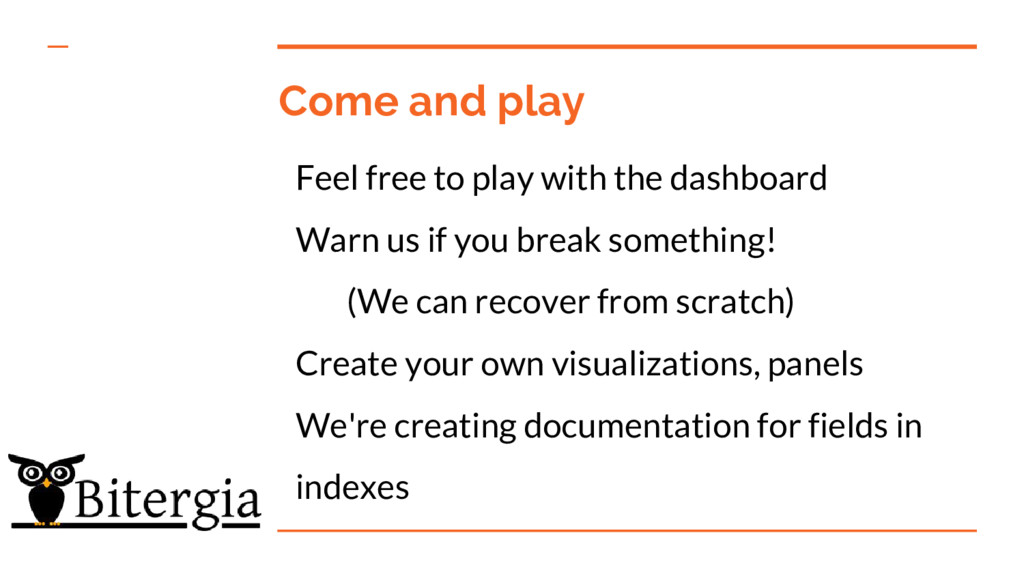
    Warn us if you break something! (We can recover from scratch) Create your own visualizations, panels We're creating documentation for fields in indexes