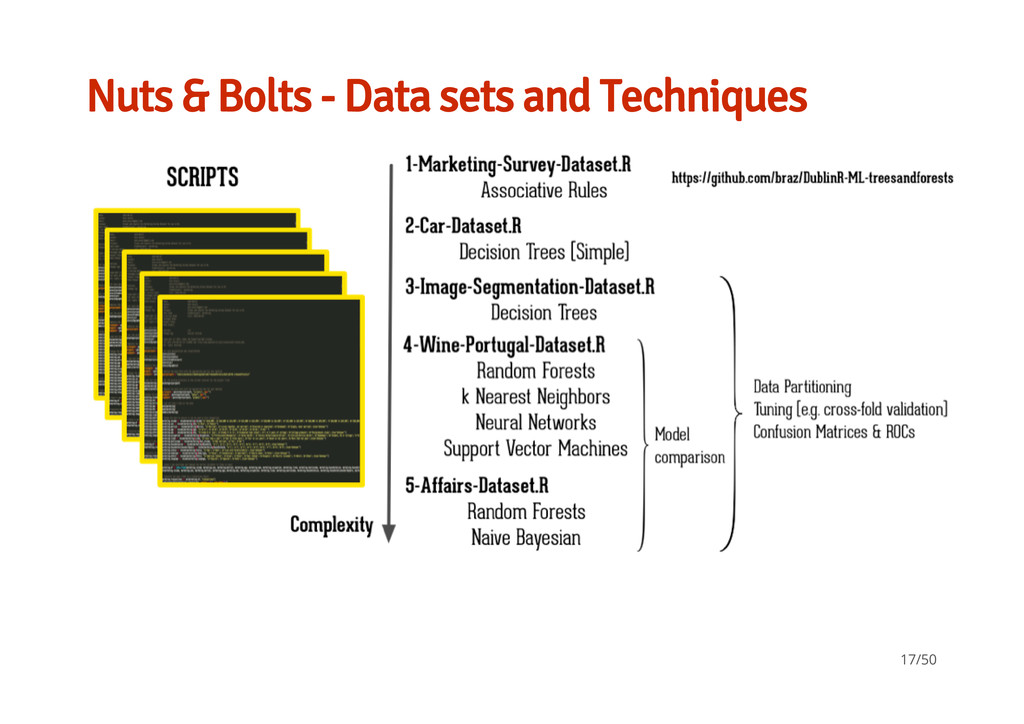
ML How can you interpret their results? A few techniques to improve prediction / reduce over-fitting Kaggle & similar competitions - using ML for fun & profit Nuts & Bolts - 4 data sets and 6 techniques A brief tour of some useful data handling / formatting tools 2/50
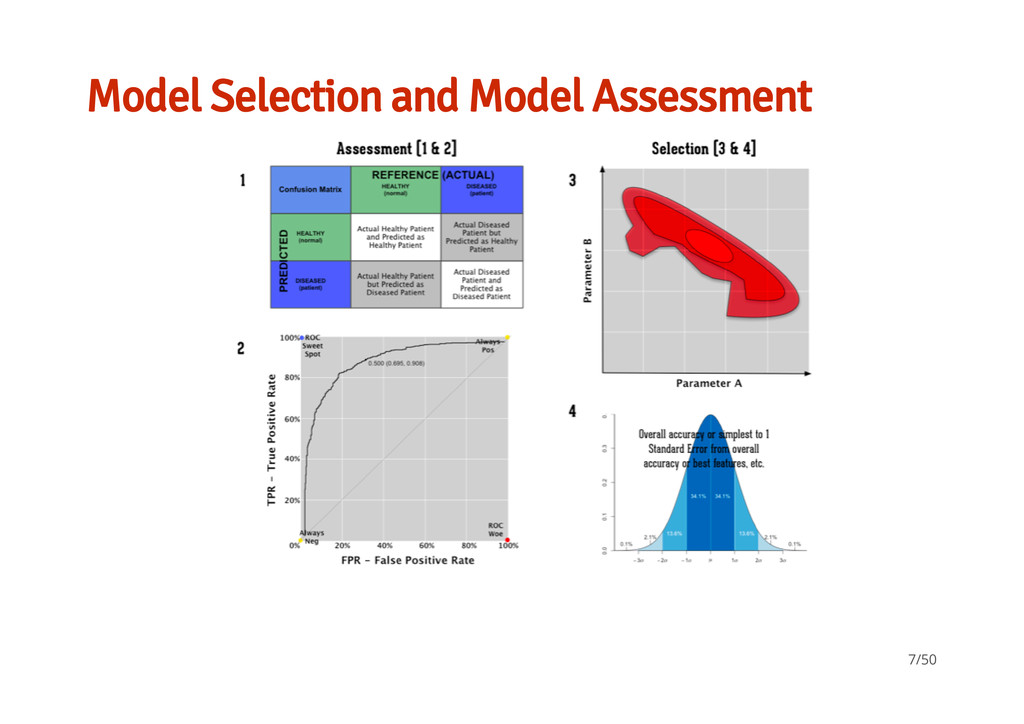
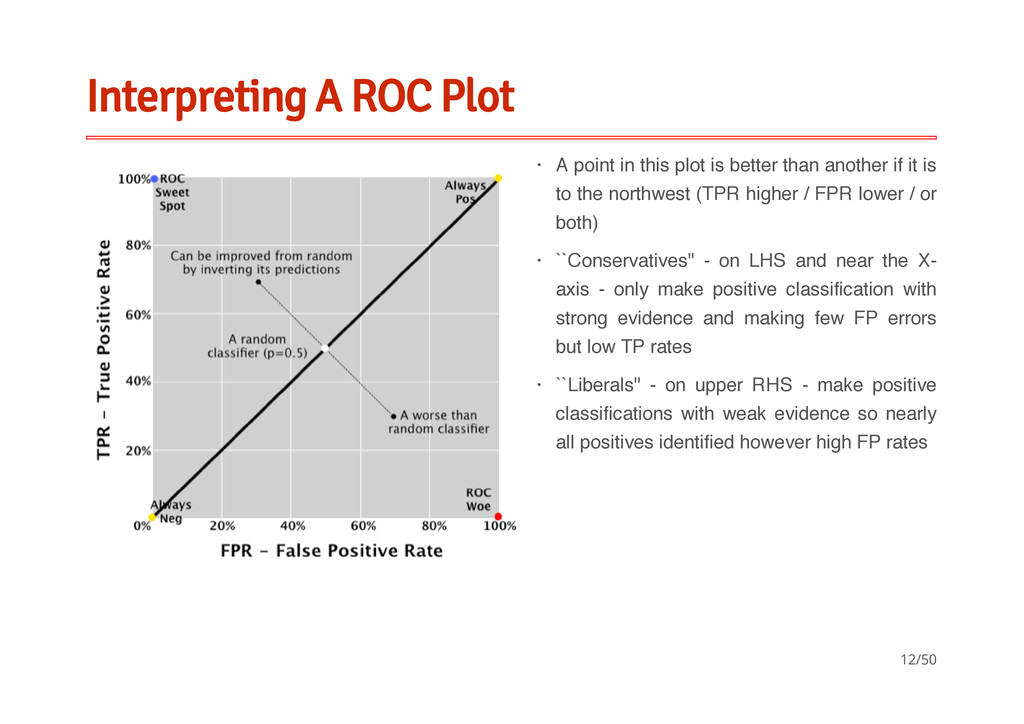
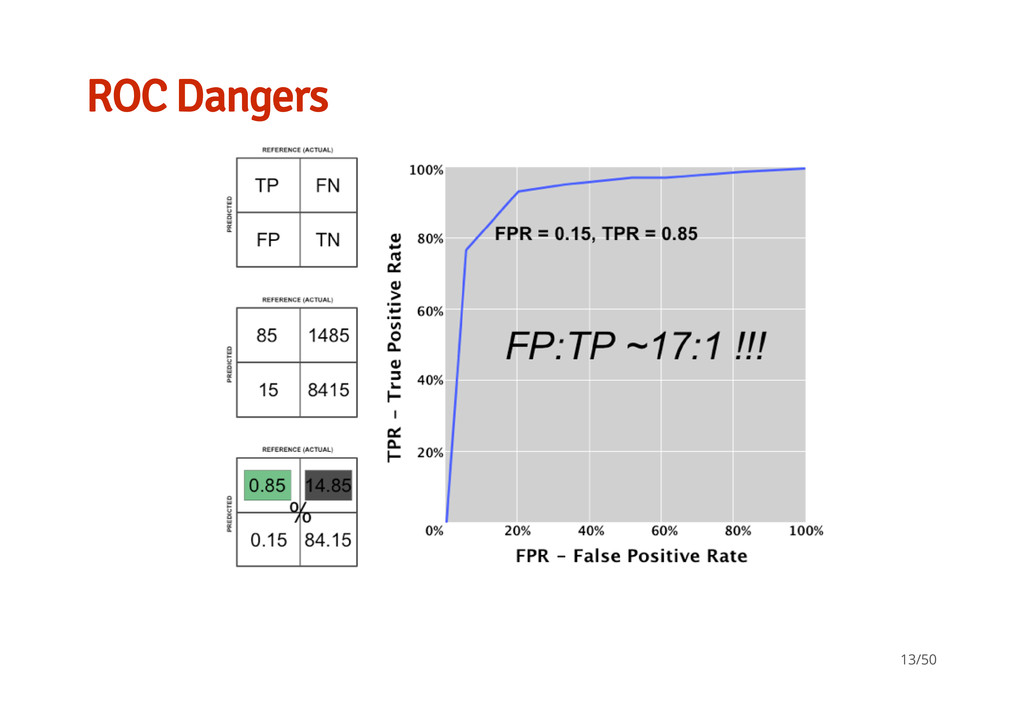
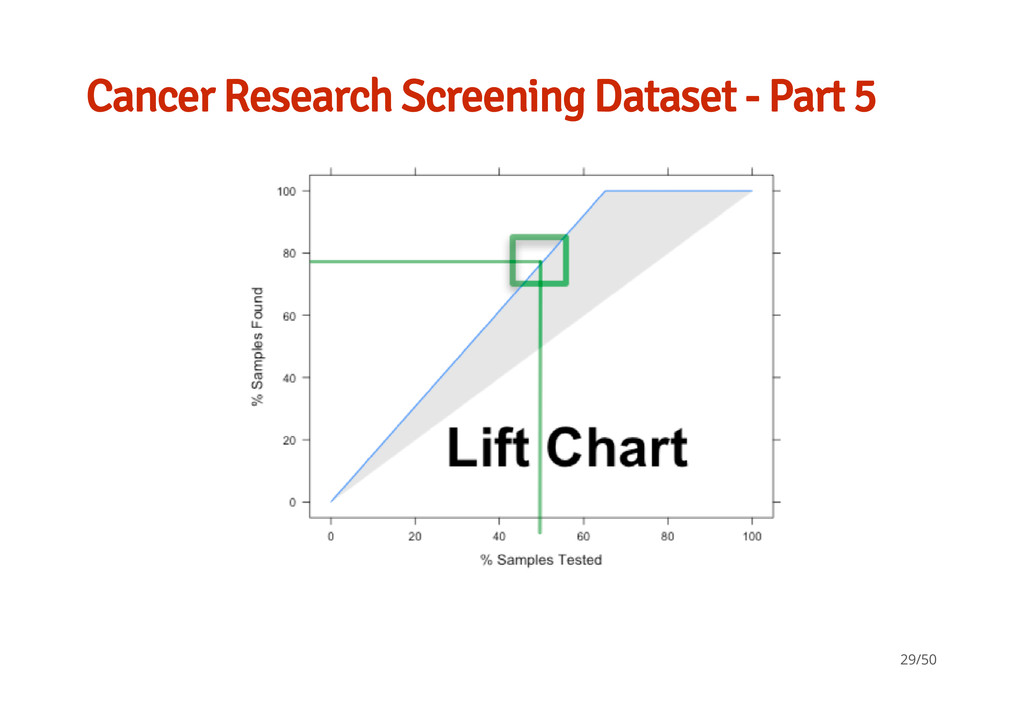
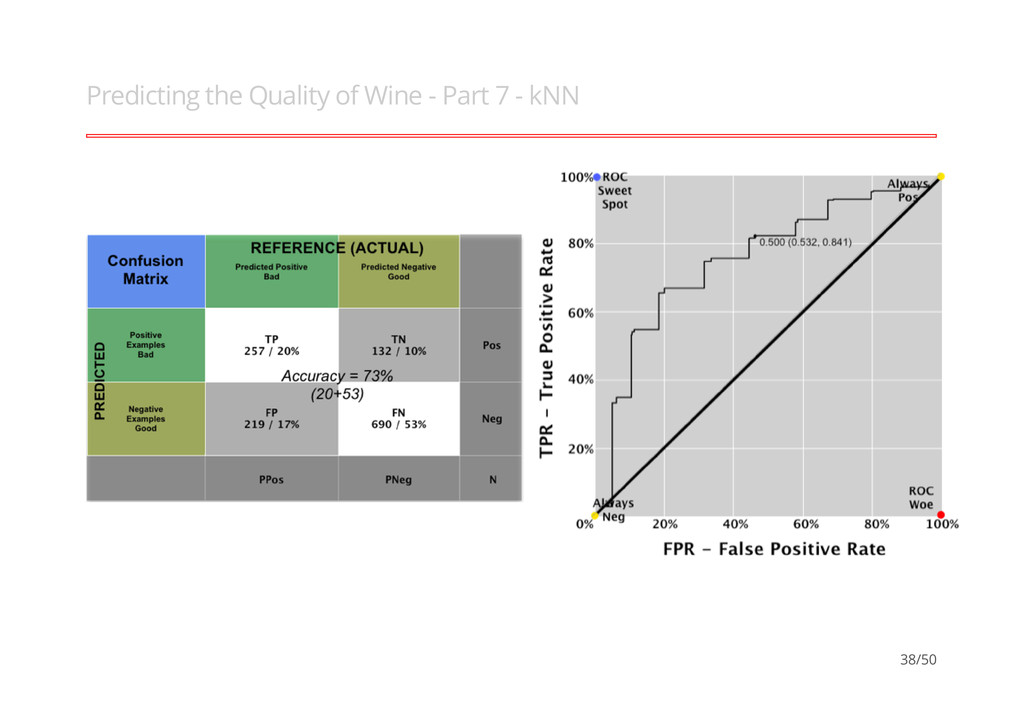
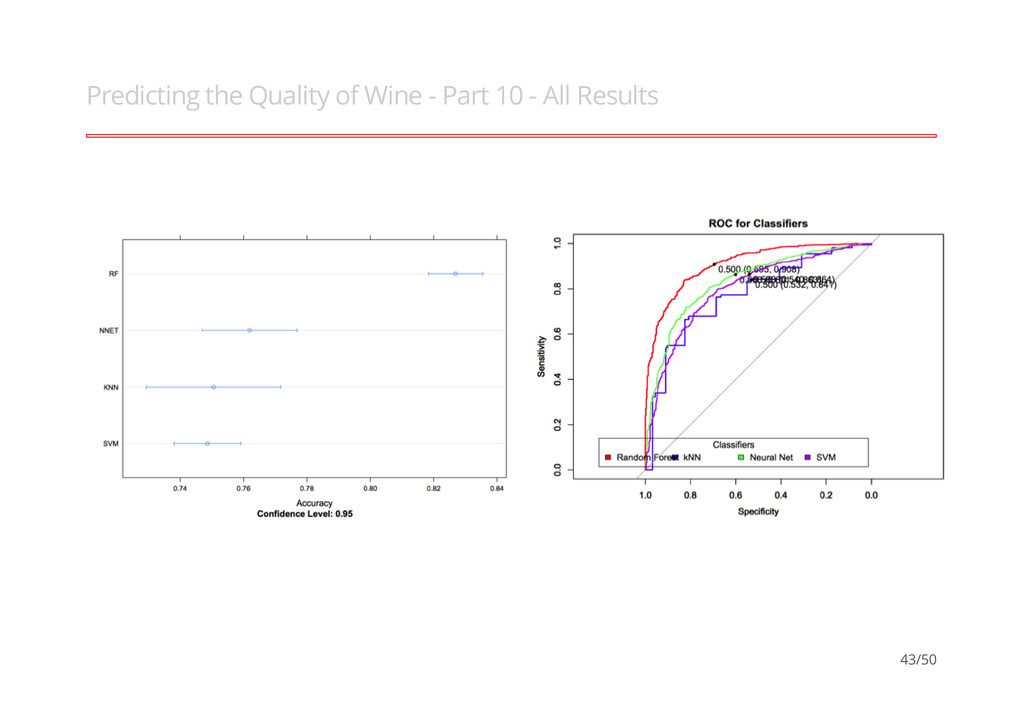
better than another if it is to the northwest (TPR higher / FPR lower / or both) ``Conservatives'' - on LHS and near the X- axis - only make positive classification with strong evidence and making few FP errors but low TP rates ``Liberals'' - on upper RHS - make positive classifications with weak evidence so nearly all positives identified however high FP rates · · · 12/50
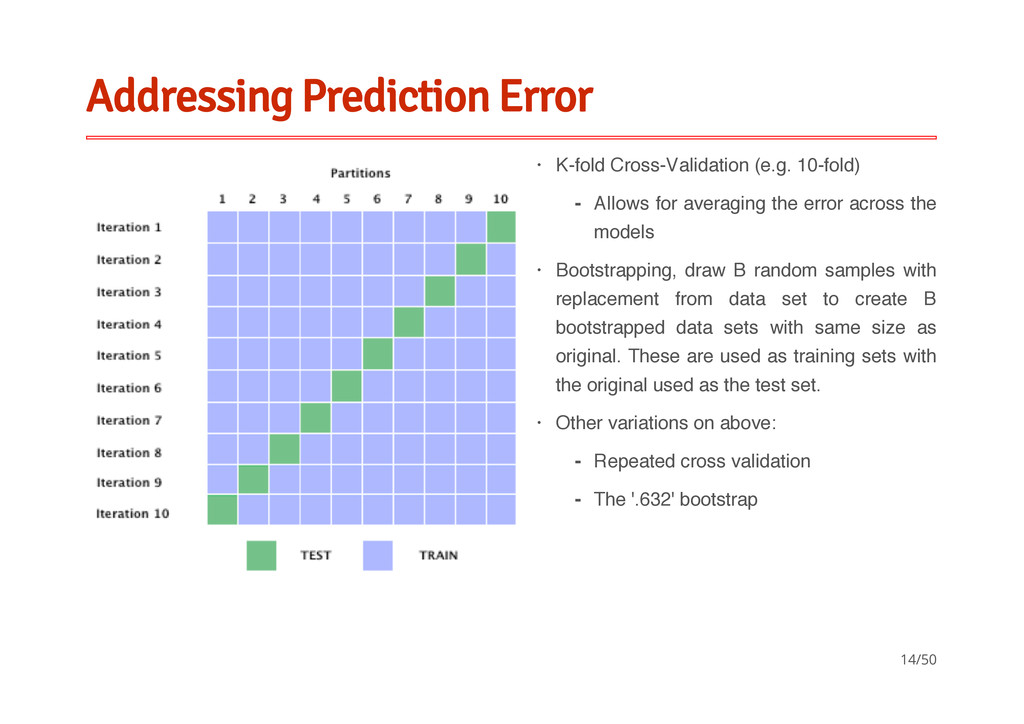
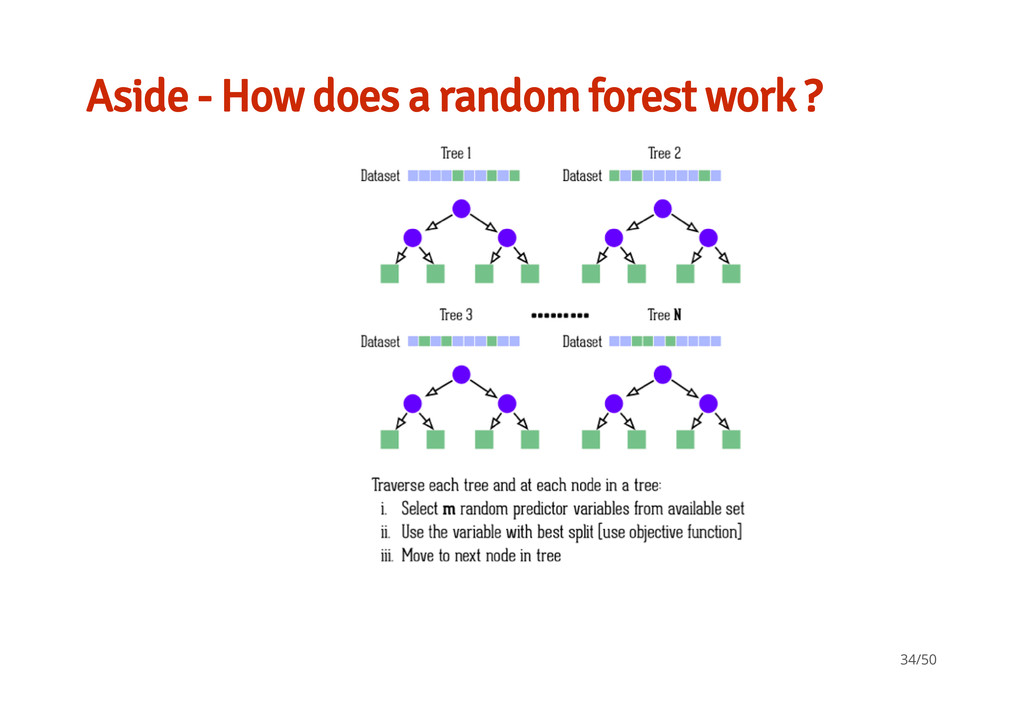
random samples with replacement from data set to create B bootstrapped data sets with same size as original. These are used as training sets with the original used as the test set. Other variations on above: · Allows for averaging the error across the models - · · Repeated cross validation The '.632' bootstrap - - 14/50
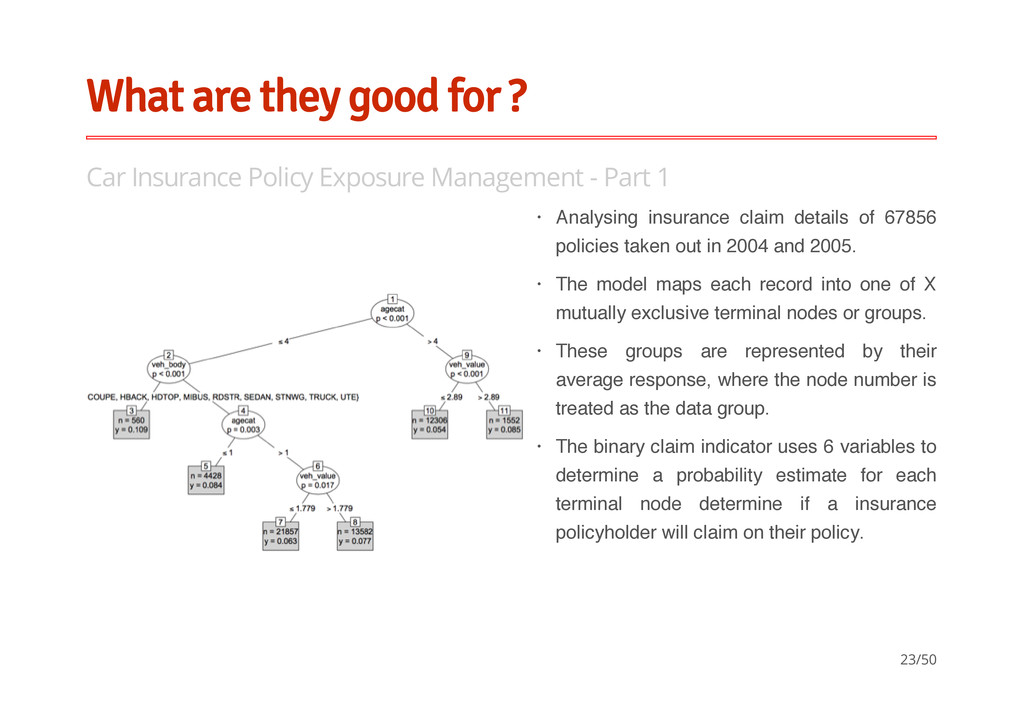
Management - Part 1 Analysing insurance claim details of 67856 policies taken out in 2004 and 2005. The model maps each record into one of X mutually exclusive terminal nodes or groups. These groups are represented by their average response, where the node number is treated as the data group. The binary claim indicator uses 6 variables to determine a probability estimate for each terminal node determine if a insurance policyholder will claim on their policy. · · · · 23/50
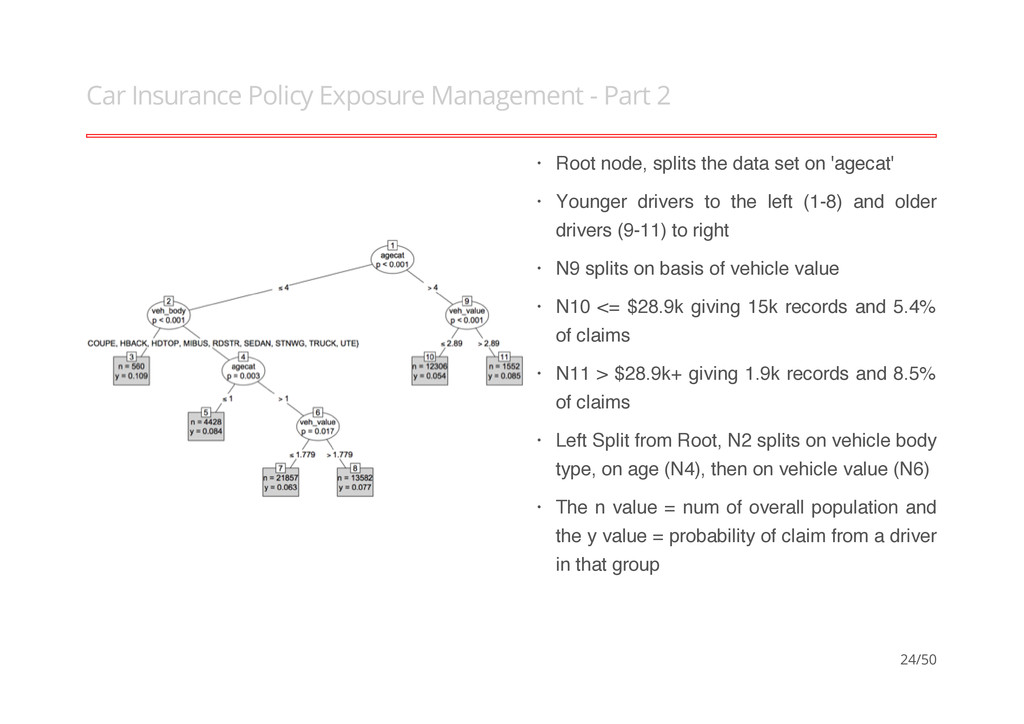
splits the data set on 'agecat' Younger drivers to the left (1-8) and older drivers (9-11) to right N9 splits on basis of vehicle value N10 <= $28.9k giving 15k records and 5.4% of claims N11 > $28.9k+ giving 1.9k records and 8.5% of claims Left Split from Root, N2 splits on vehicle body type, on age (N4), then on vehicle value (N6) The n value = num of overall population and the y value = probability of claim from a driver in that group · · · · · · · 24/50
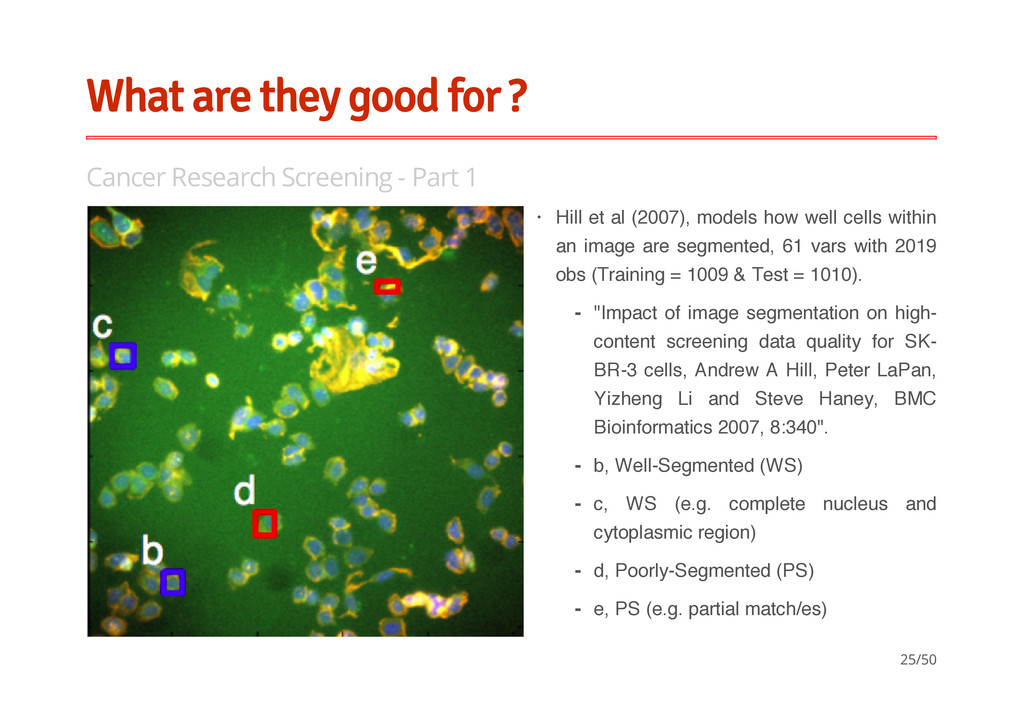
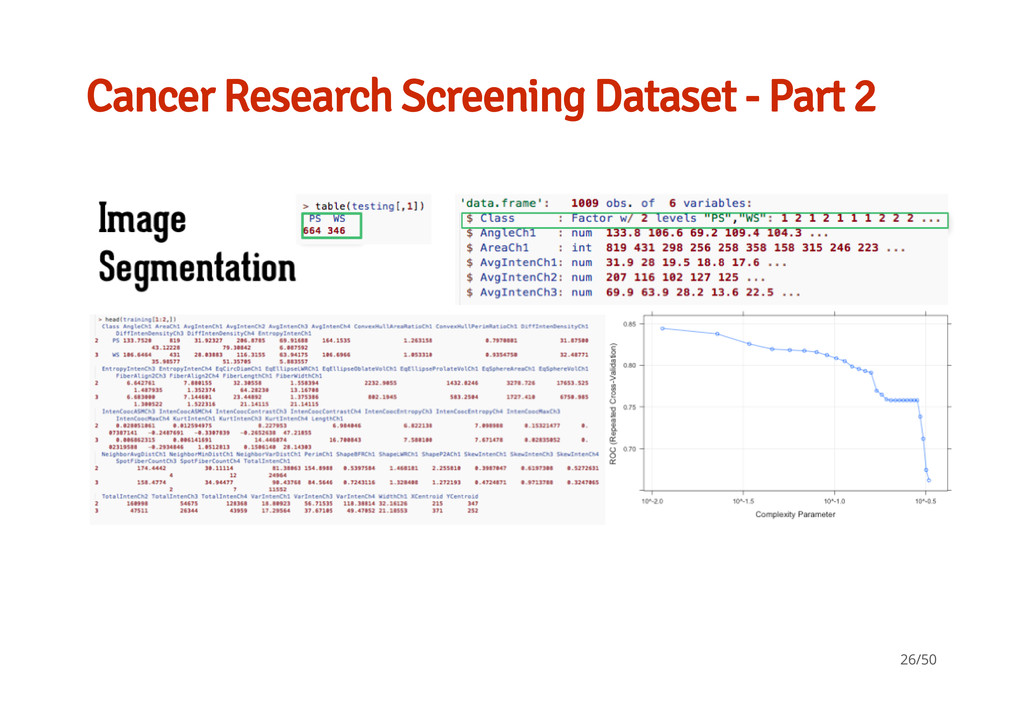
Part 1 Hill et al (2007), models how well cells within an image are segmented, 61 vars with 2019 obs (Training = 1009 & Test = 1010). · "Impact of image segmentation on high- content screening data quality for SK- BR-3 cells, Andrew A Hill, Peter LaPan, Yizheng Li and Steve Haney, BMC Bioinformatics 2007, 8:340". b, Well-Segmented (WS) c, WS (e.g. complete nucleus and cytoplasmic region) d, Poorly-Segmented (PS) e, PS (e.g. partial match/es) - - - - - 25/50
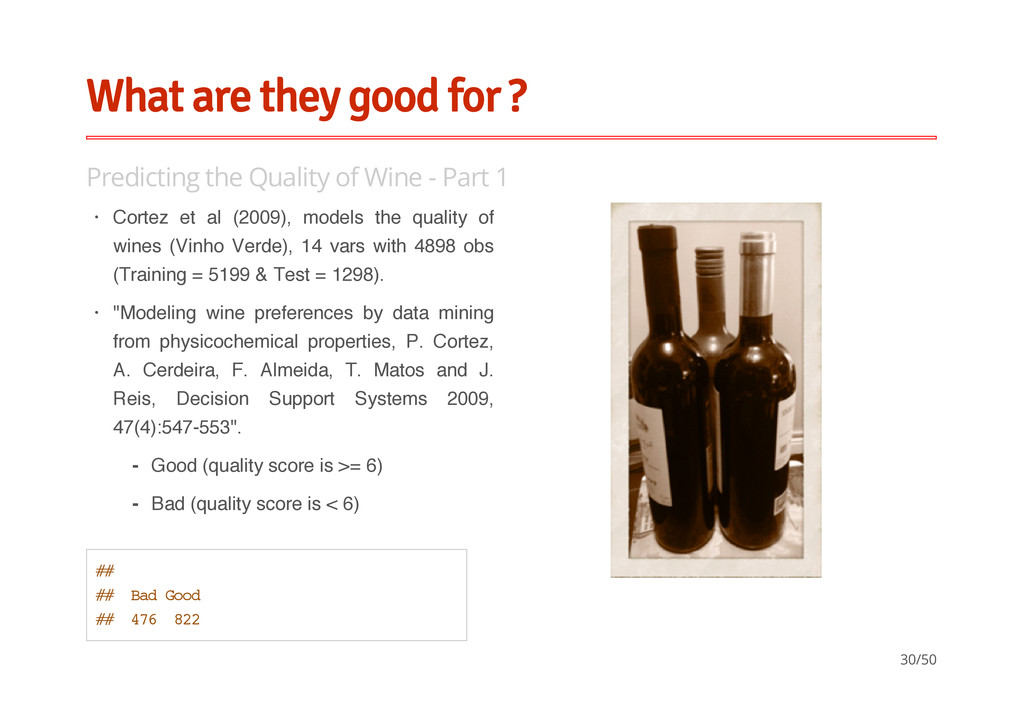
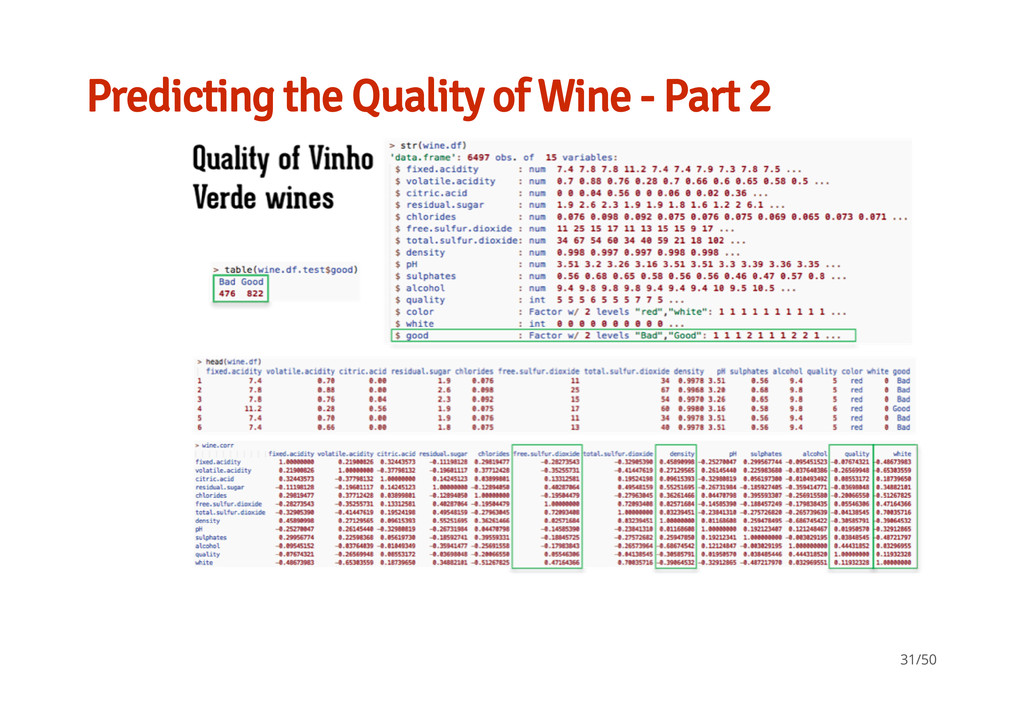
Wine - Part 1 Cortez et al (2009), models the quality of wines (Vinho Verde), 14 vars with 4898 obs (Training = 5199 & Test = 1298). "Modeling wine preferences by data mining from physicochemical properties, P. Cortez, A. Cerdeira, F. Almeida, T. Matos and J. Reis, Decision Support Systems 2009, 47(4):547-553". · · Good (quality score is >= 6) Bad (quality score is < 6) - - ## ## Bad Good ## 476 822 30/50
with Trees Deal with irrelevant inputs No data preprocessing required Scalable computation (fast to build) Tolerant with missing values (little loss of accuracy) Only a few tunable parameters (easy to learn) Allows for human understandable graphic representation · · · · · · Data fragmentation for high-dimensional sparse data set (over-fitting) Difficult to fit to a trend / piece-wise constant model Highly influenced by changes to the data set and local optima (deep trees might be questionable as the errors propagate down) · · · 33/50
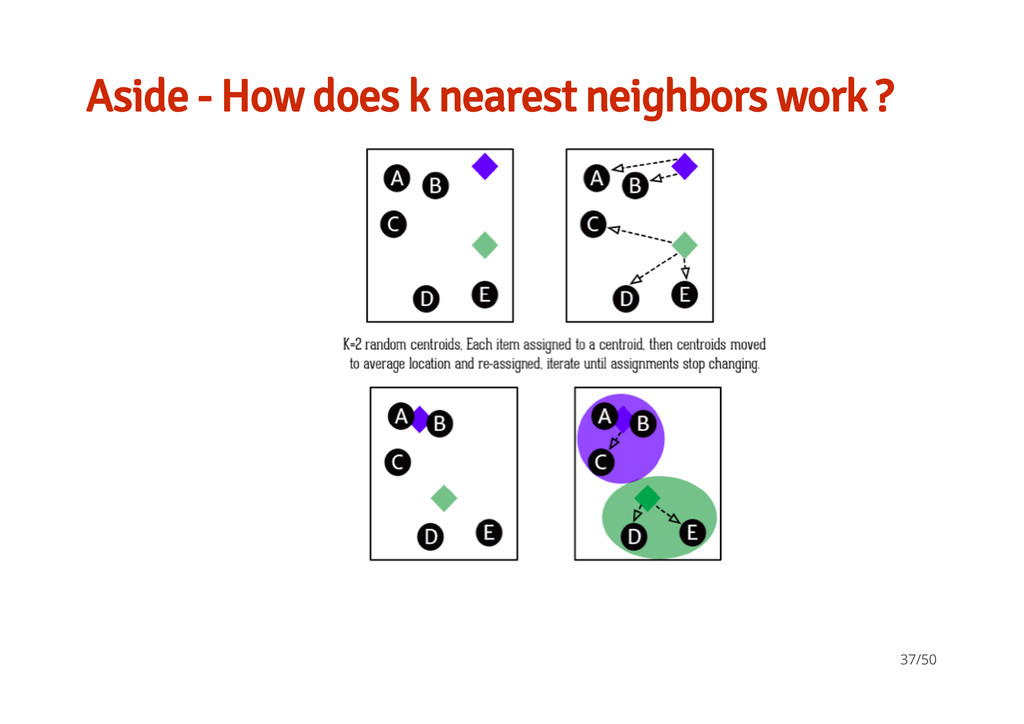
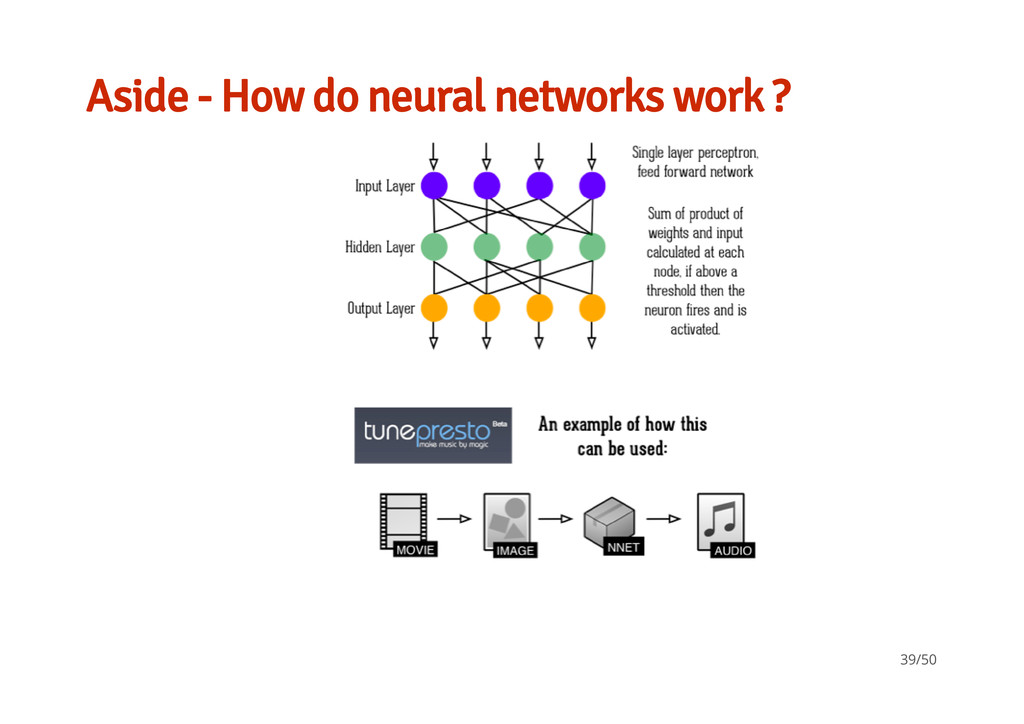
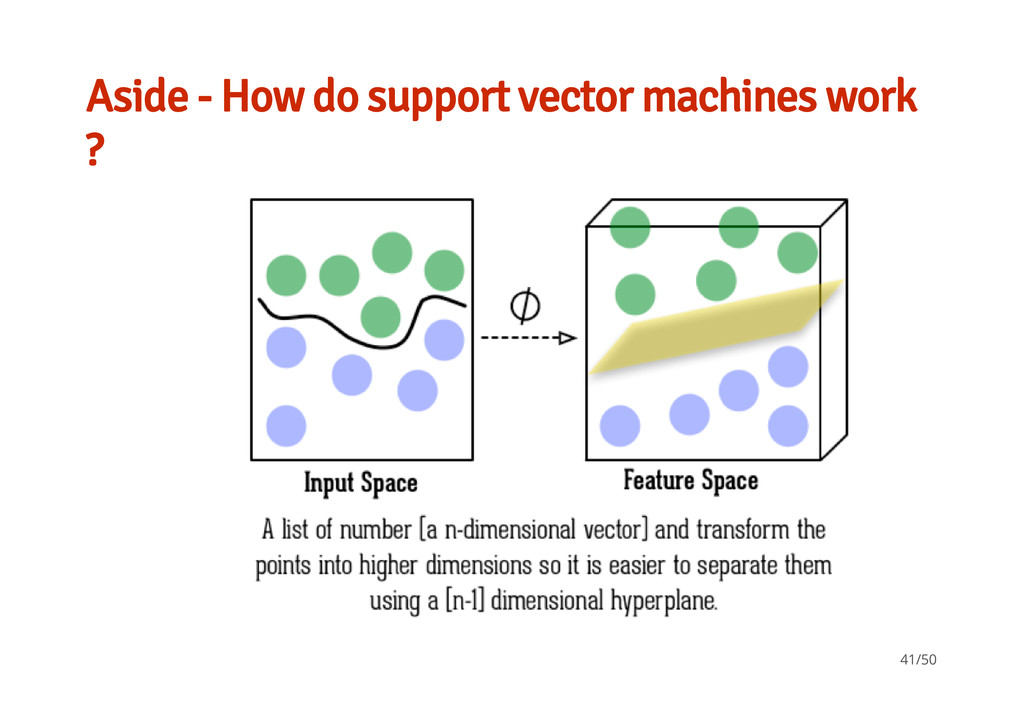
ML methods K-nearest neighbors Neural Nets · Unsupervised learning / non-target based learning Distance matrix / cluster analysis using Euclidean distances. - - · Looking at basic feed forward simple 3- layer network (input, 'processing', output) Each node / neuron is a set of numerical parameters / weights tuned by the learning algorithm used - - Support Vector Machines · Supervised learning non-probabilistic binary linear classifier / nonlinear classifiers by applying the kernel trick constructs a hyper-plane/s in a high- dimensional space - - - 36/50
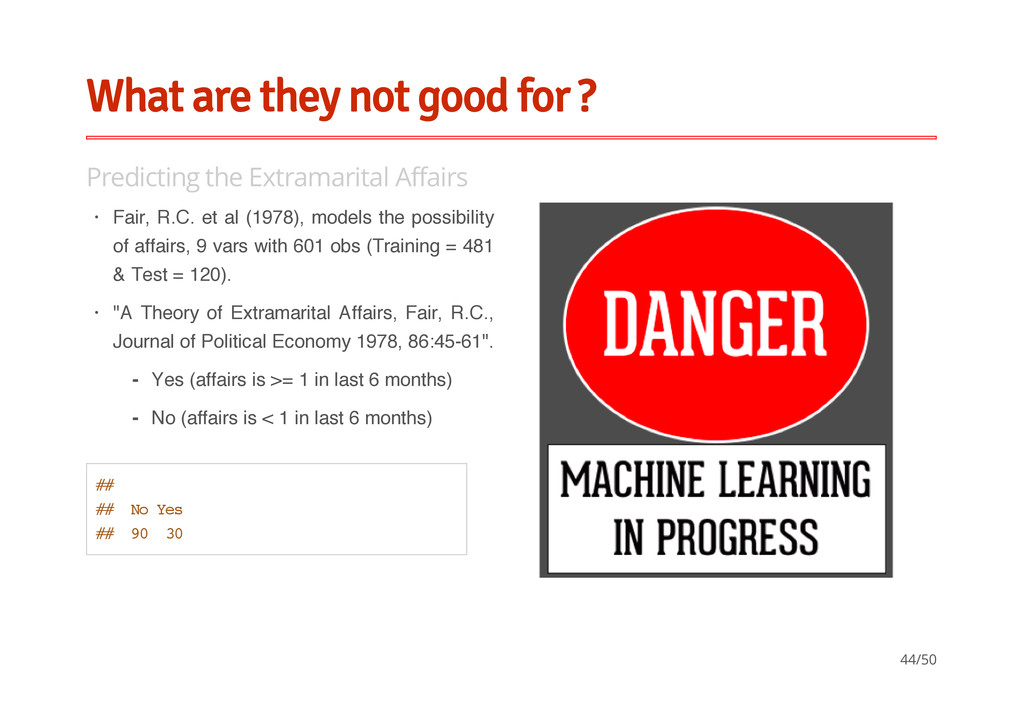
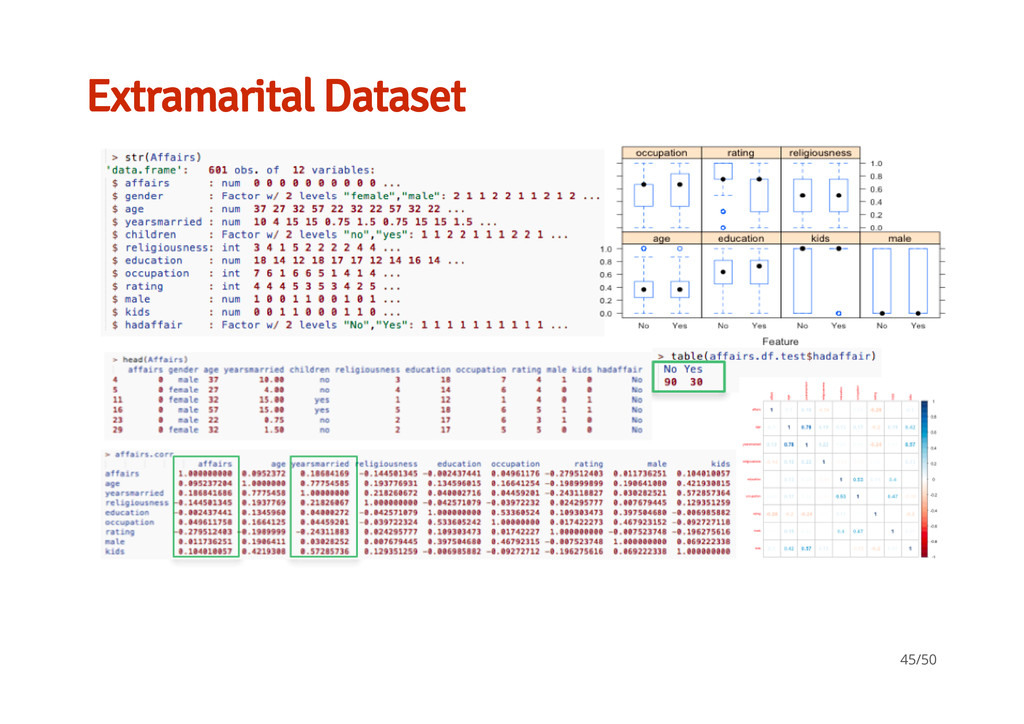
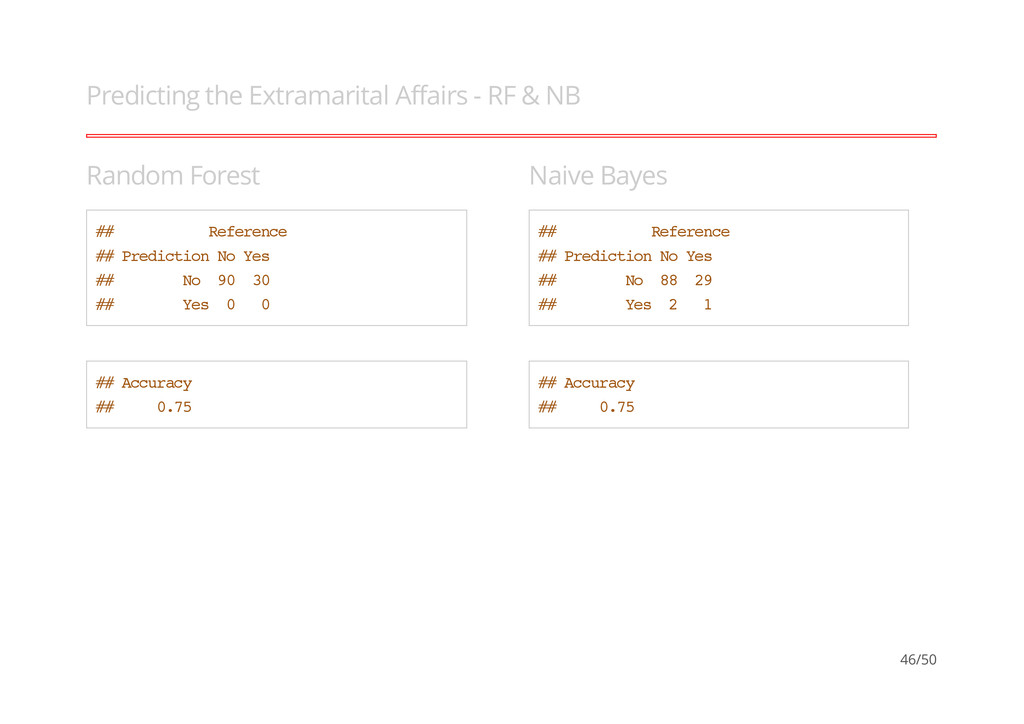
Affairs Fair, R.C. et al (1978), models the possibility of affairs, 9 vars with 601 obs (Training = 481 & Test = 120). "A Theory of Extramarital Affairs, Fair, R.C., Journal of Political Economy 1978, 86:45-61". · · Yes (affairs is >= 1 in last 6 months) No (affairs is < 1 in last 6 months) - - ## ## No Yes ## 90 30 44/50
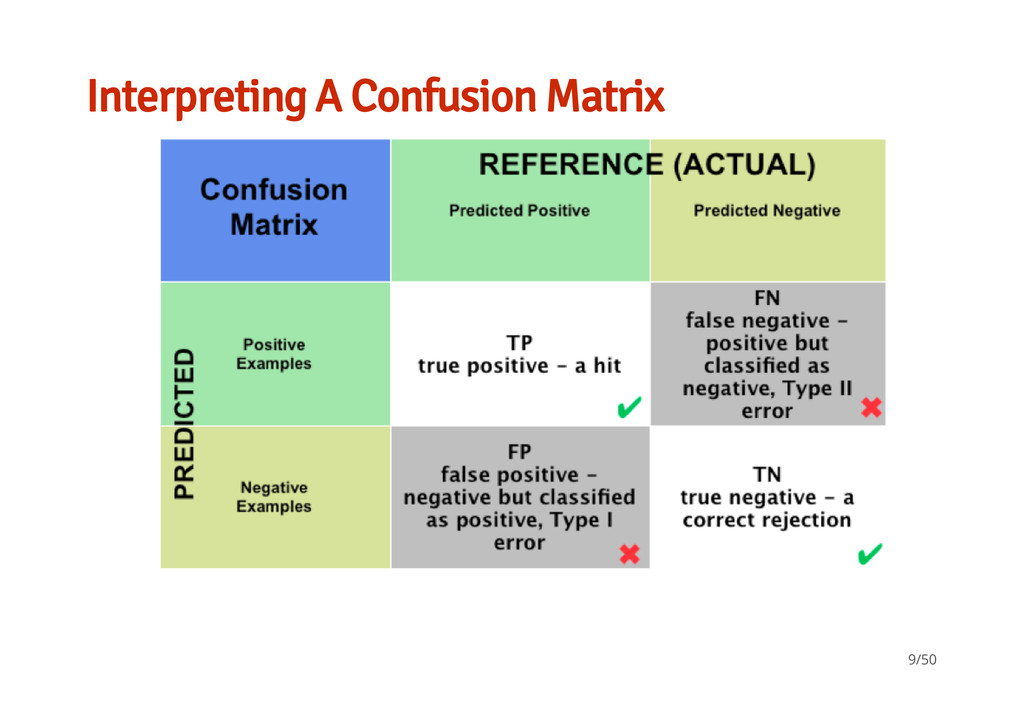
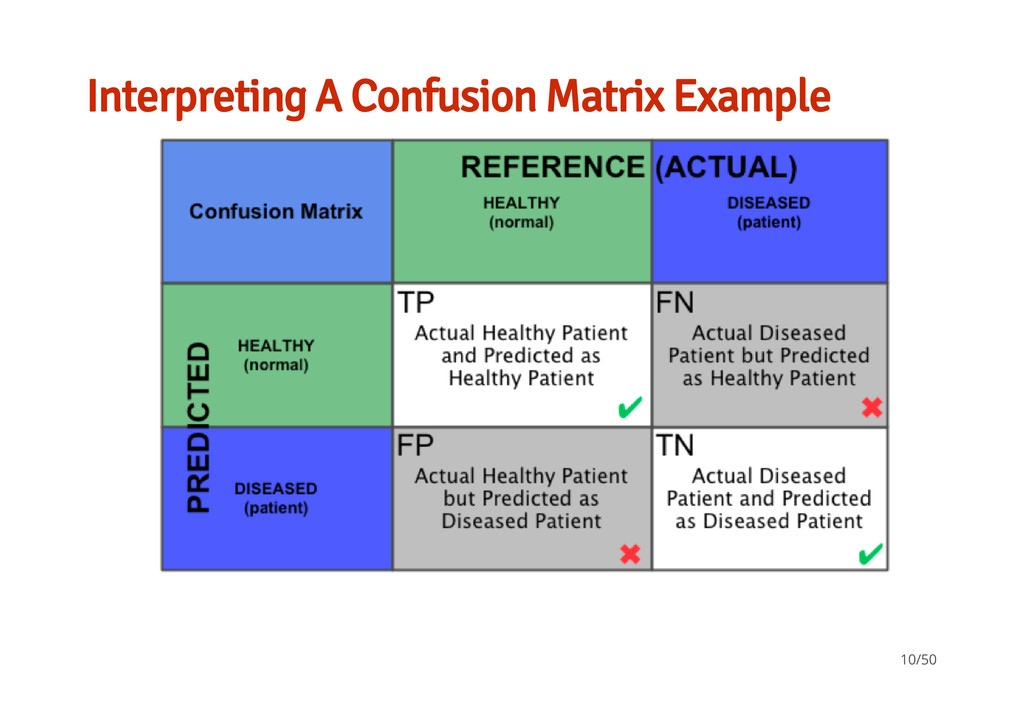
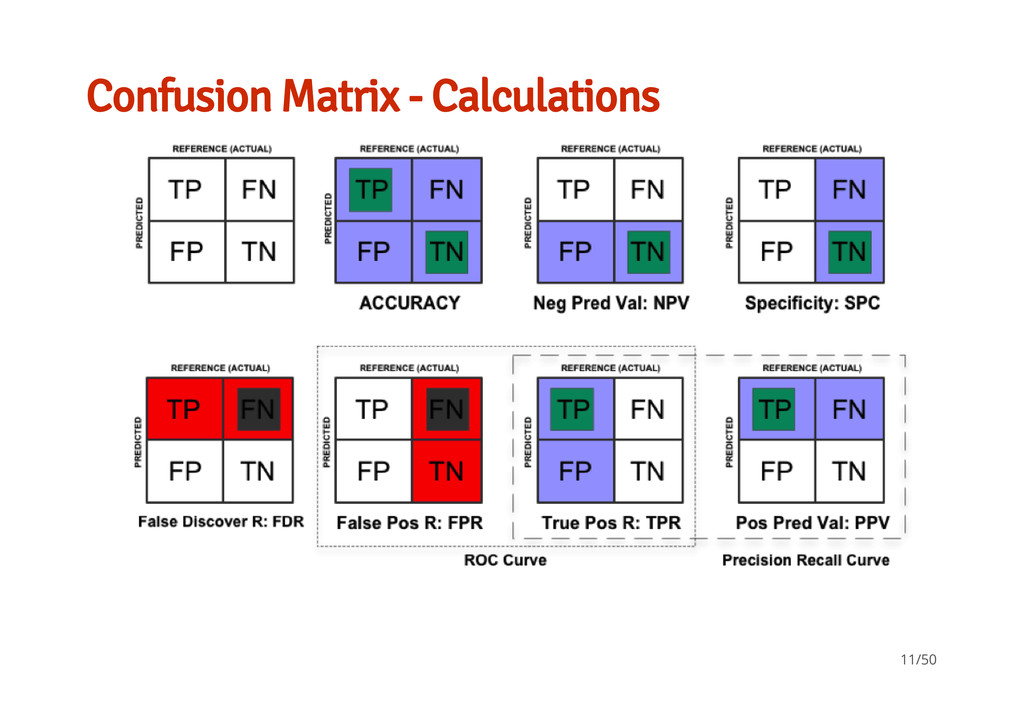
classifiers available in ML. What a confusion matrix and ROC means for a classifier and how to interpret them An idea of how to test a set of techniques and parameters to help you find the best model for your data Slides, Data, Scripts are all on GH: https://github.com/braz/DublinR-ML-treesandforests 50/50