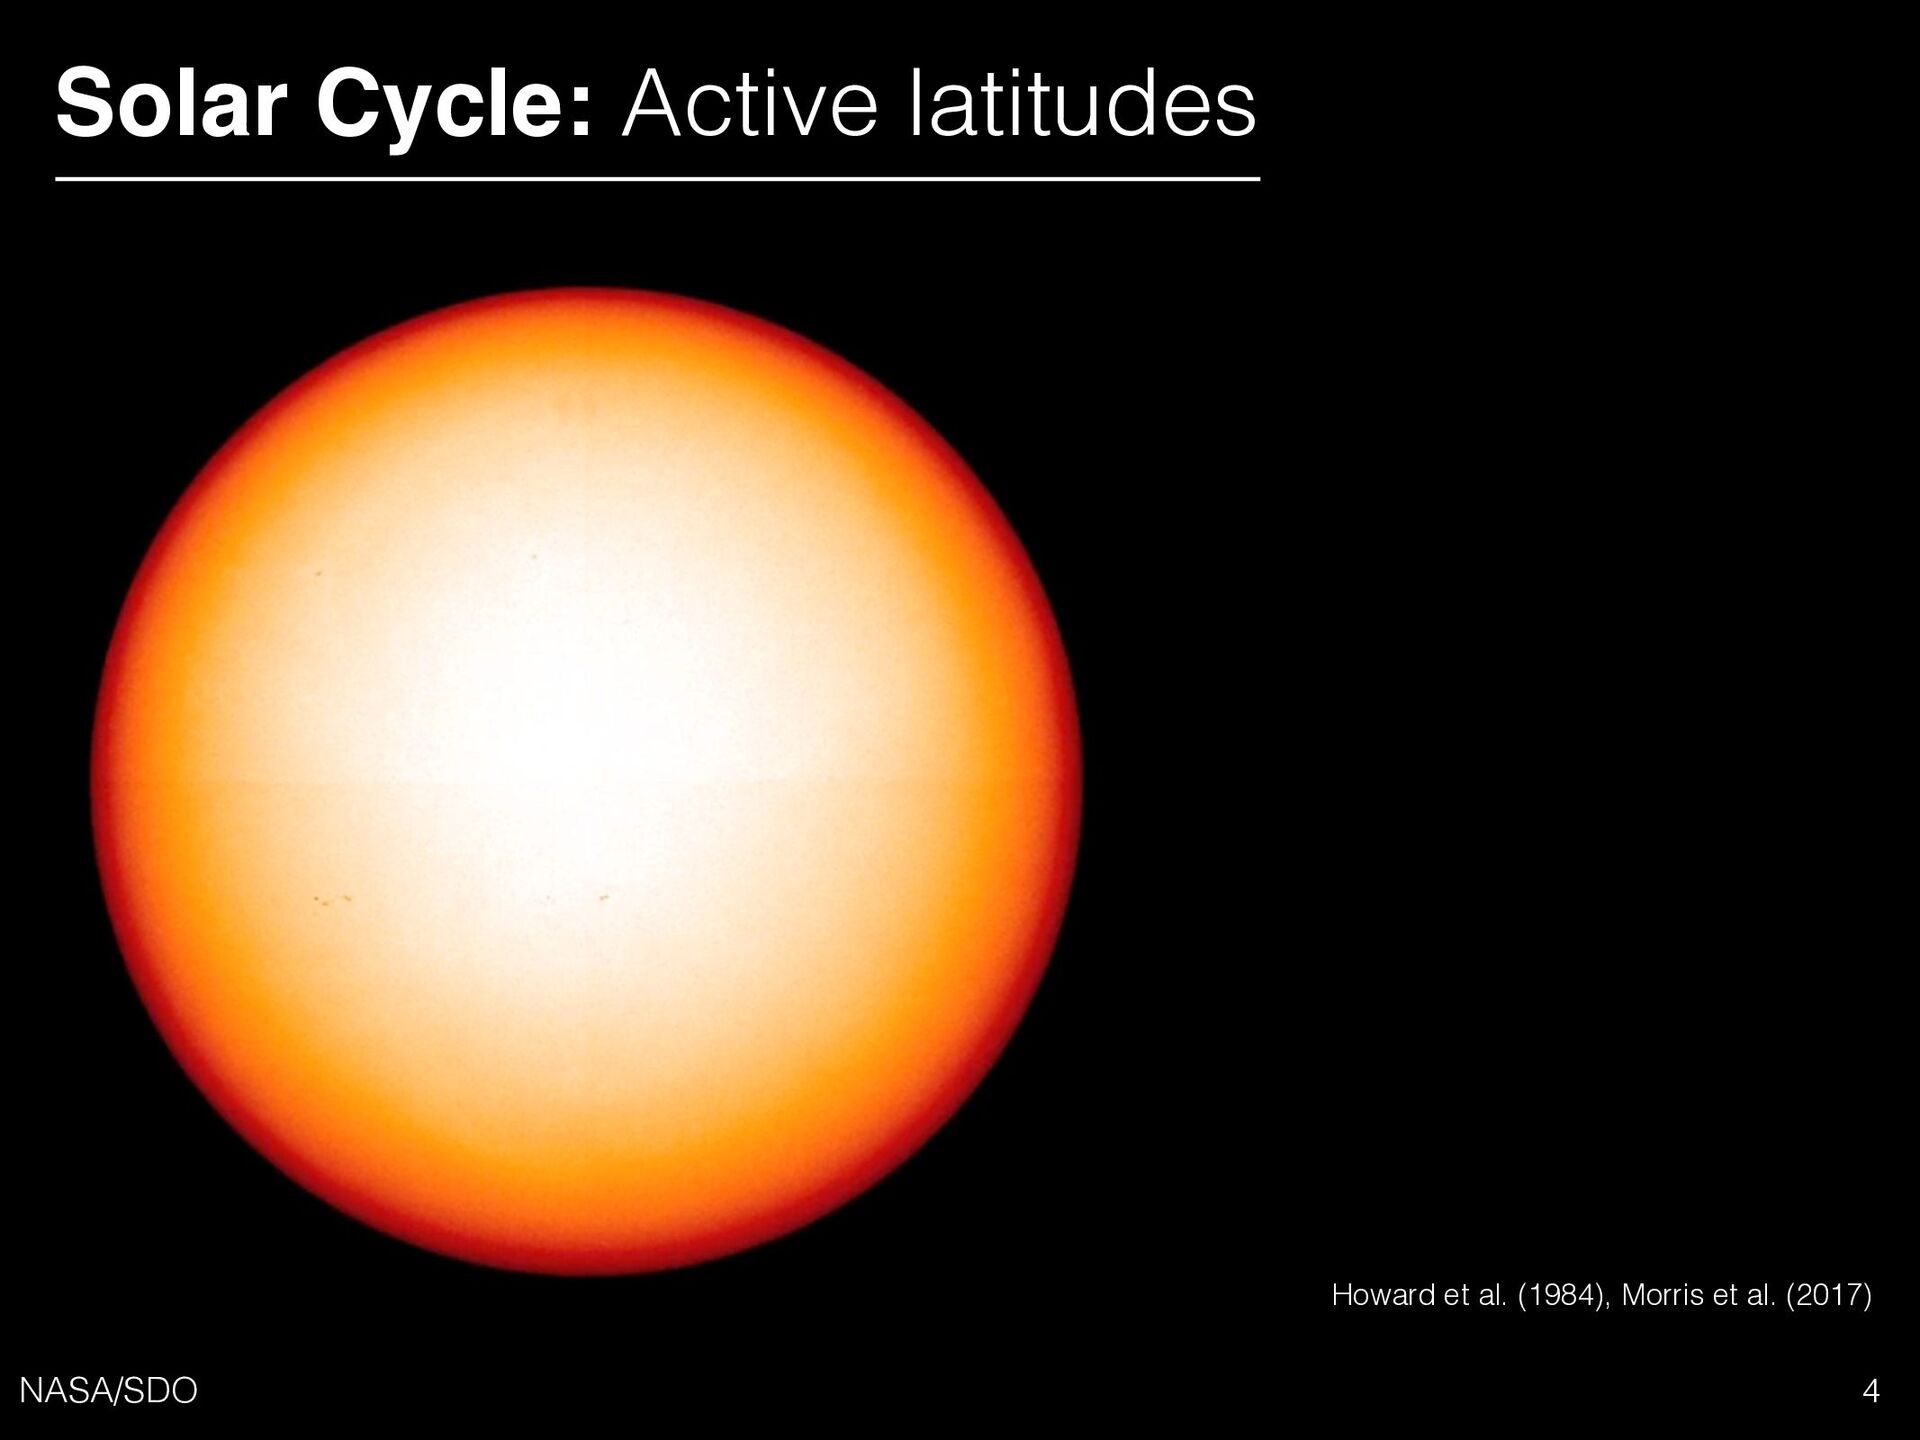
al. (2017) 5 • 11 year period • Spots begin to appear near 30° • Active latitudes drift towards equator • Spots near 15° at spot number maximum Solar Cycle: Butterfly diagram
al. (2017) 5 • 11 year period • Spots begin to appear near 30° • Active latitudes drift towards equator • Spots near 15° at spot number maximum • No spots during activity minimum Solar Cycle: Butterfly diagram
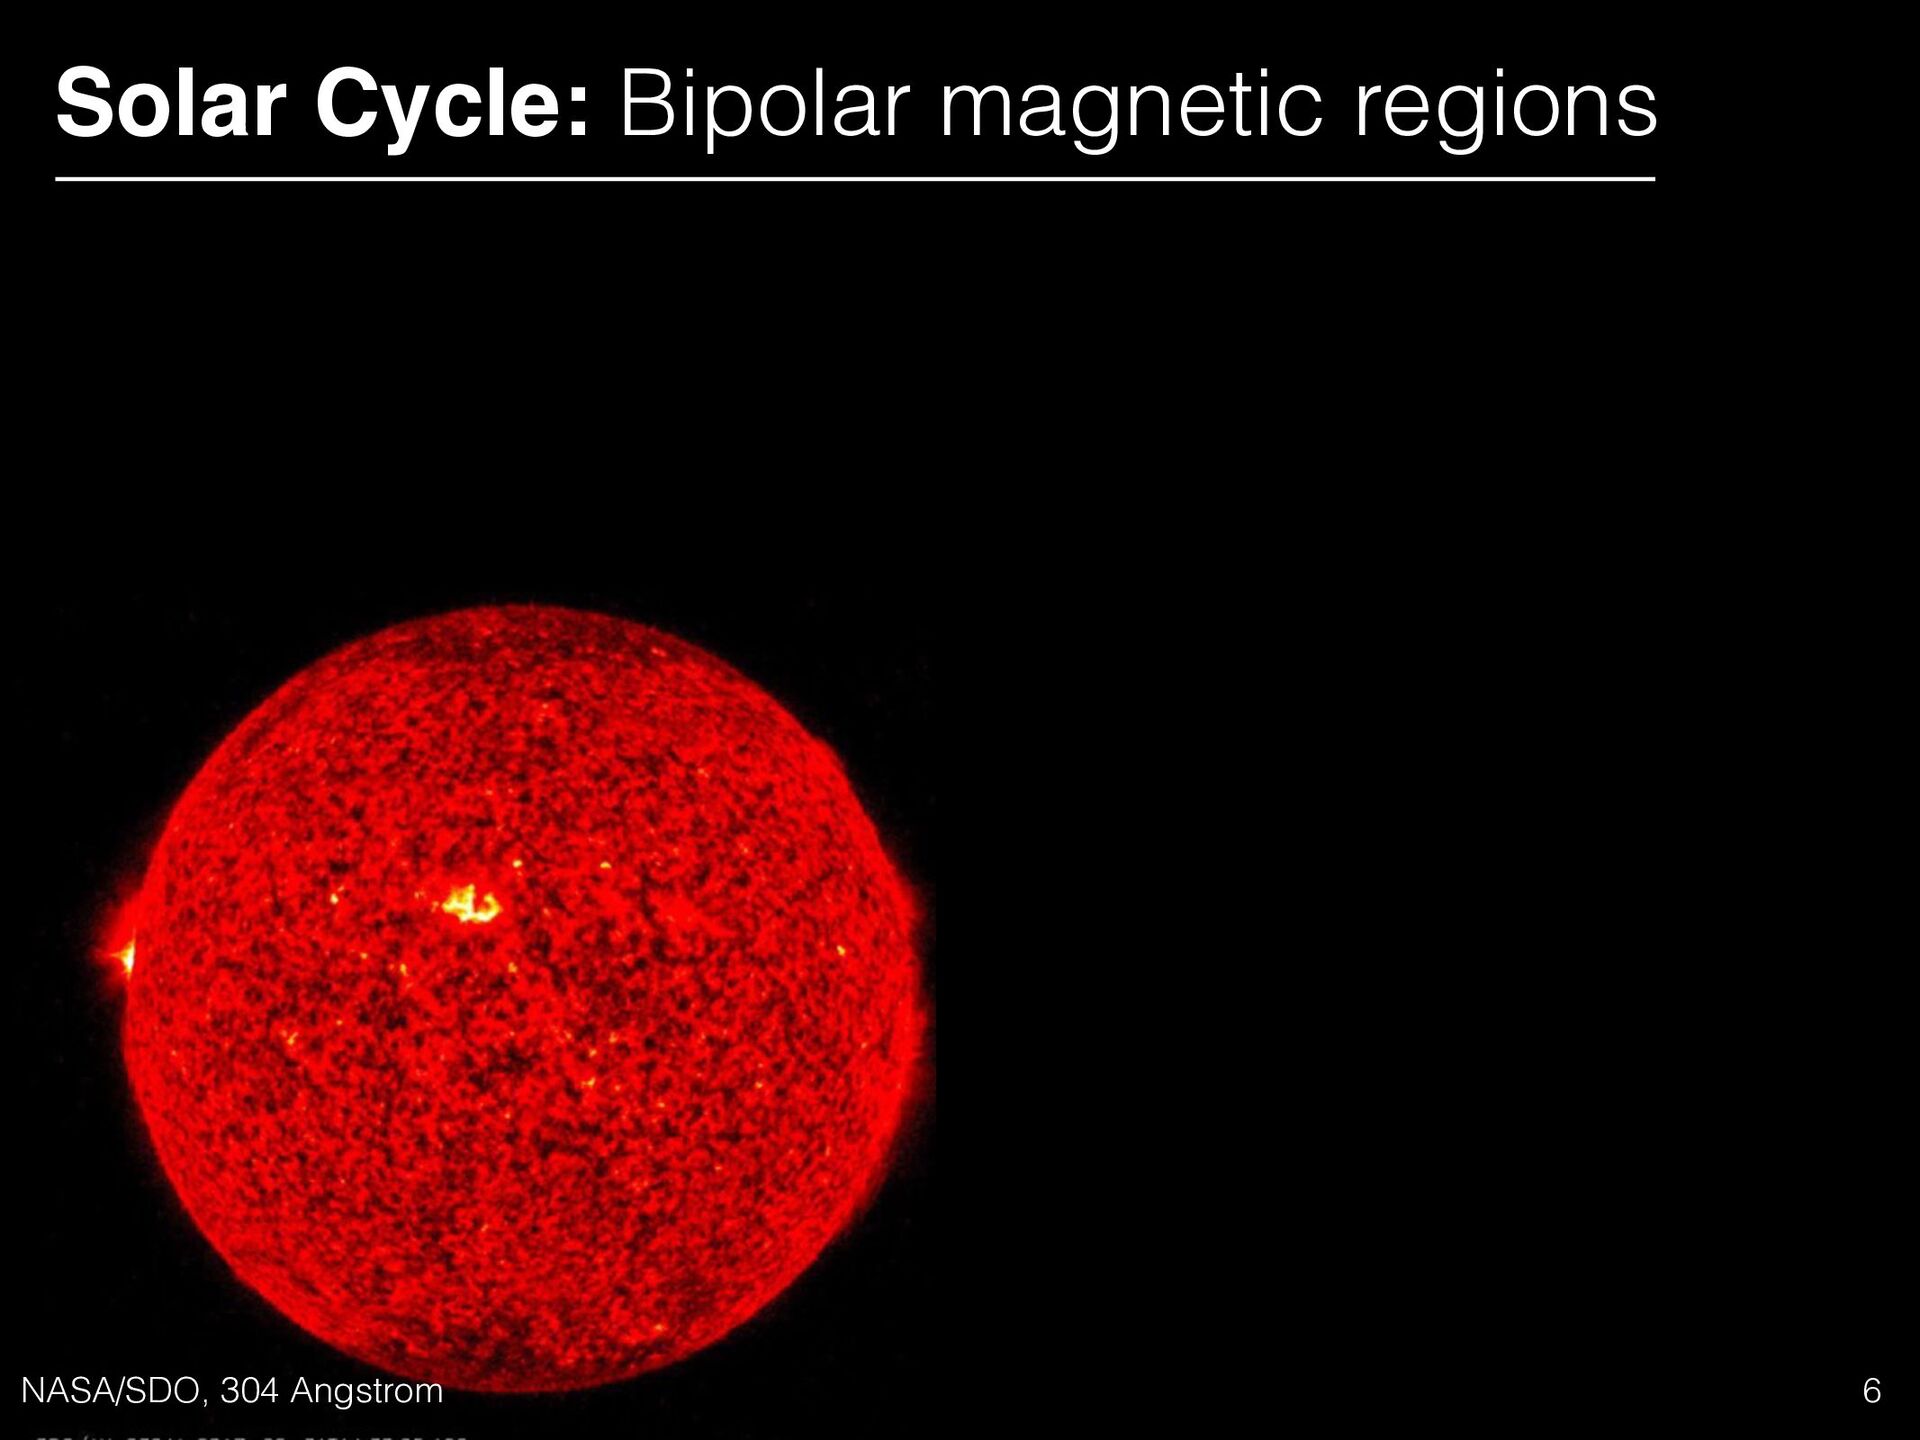
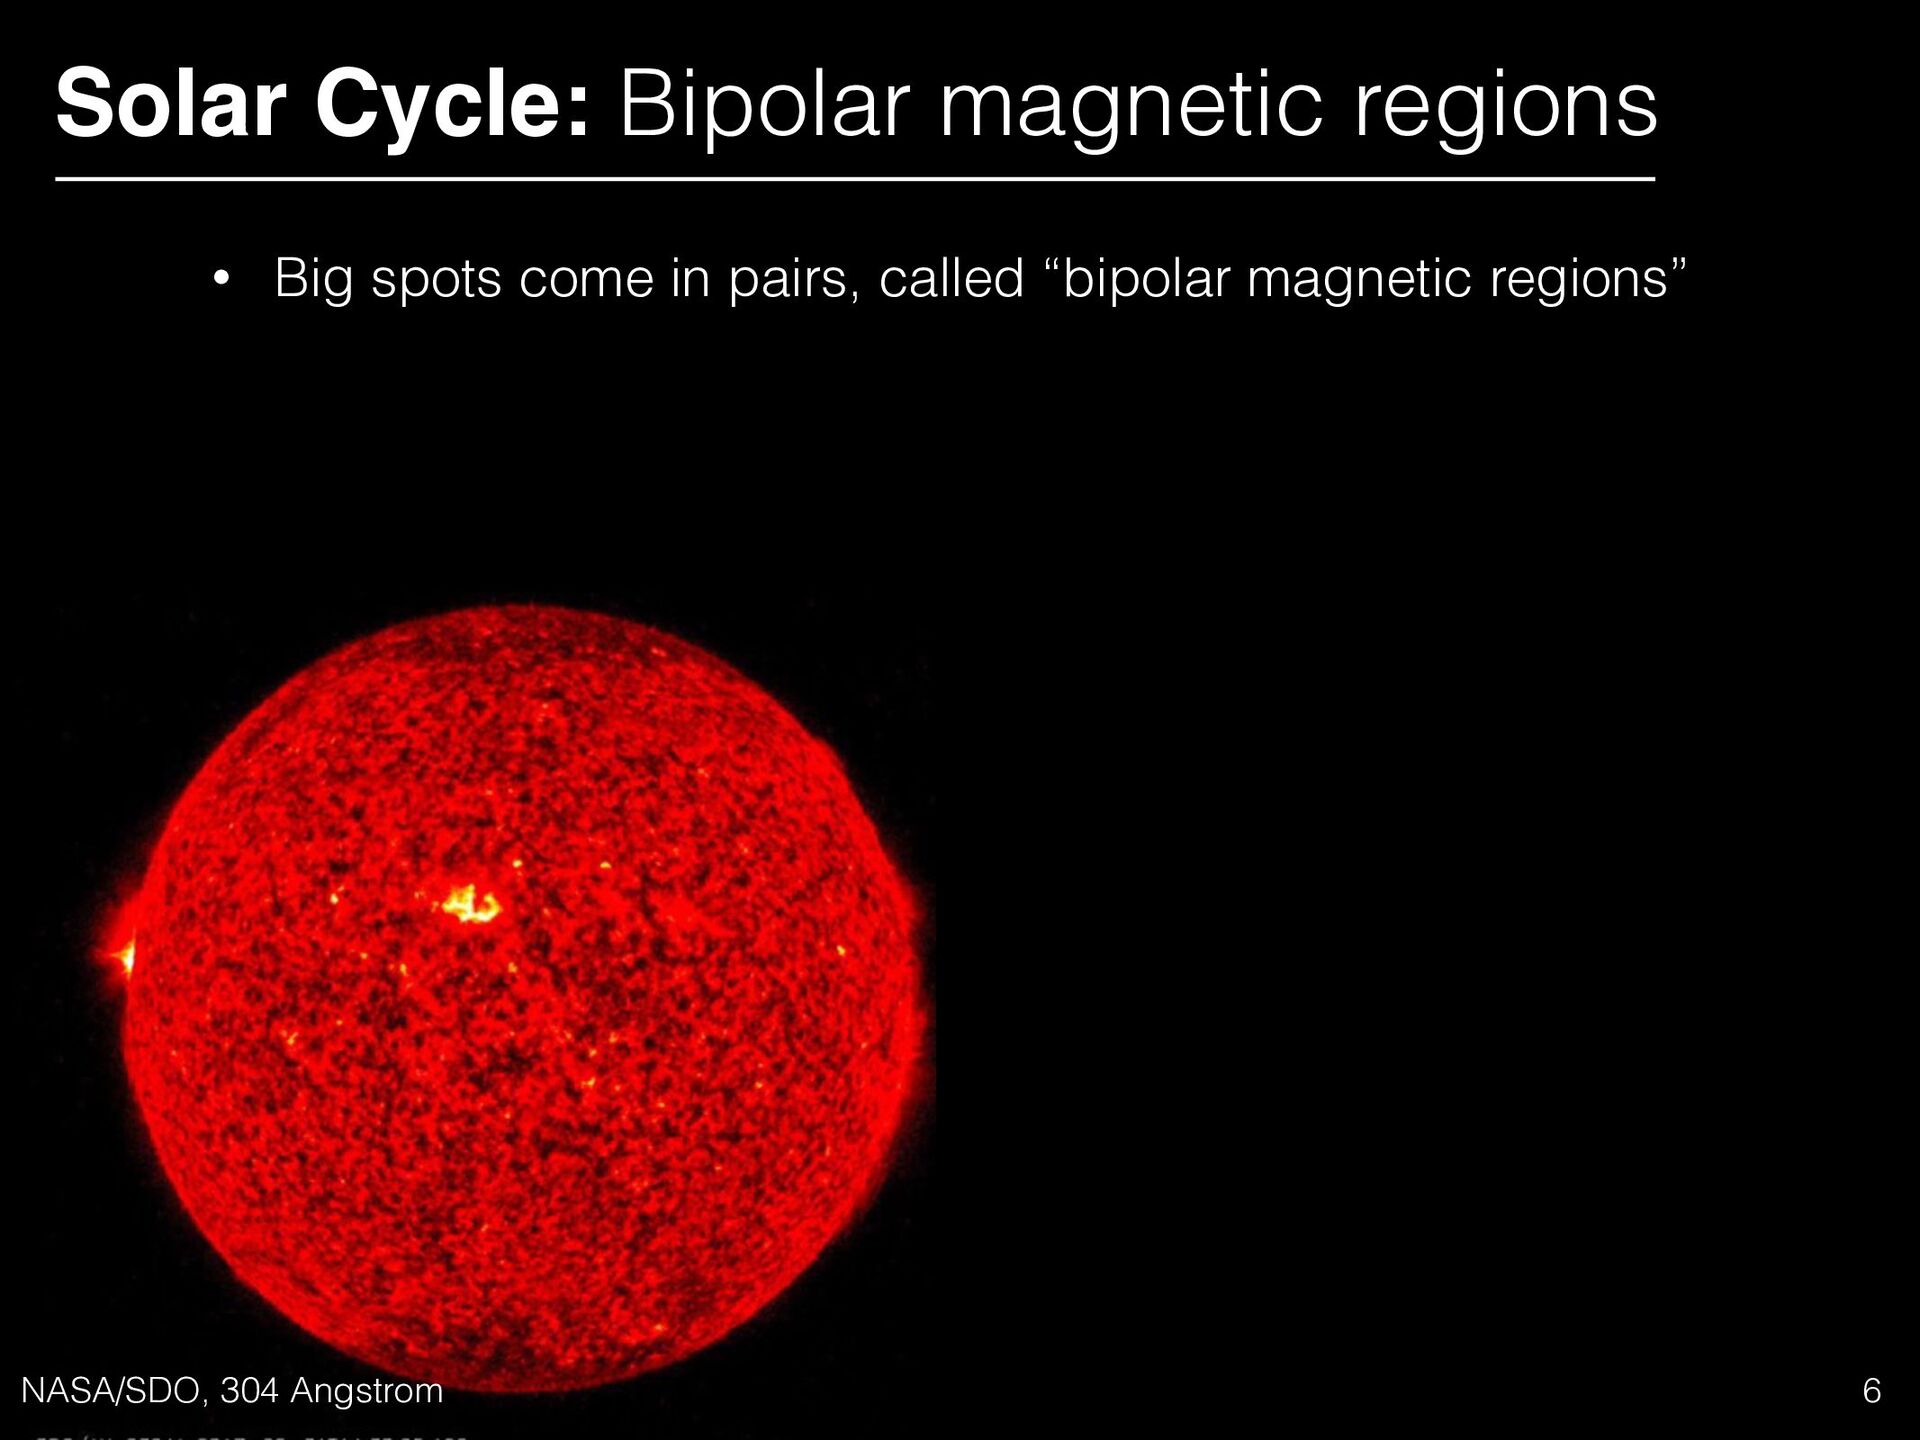
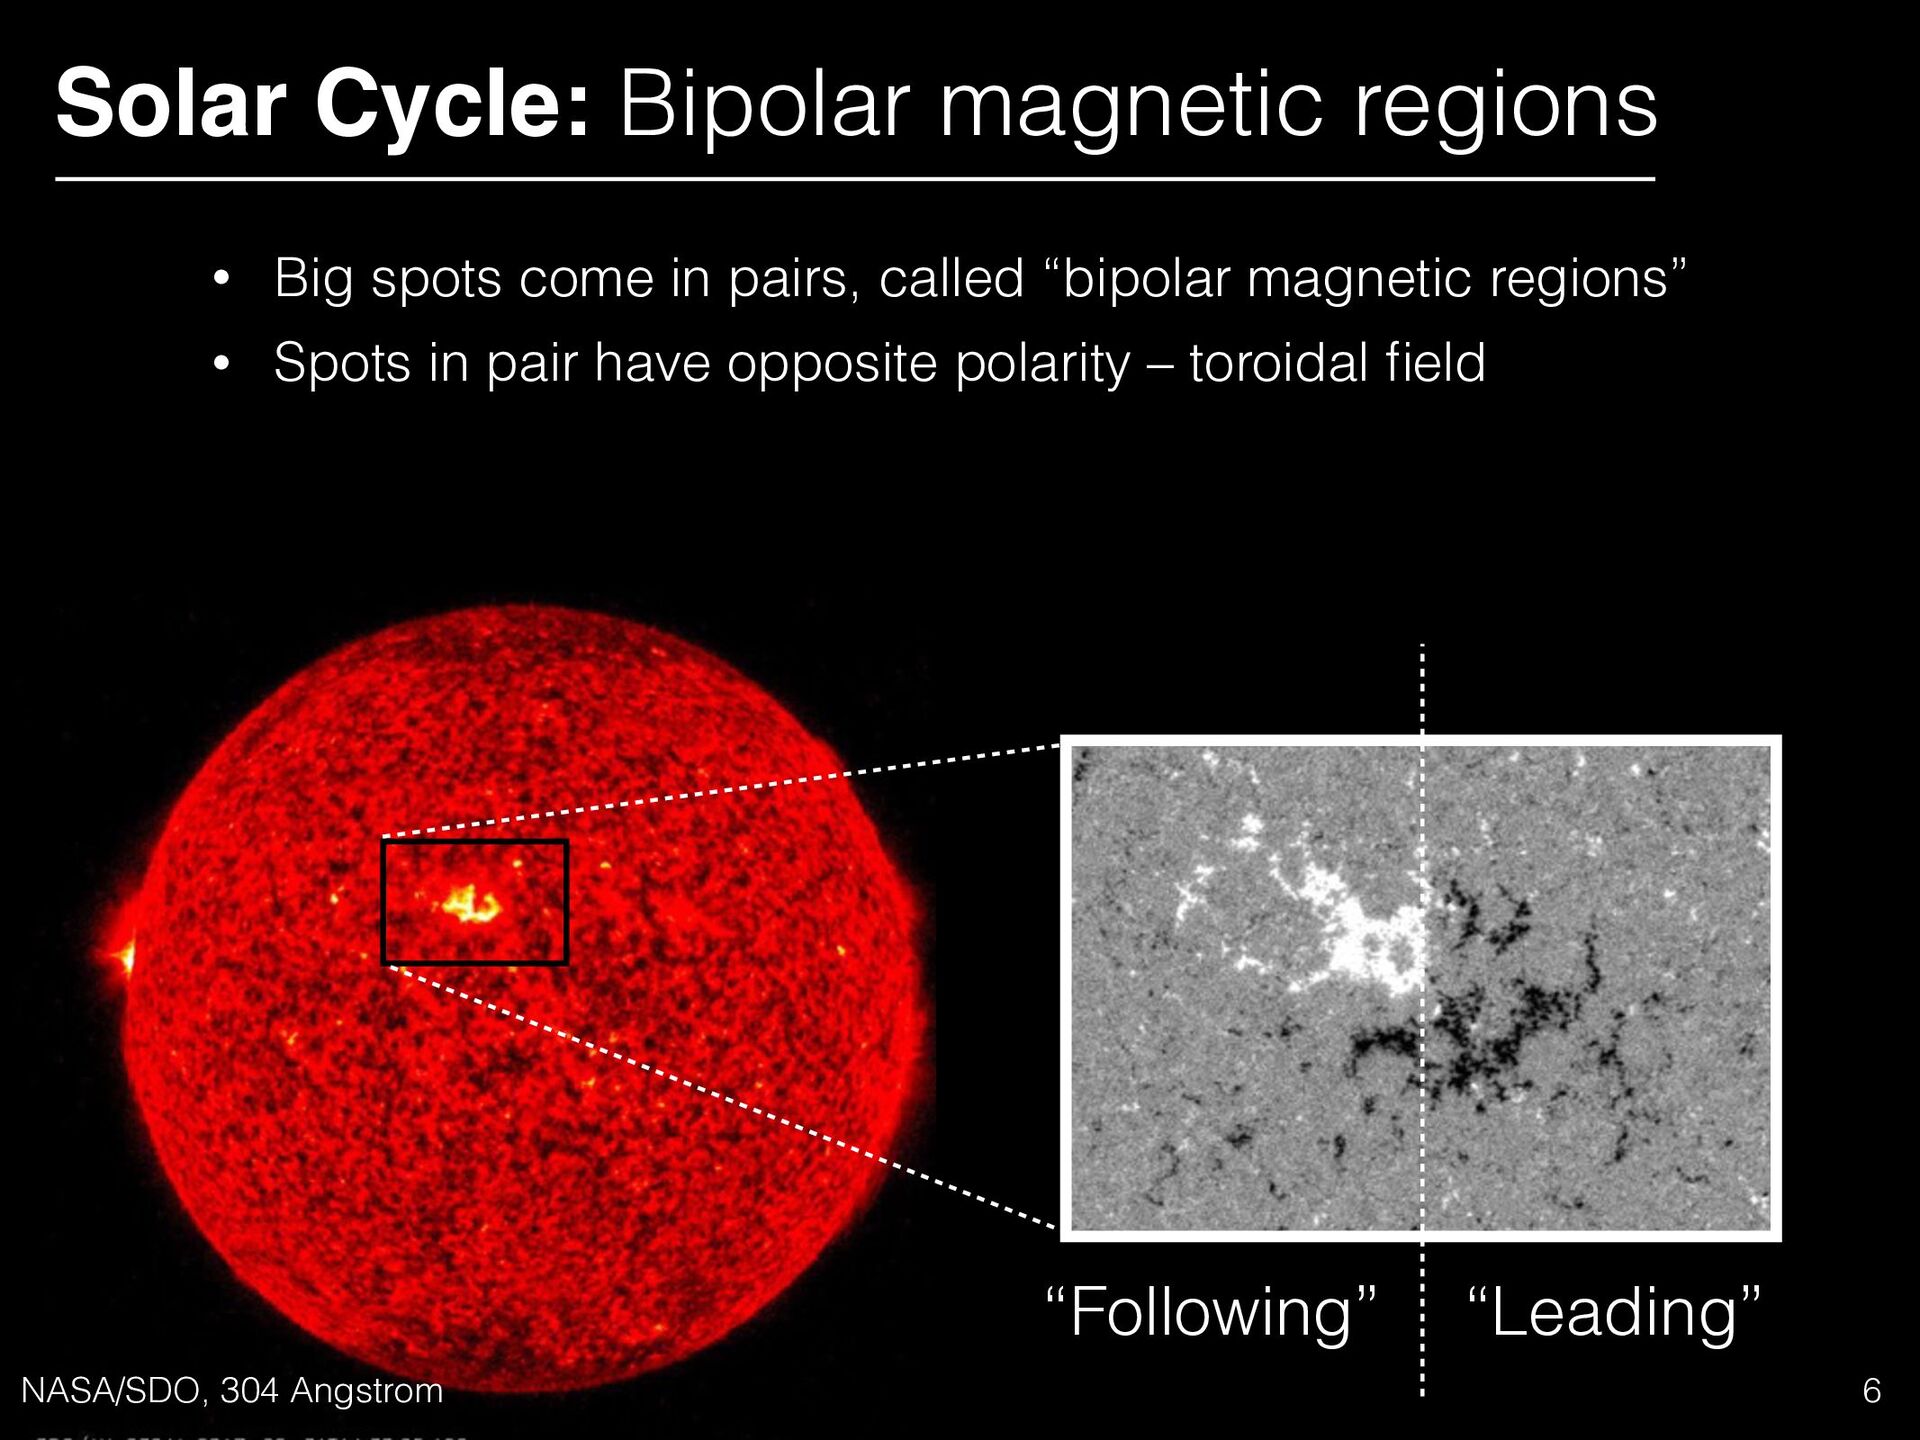
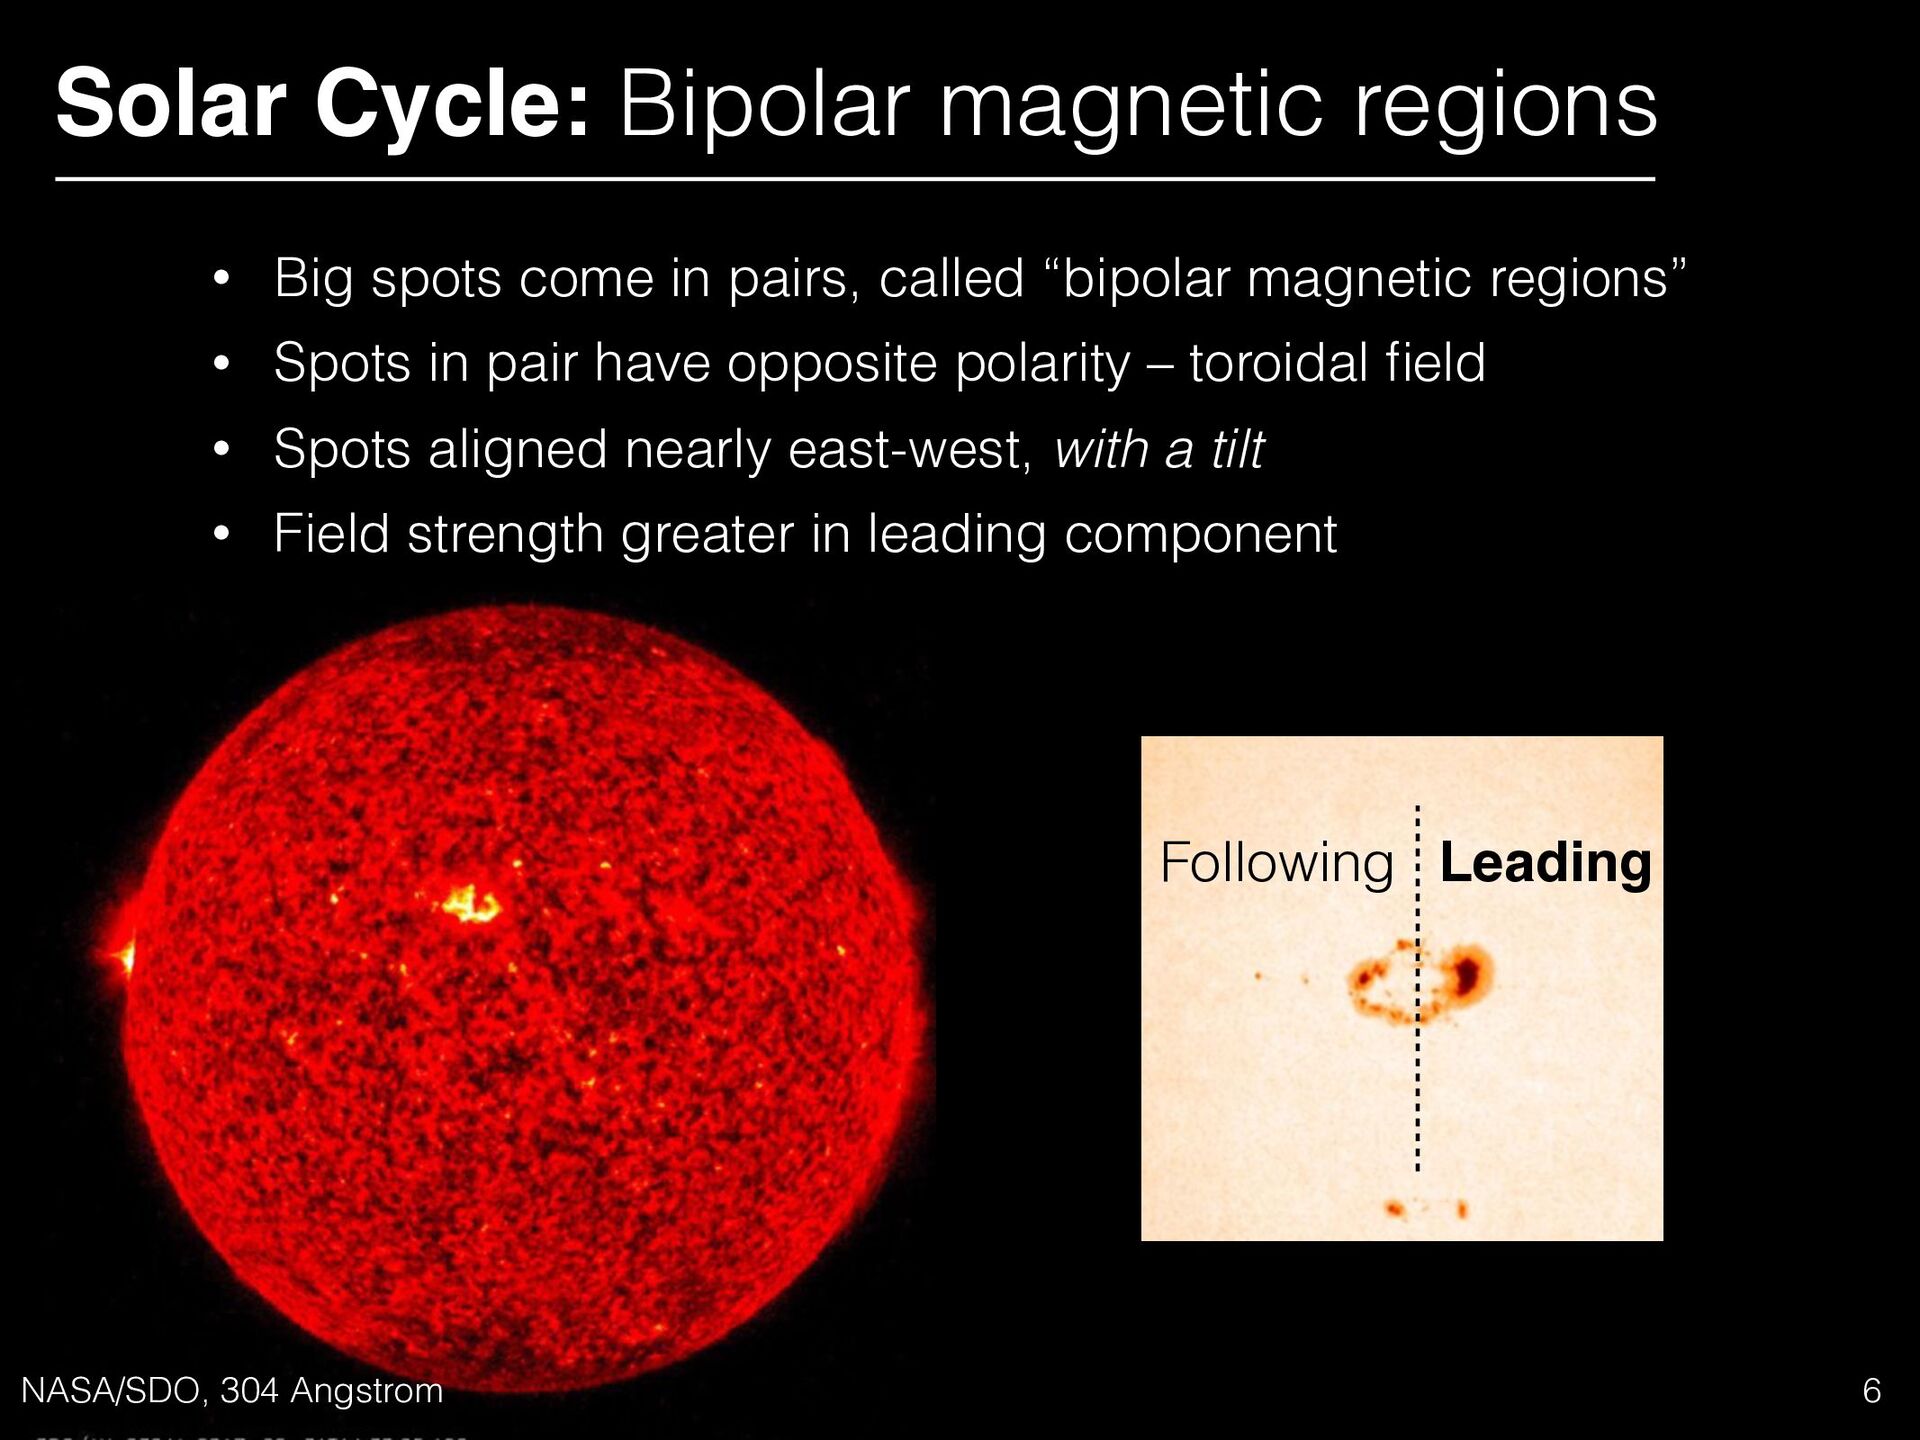
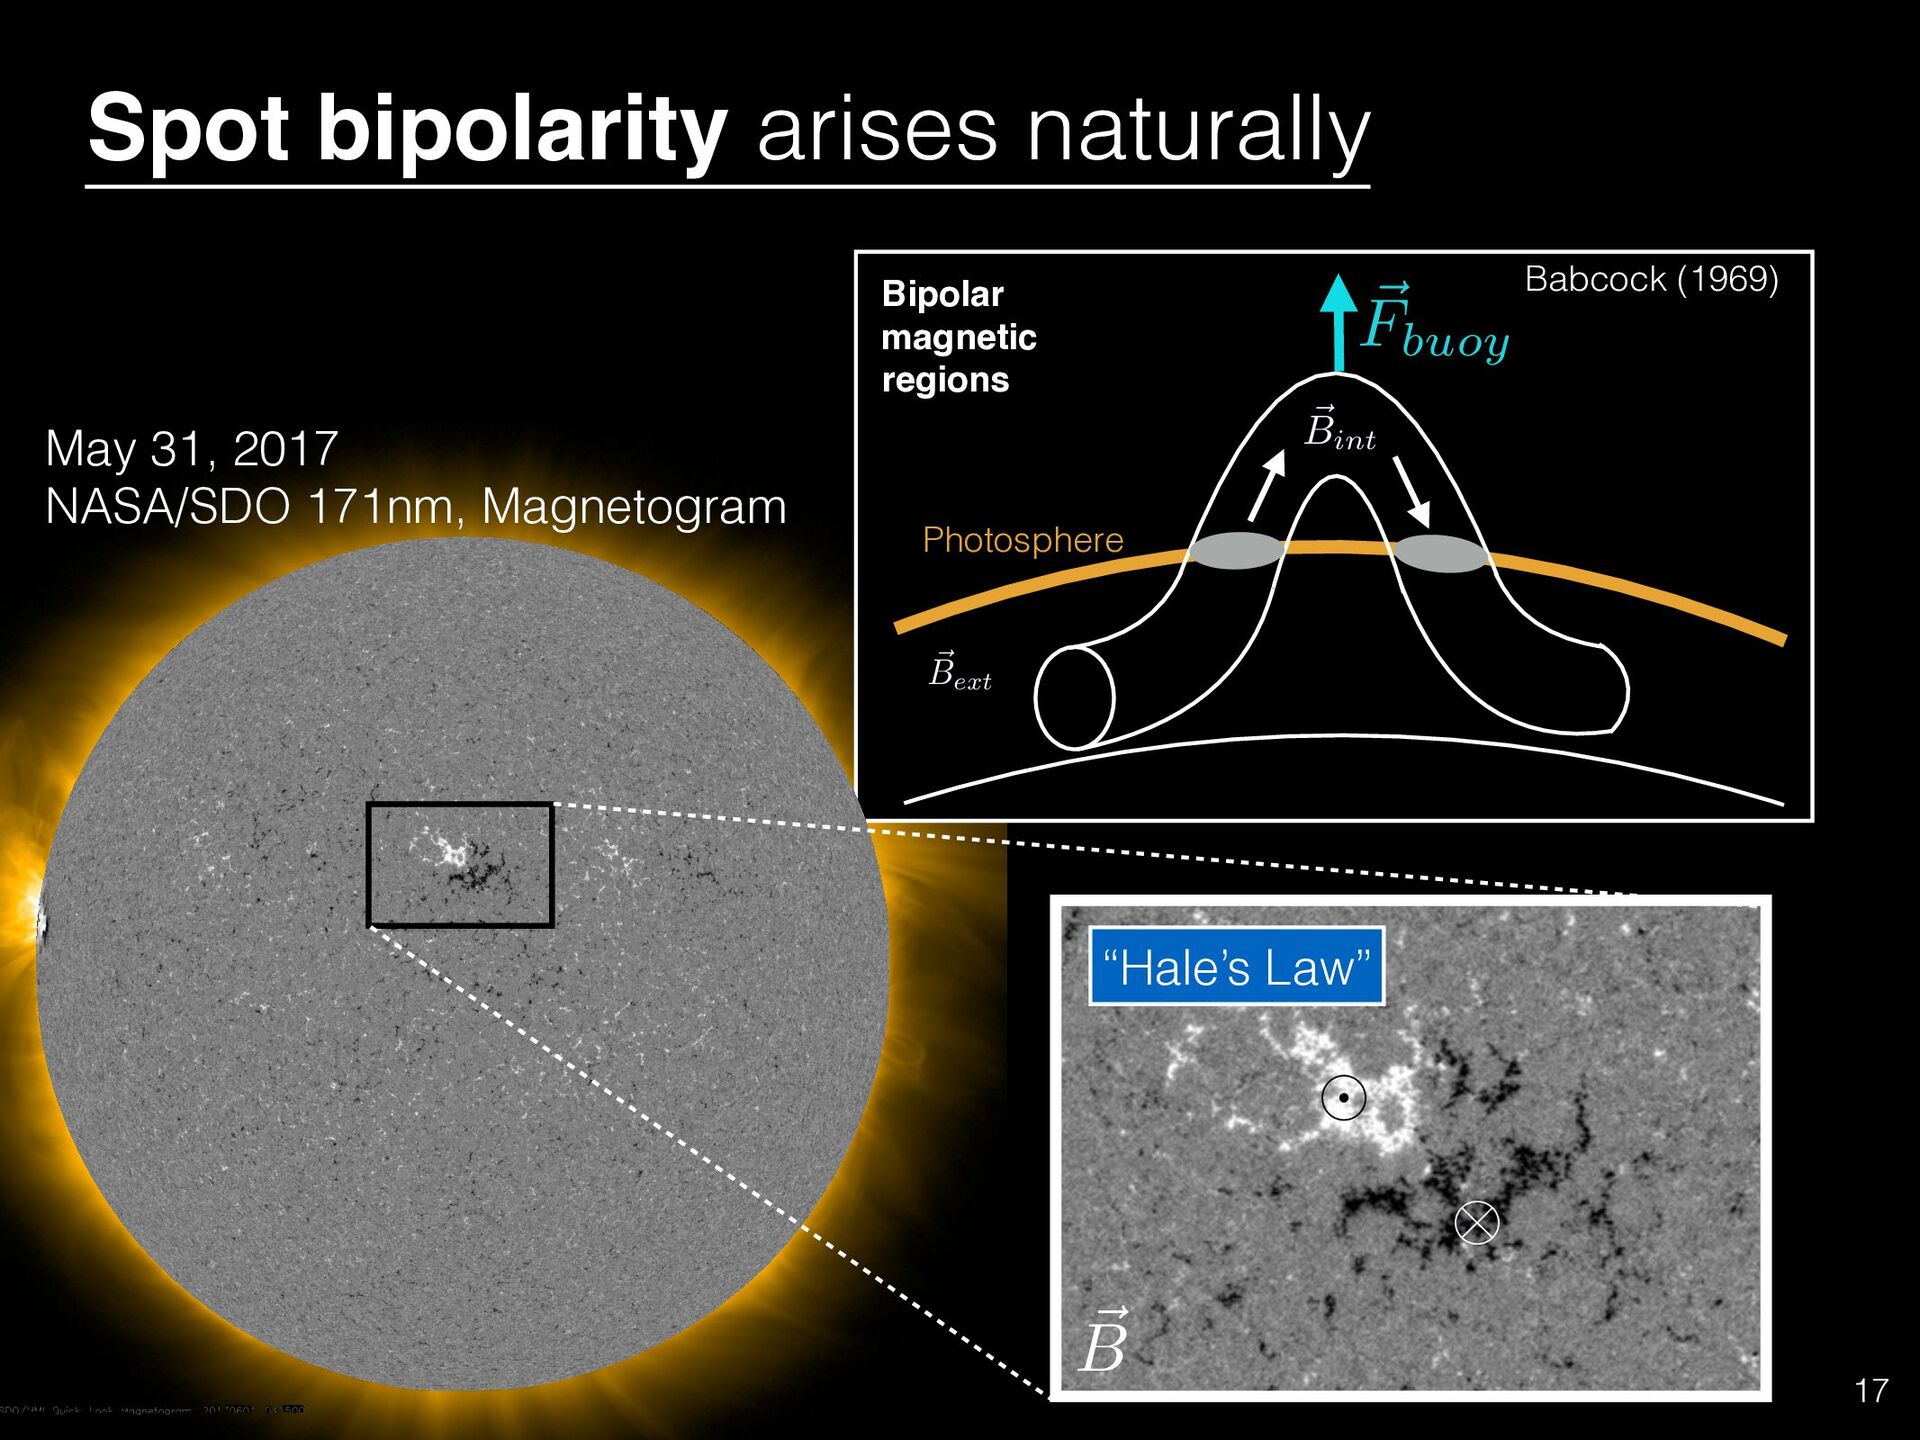
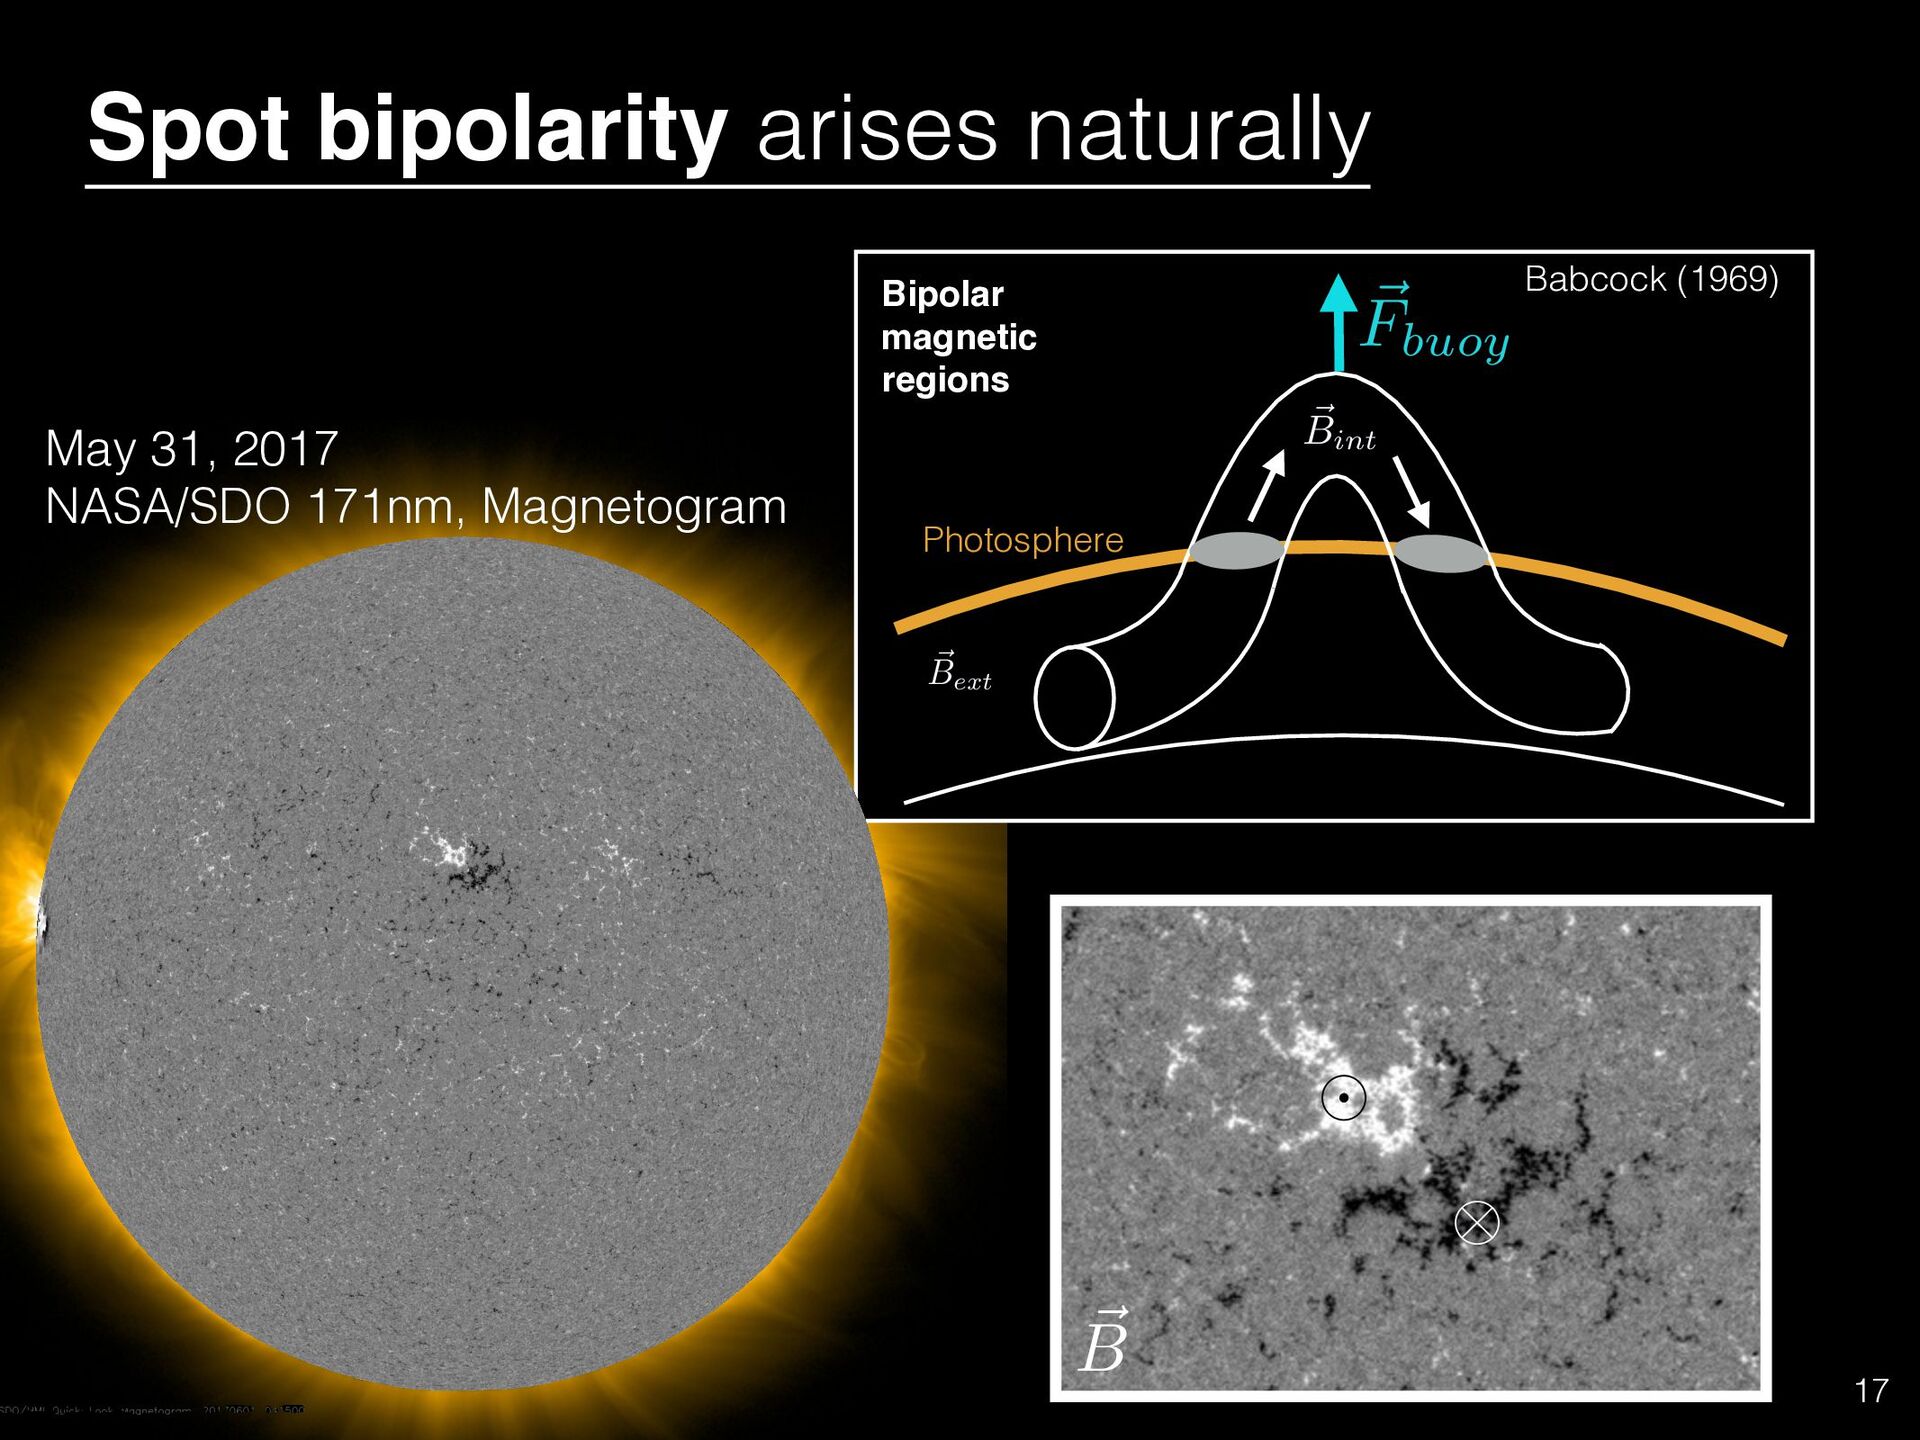
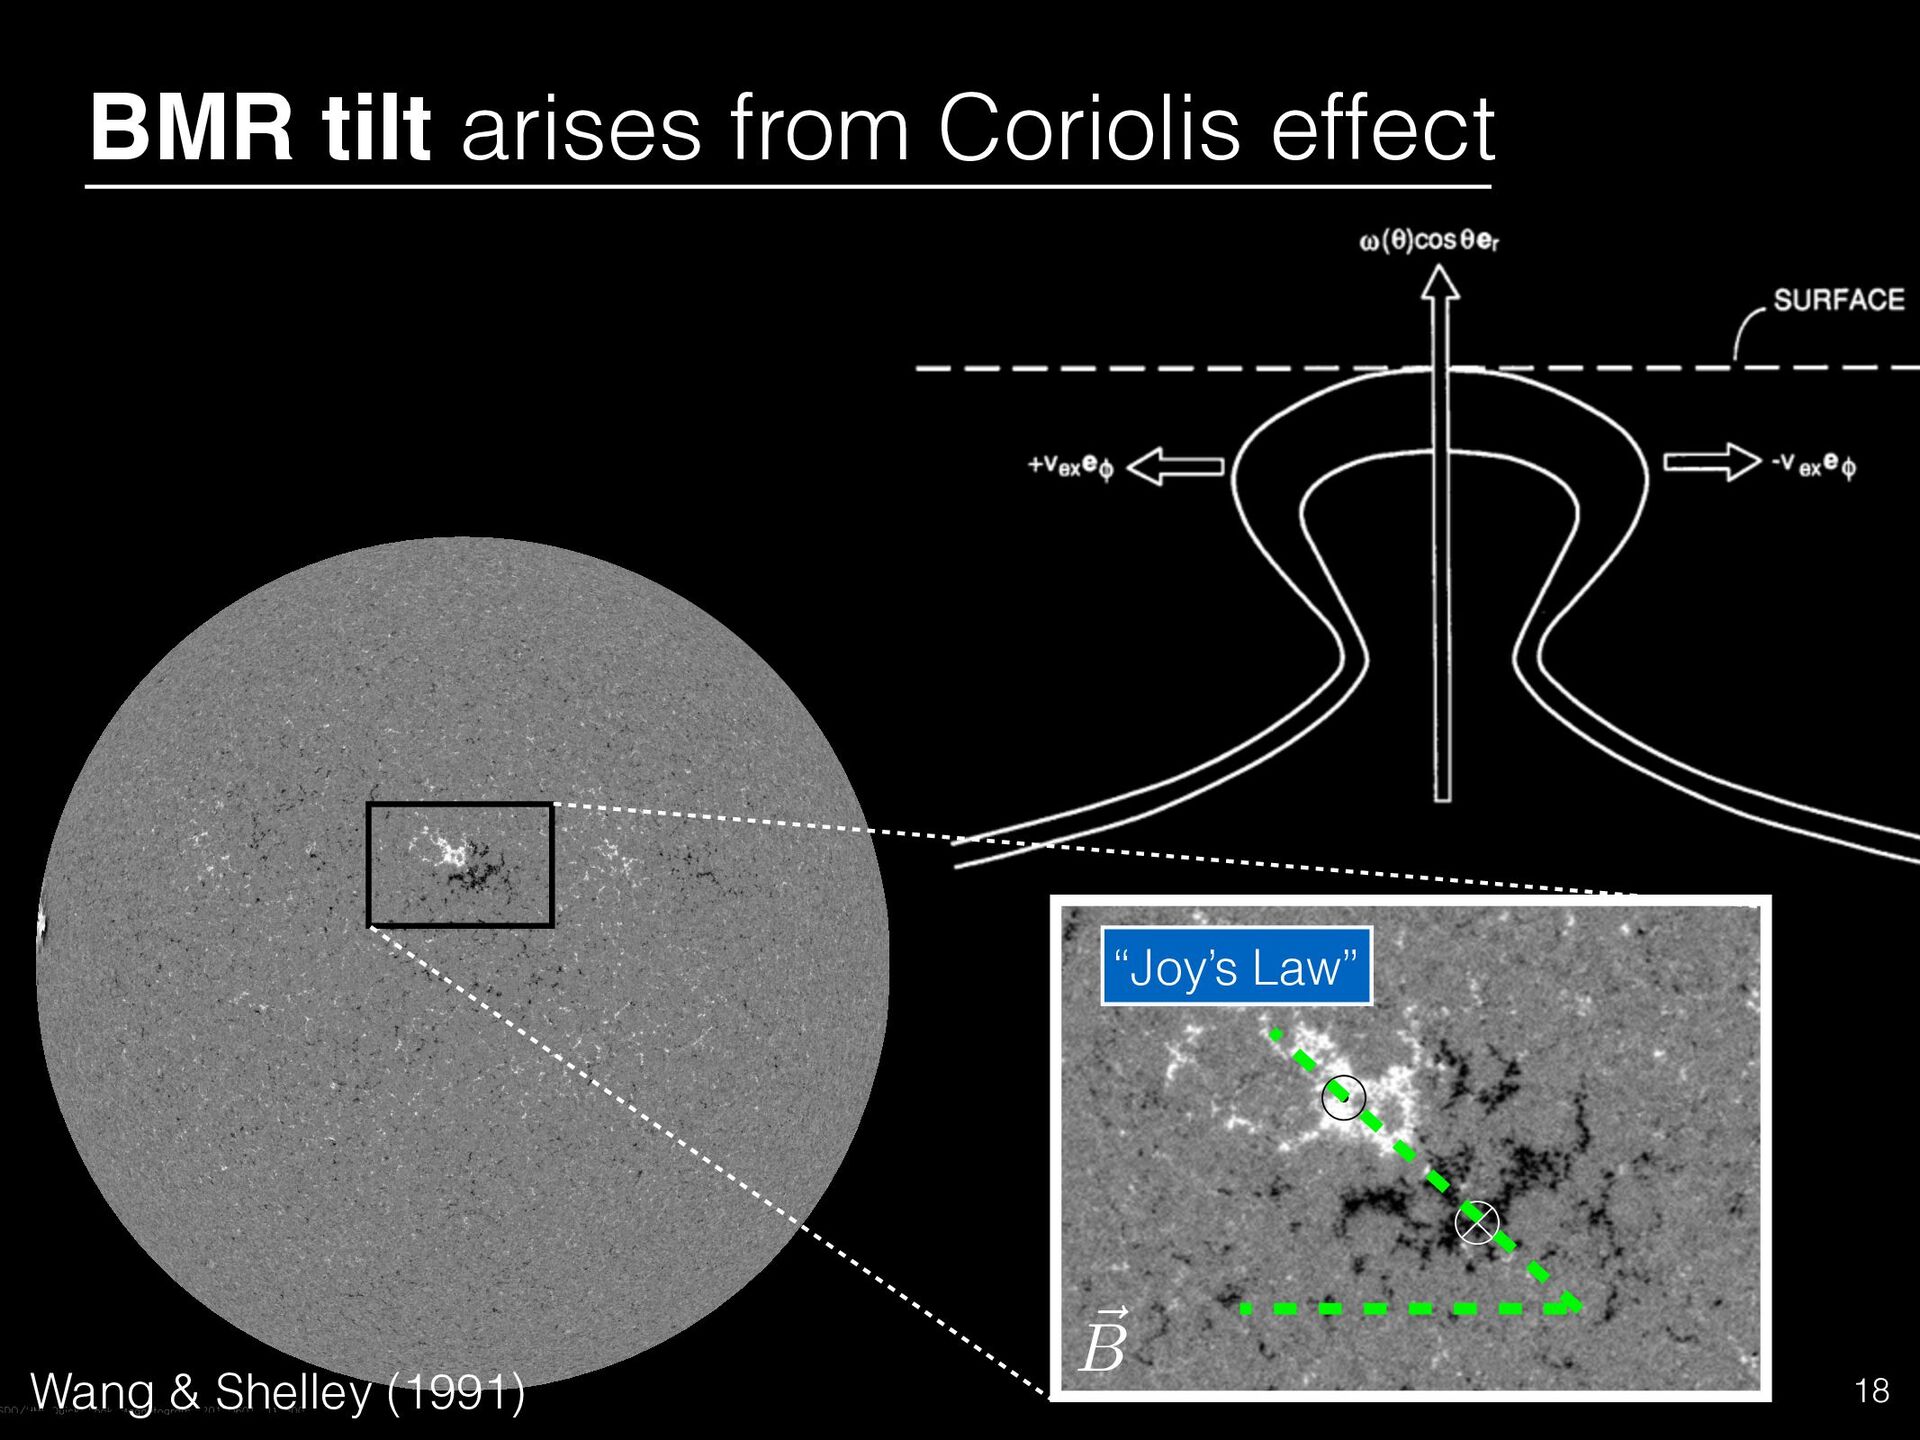
in pairs, called “bipolar magnetic regions” • Spots in pair have opposite polarity – toroidal field • Spots aligned nearly east-west, with a tilt NASA/SDO, 304 Angstrom “Leading” “Following”
in pairs, called “bipolar magnetic regions” • Spots in pair have opposite polarity – toroidal field • Spots aligned nearly east-west, with a tilt • Field strength greater in leading component NASA/SDO, 304 Angstrom Leading Following
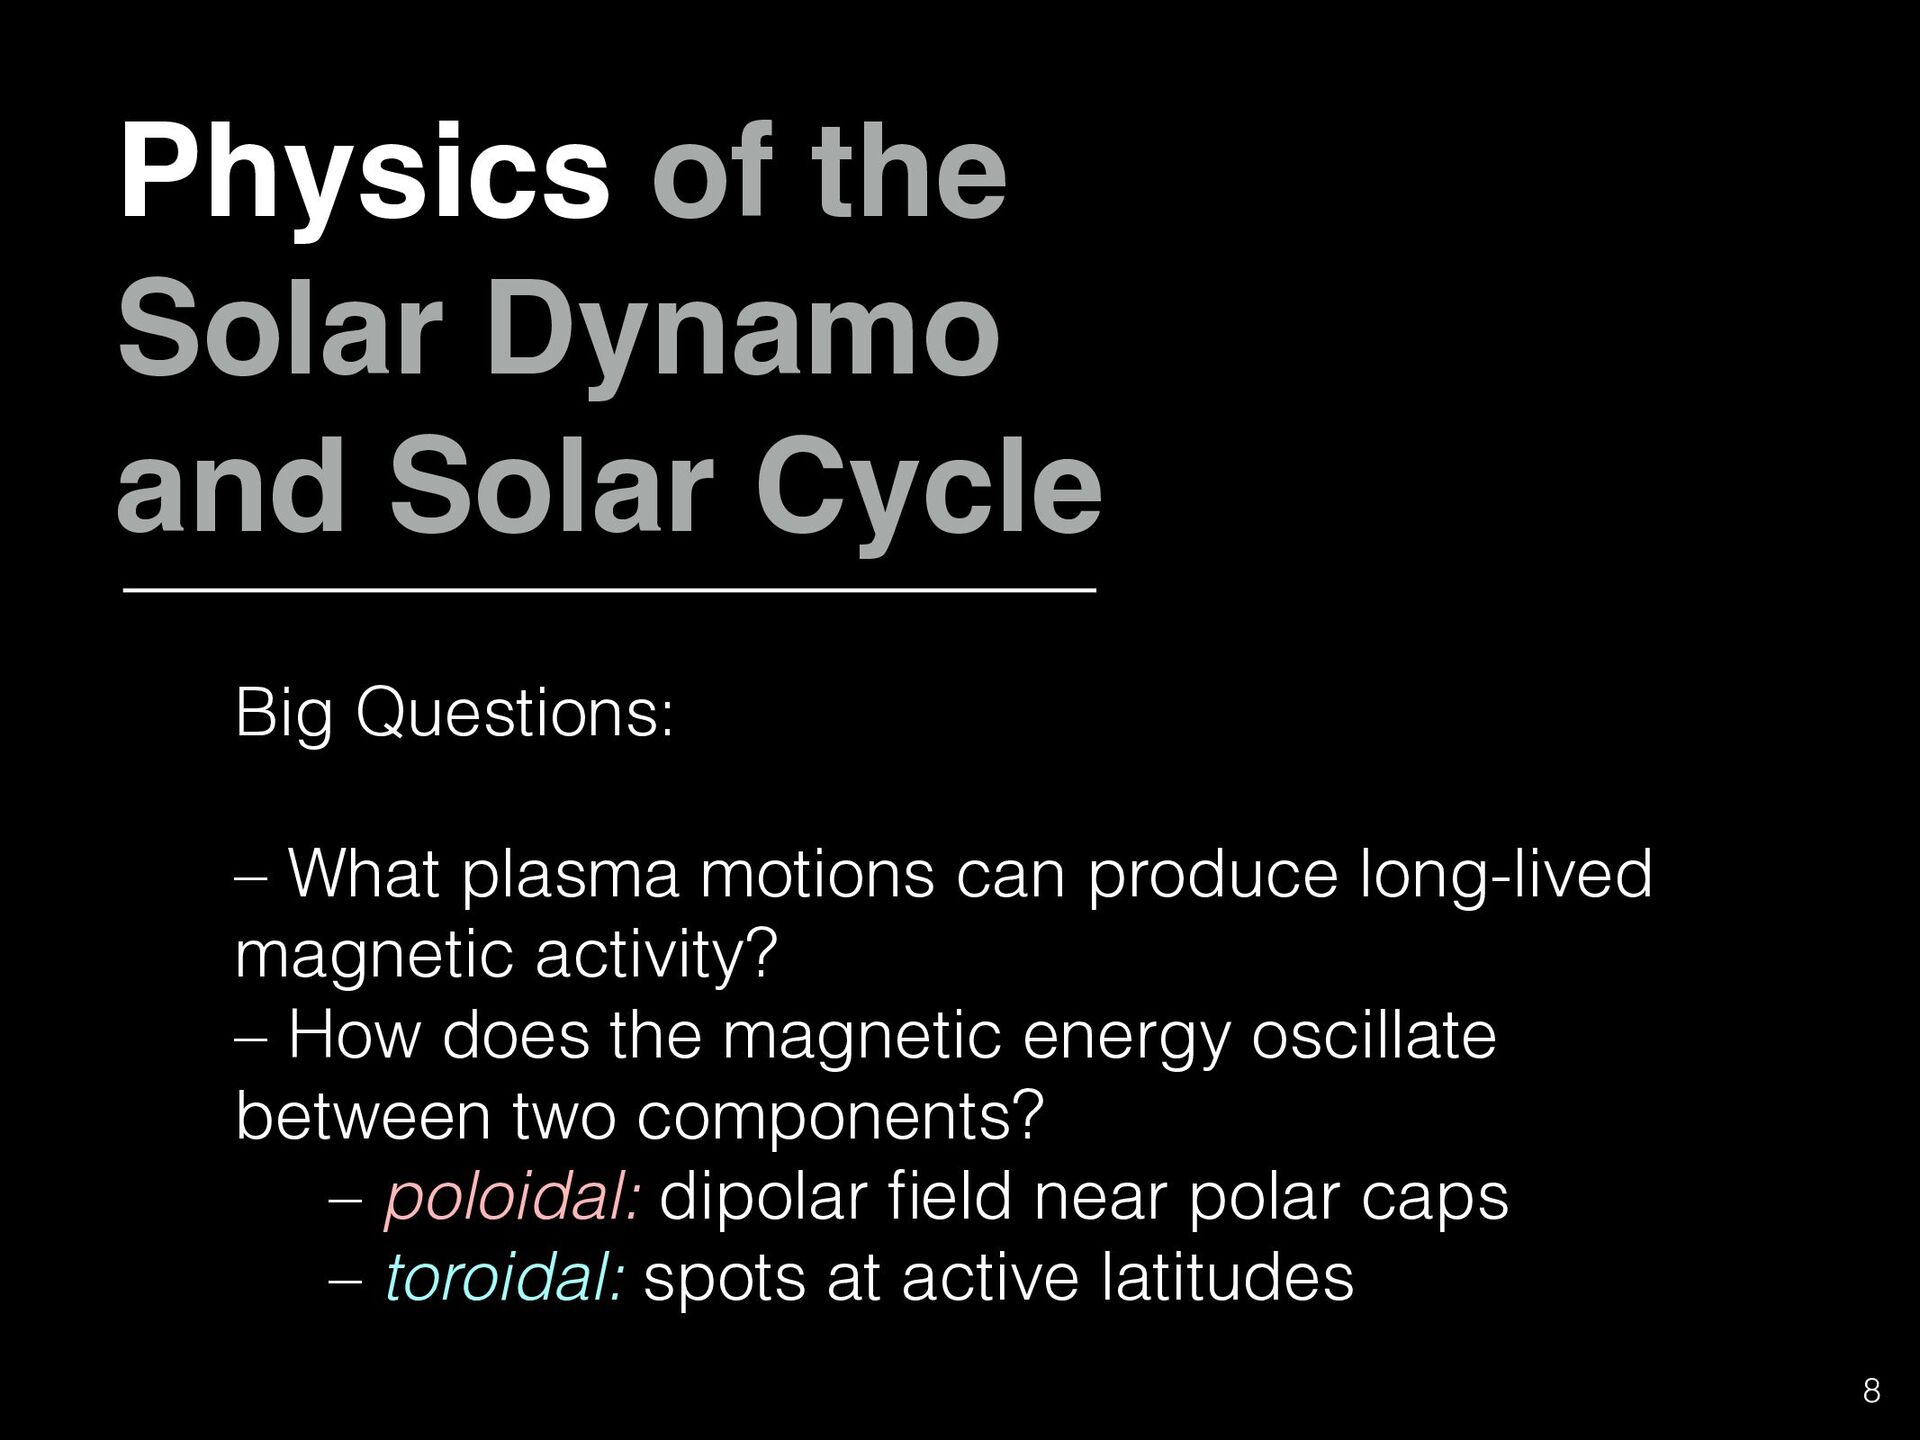
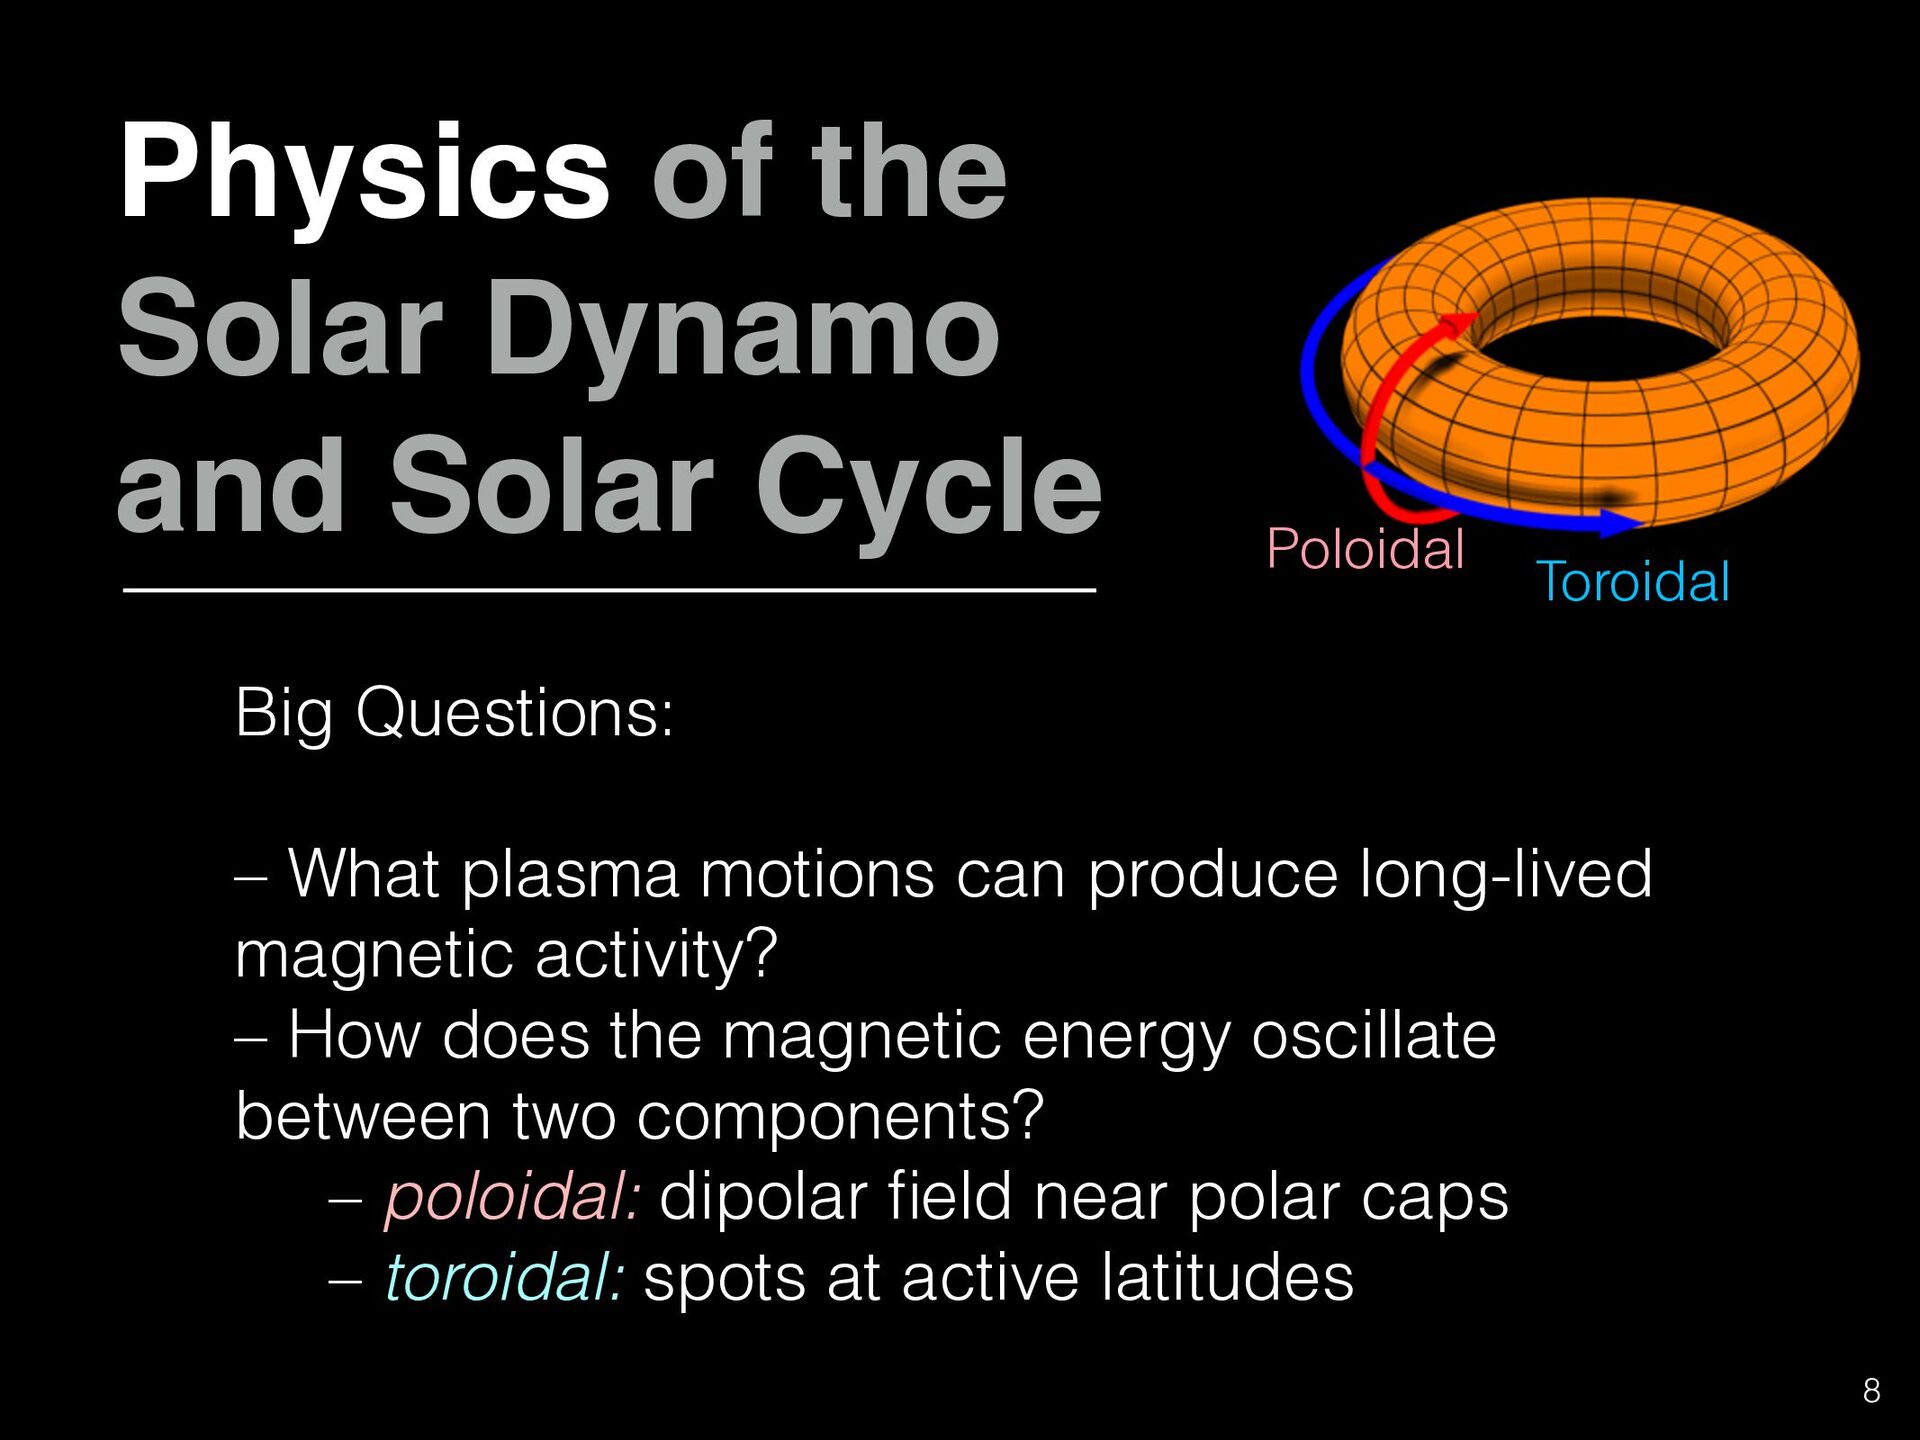
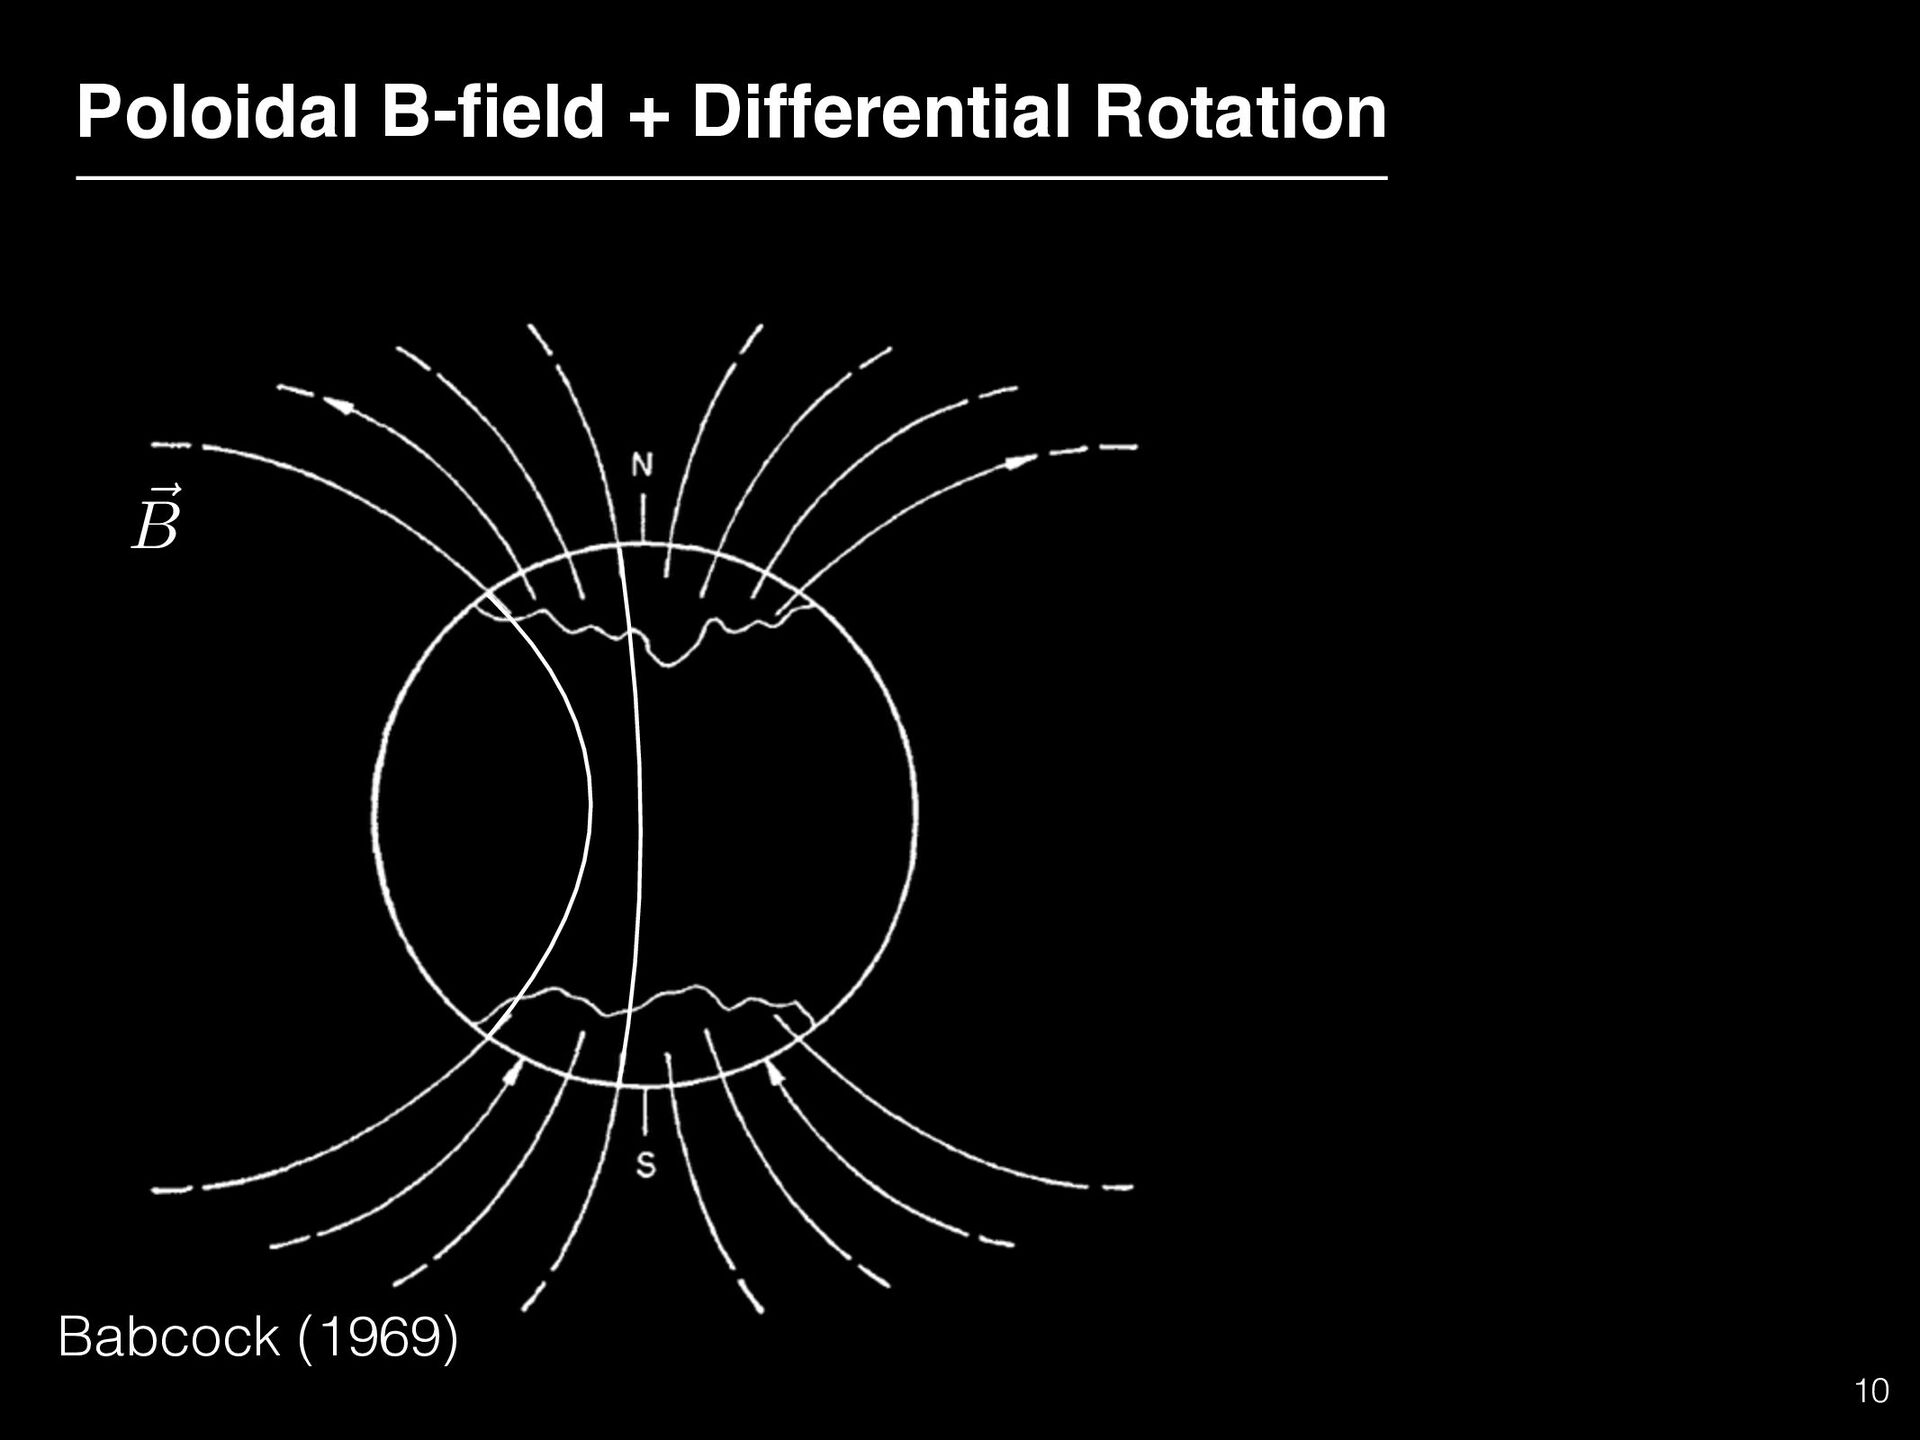
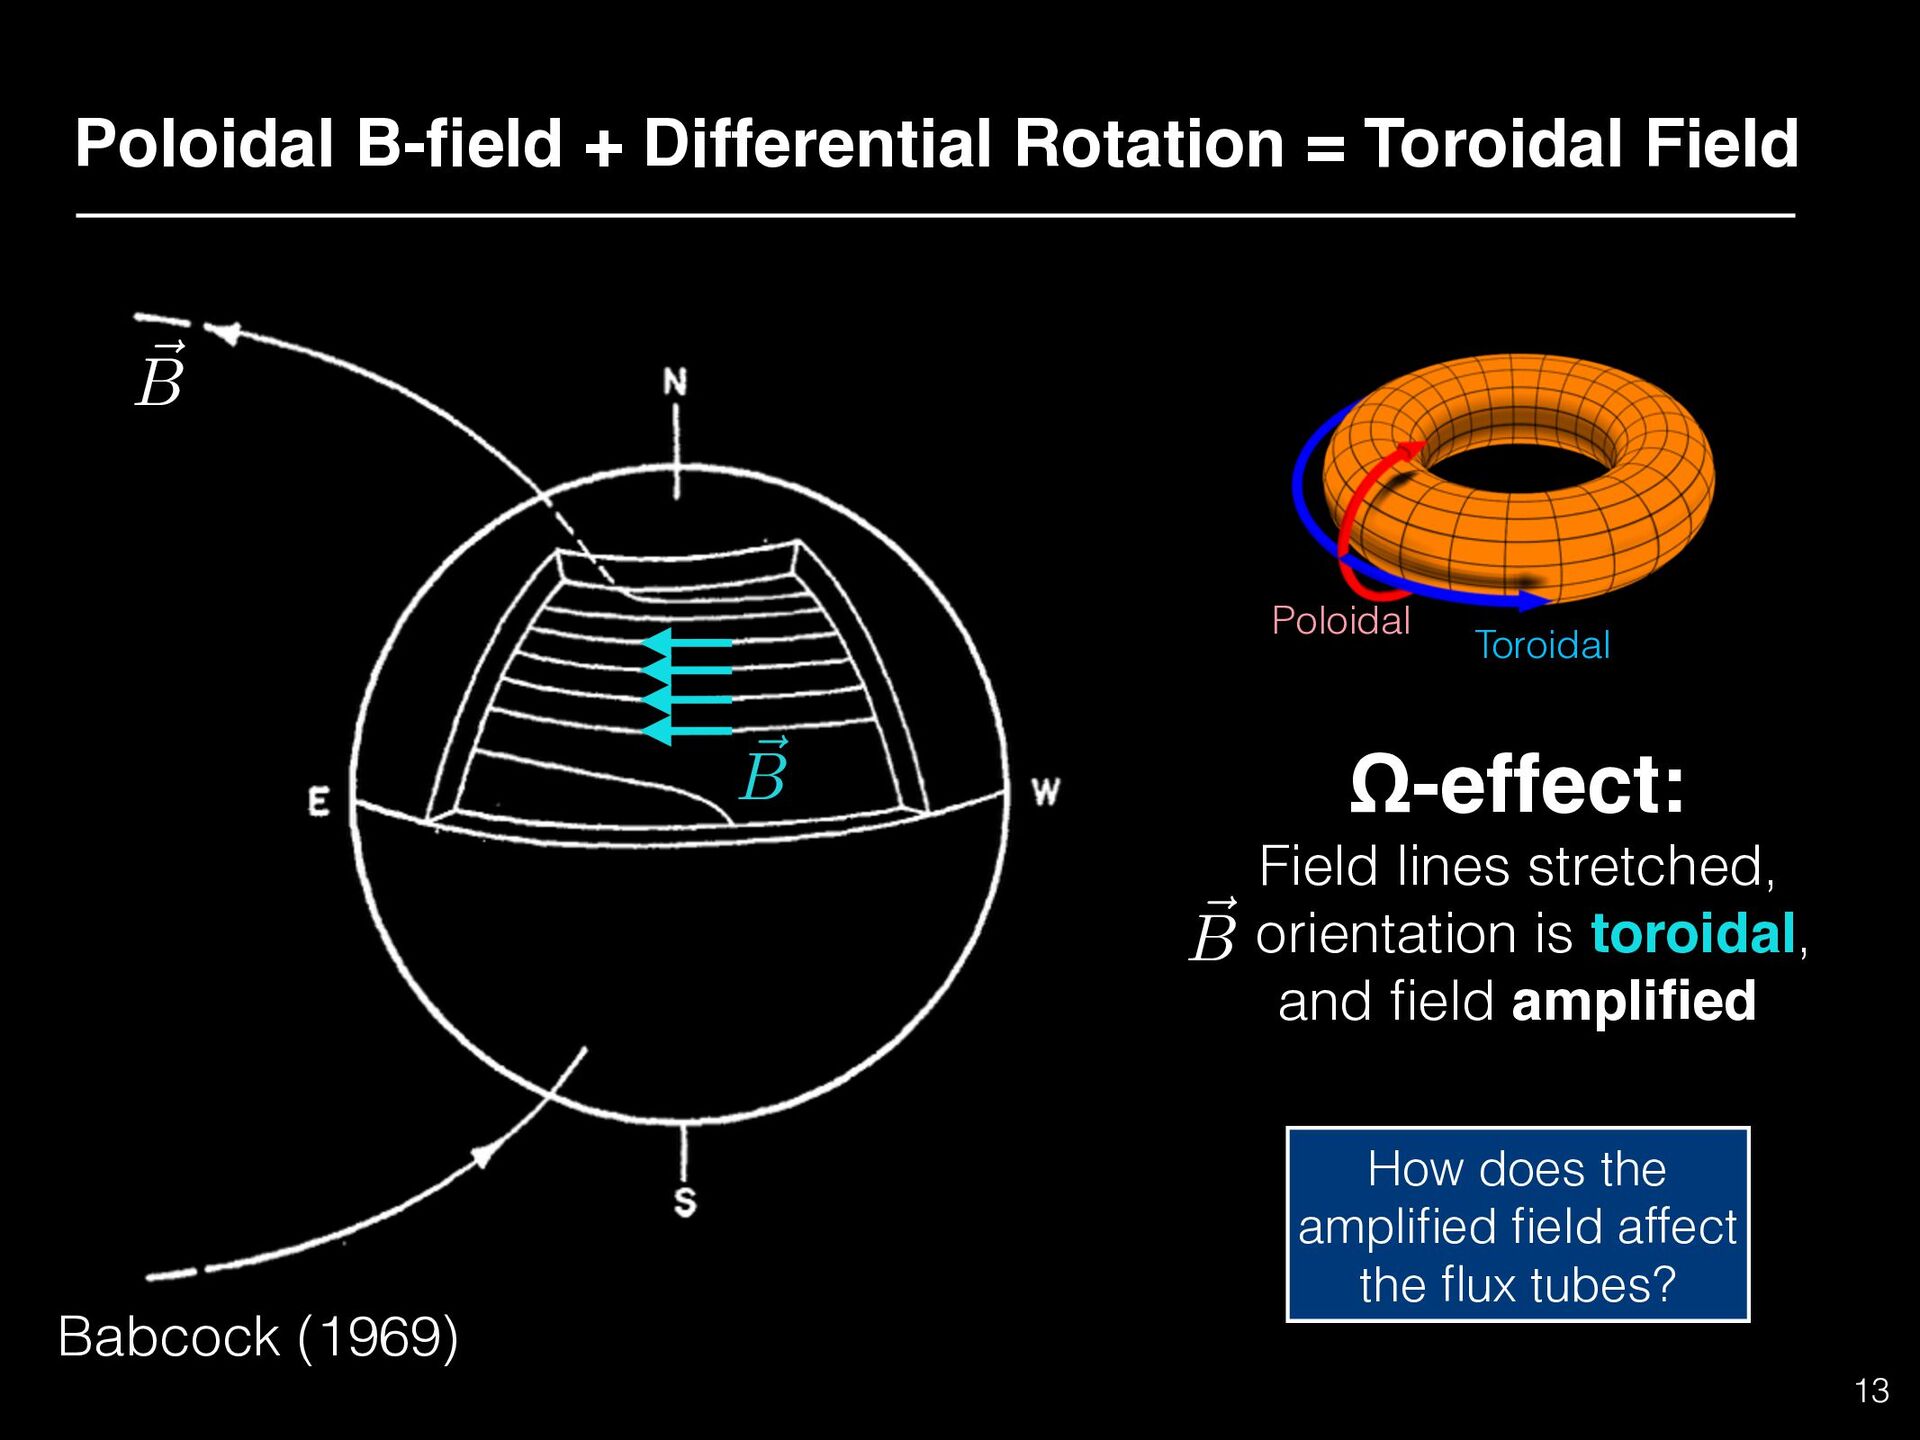
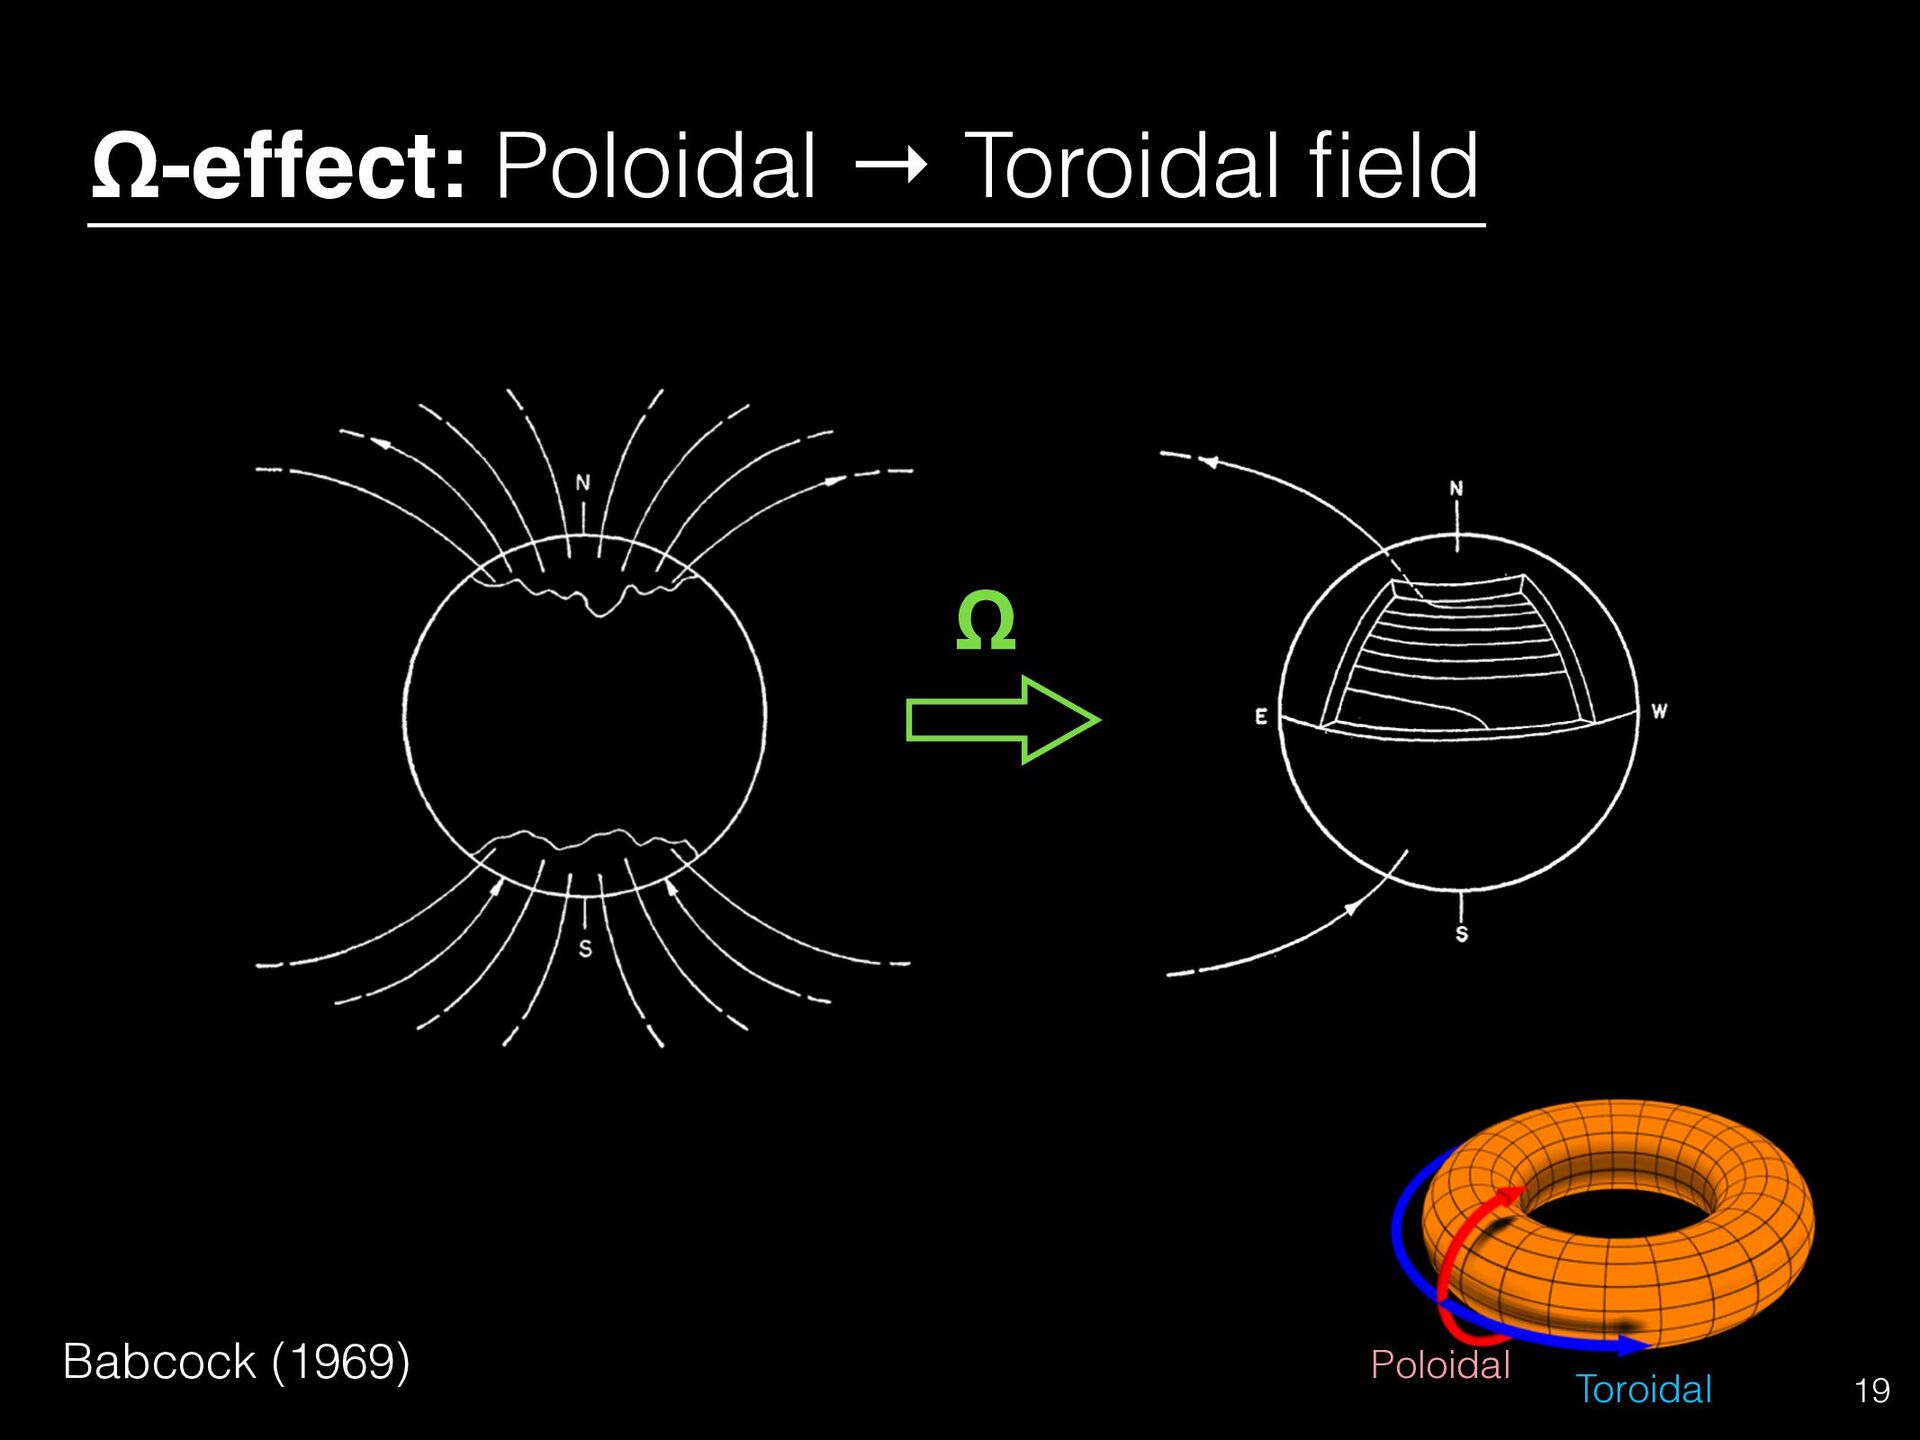
– What plasma motions can produce long-lived magnetic activity? – How does the magnetic energy oscillate between two components? – poloidal: dipolar field near polar caps – toroidal: spots at active latitudes 8
– What plasma motions can produce long-lived magnetic activity? – How does the magnetic energy oscillate between two components? – poloidal: dipolar field near polar caps – toroidal: spots at active latitudes 8 Poloidal Toroidal
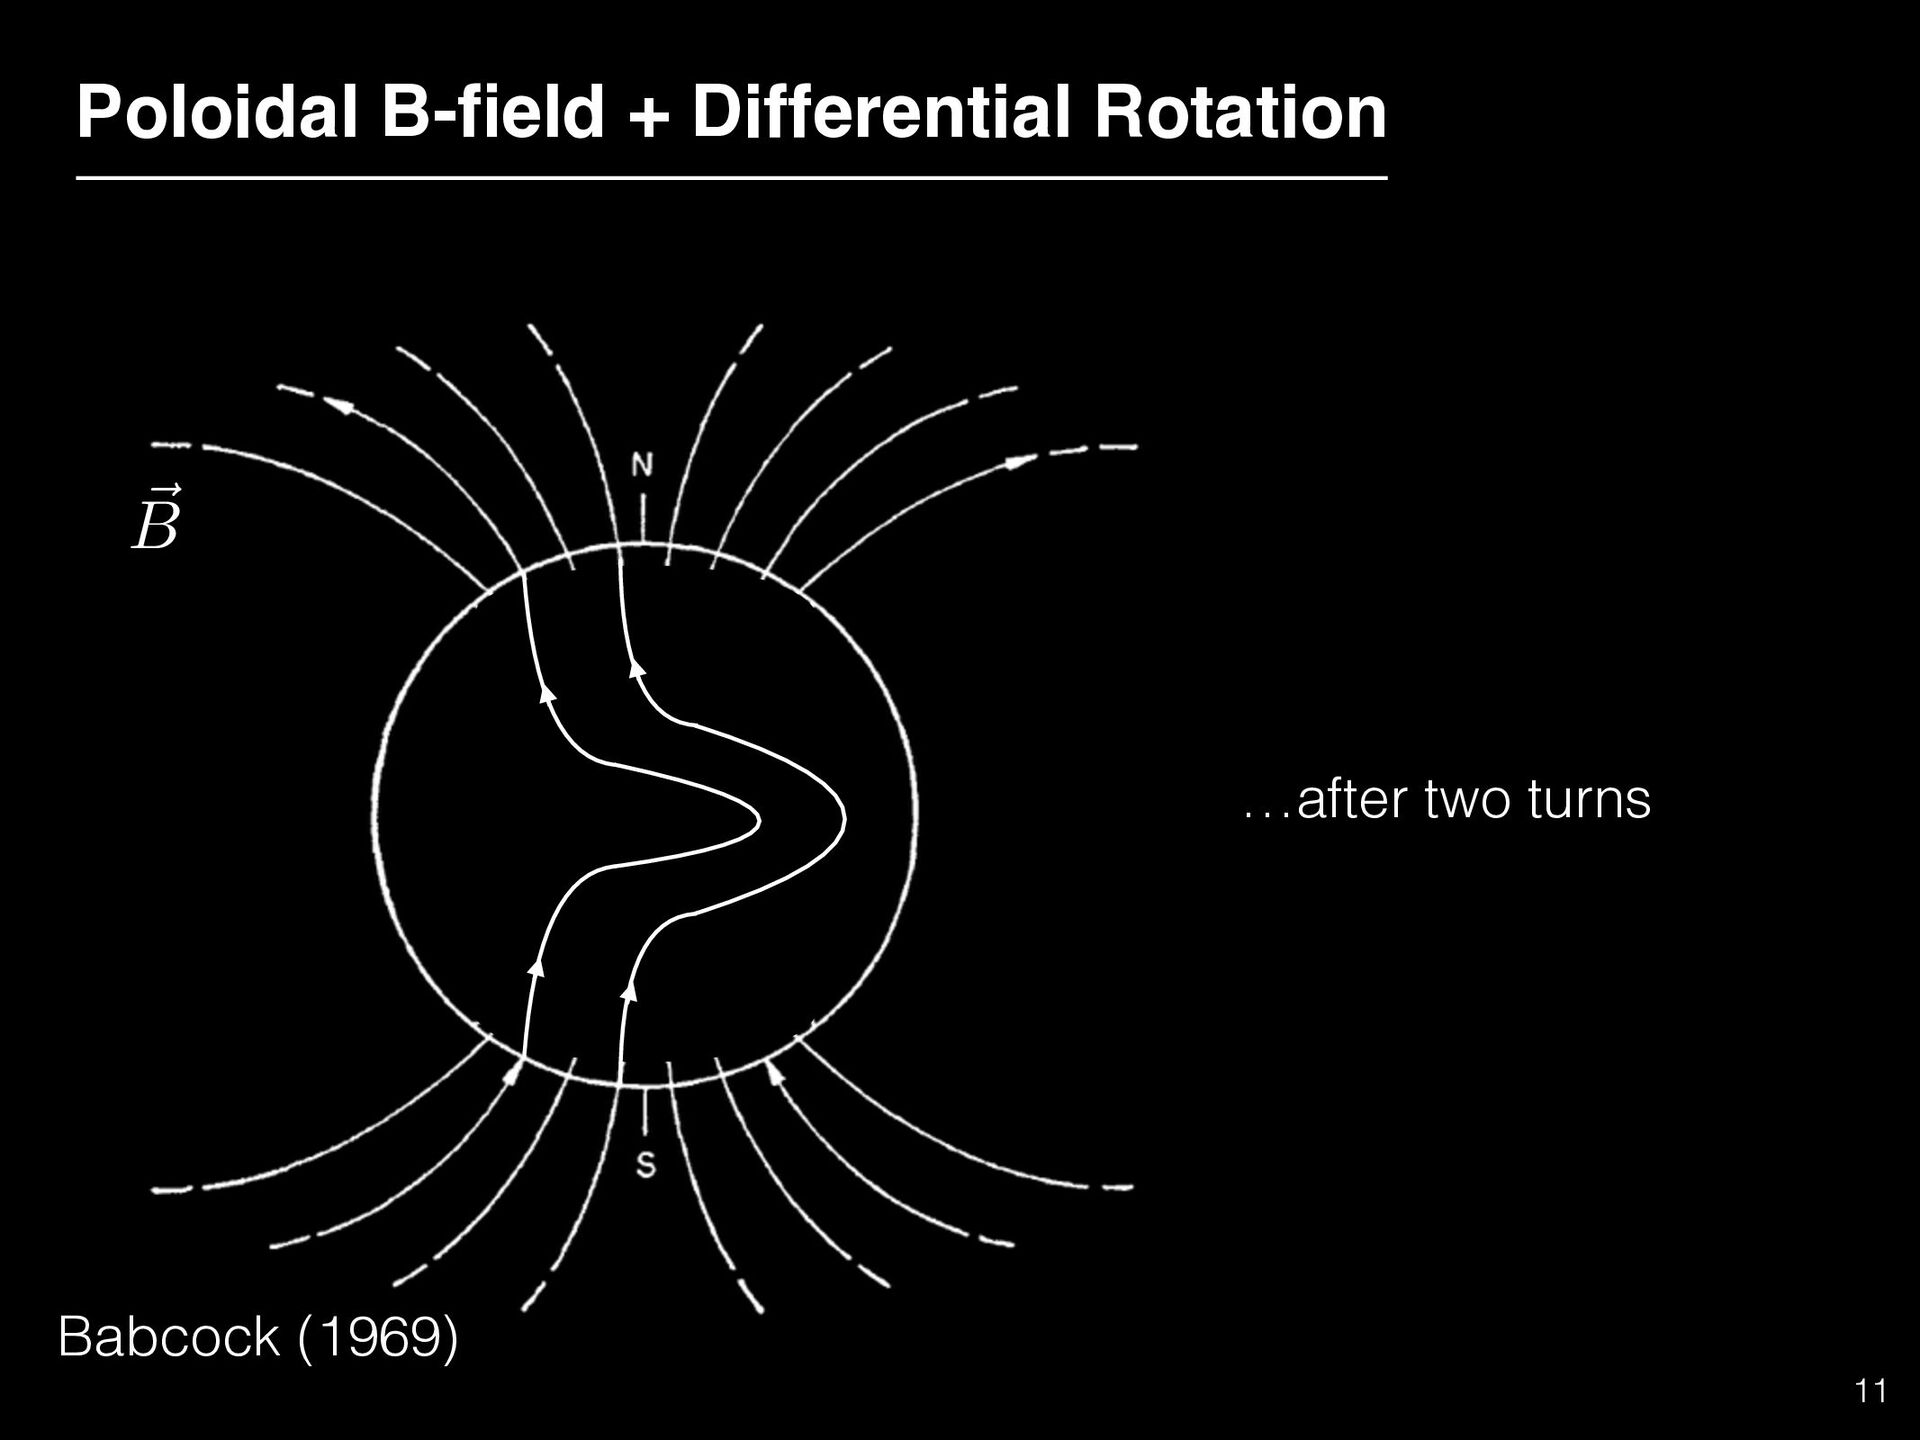
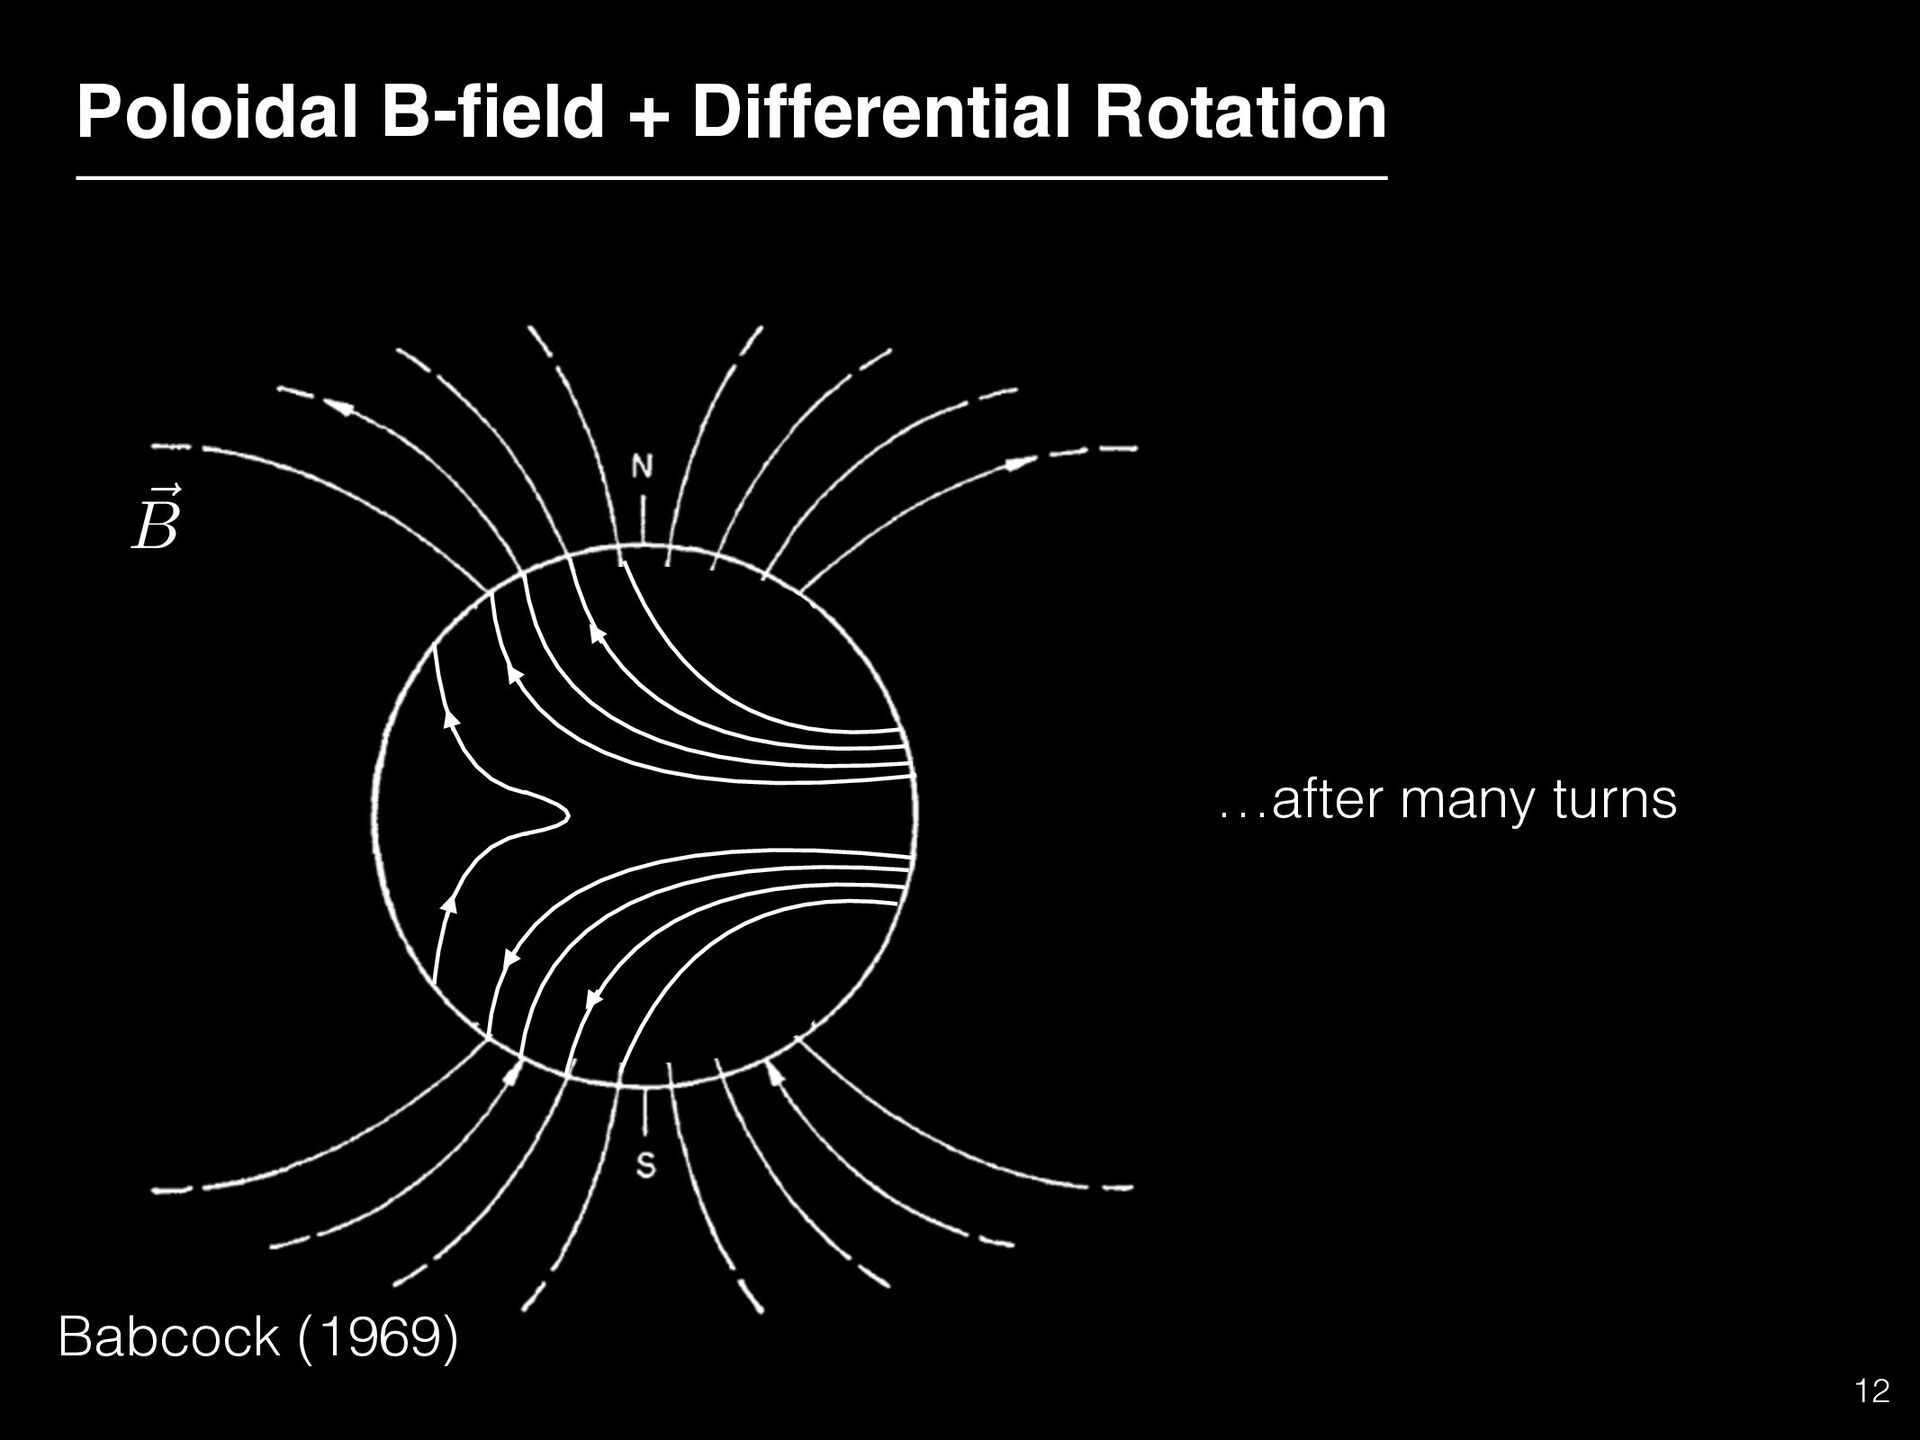
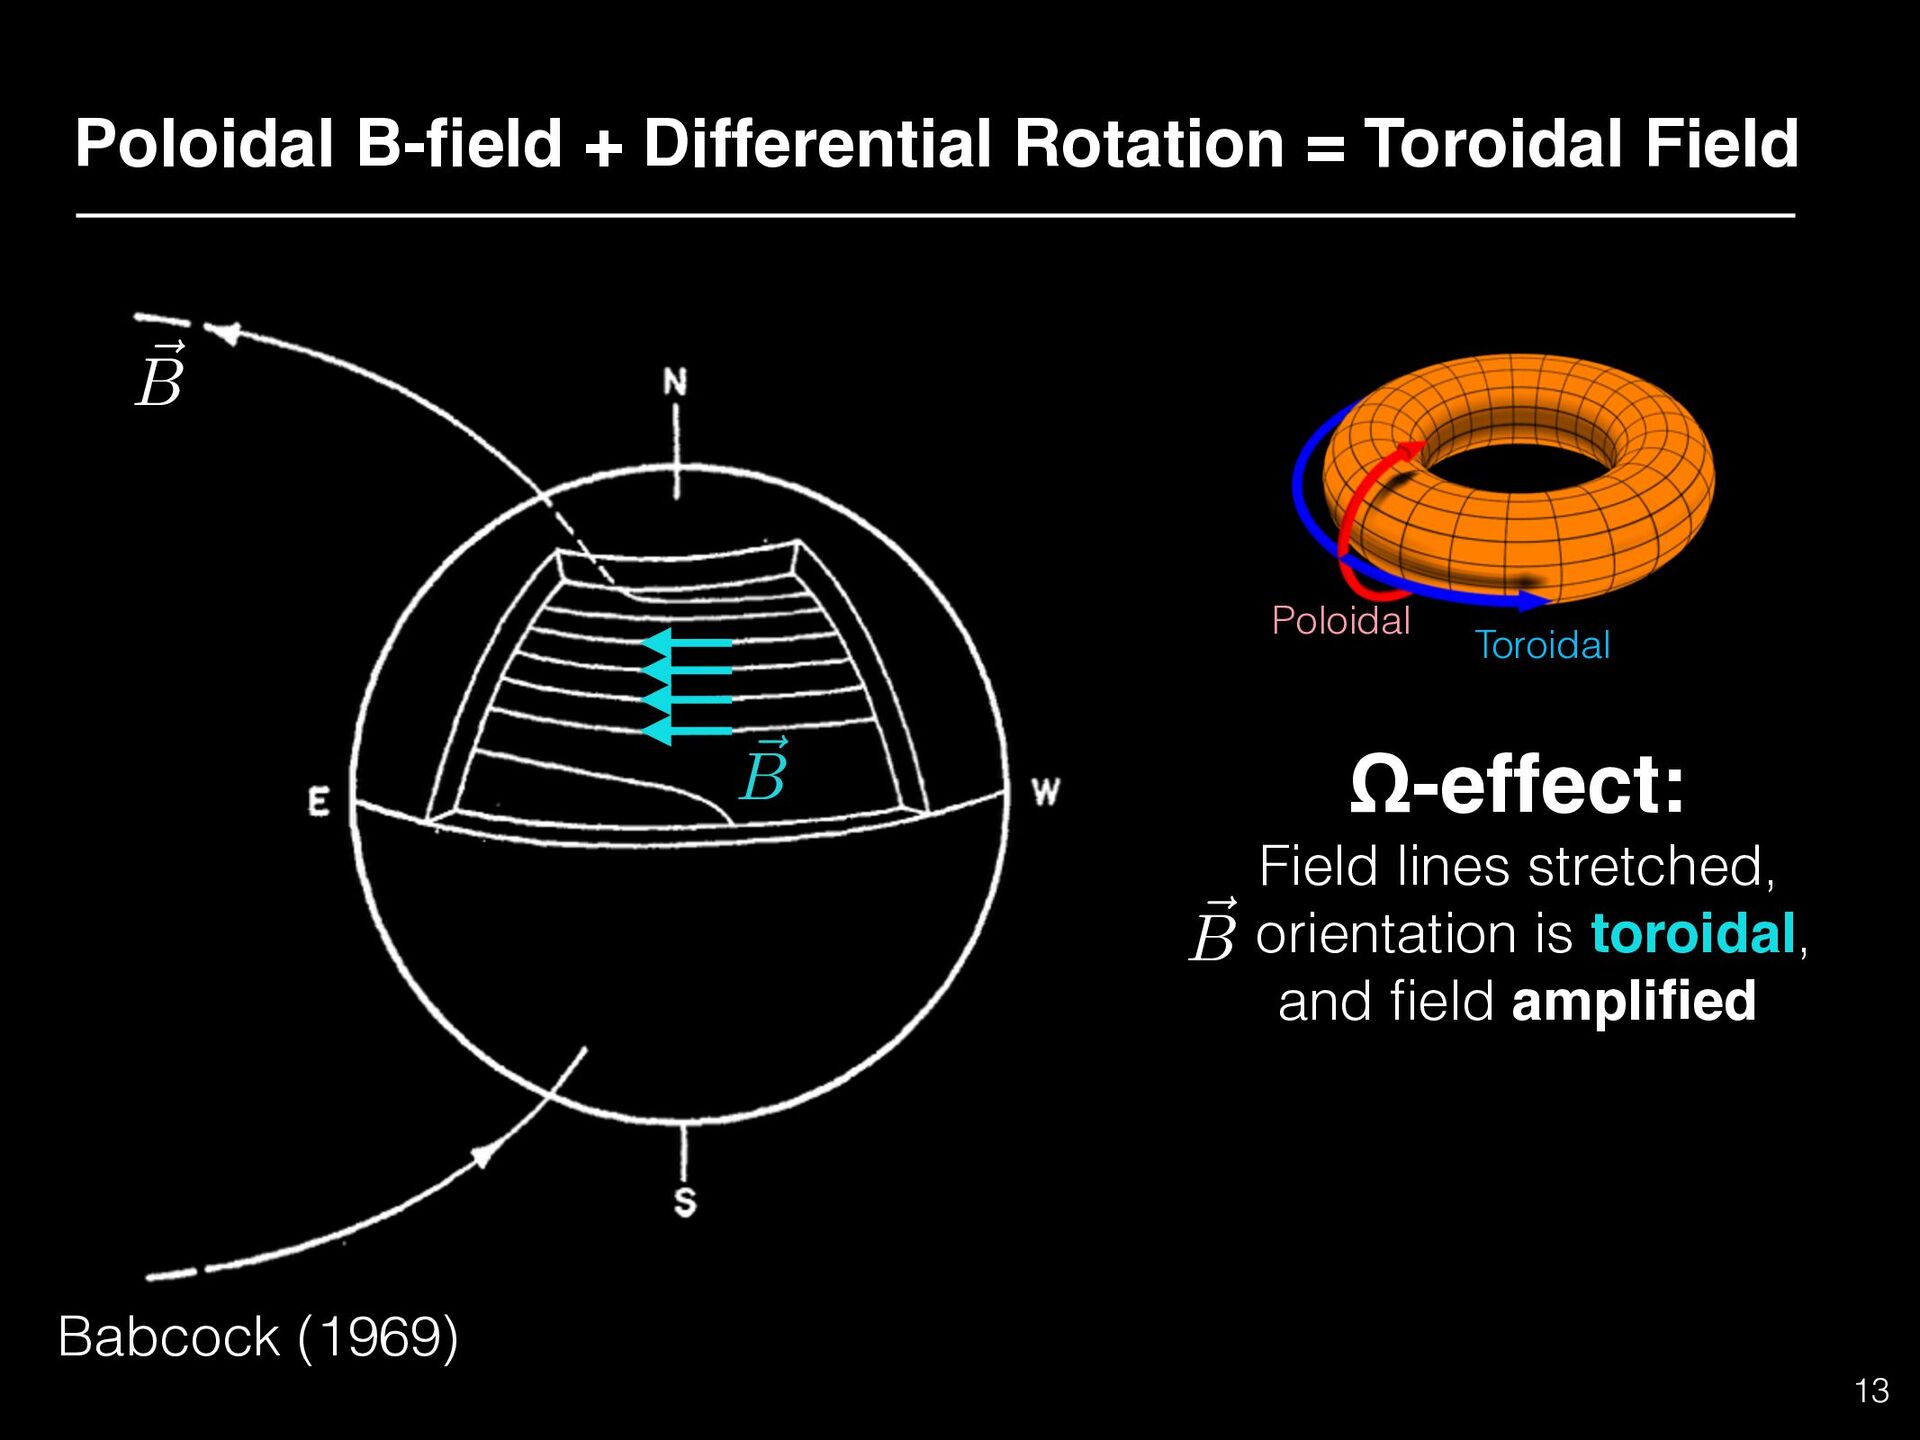
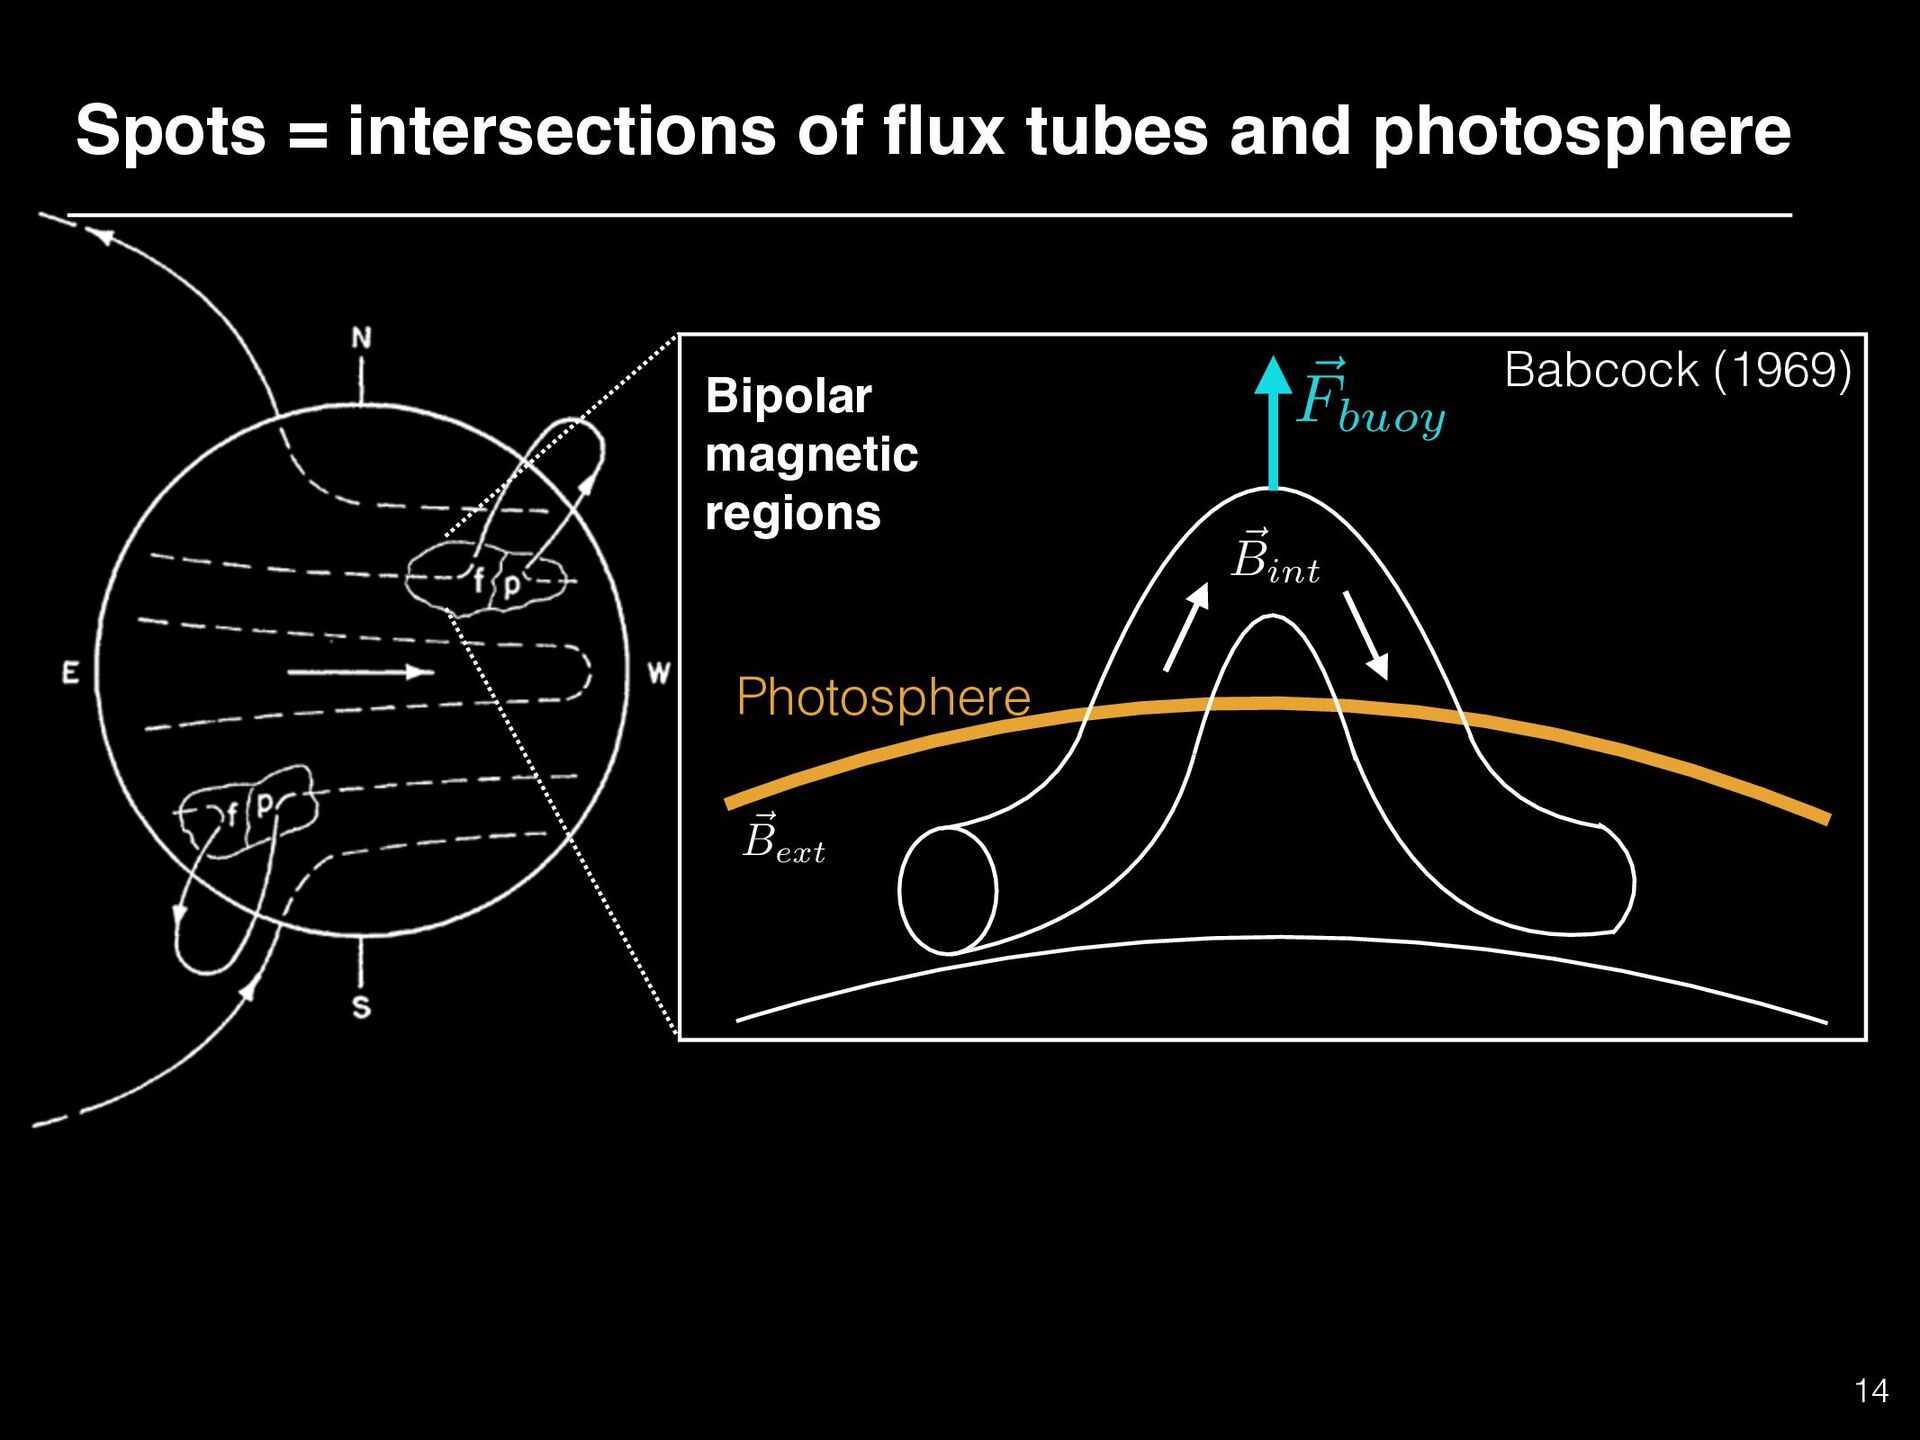
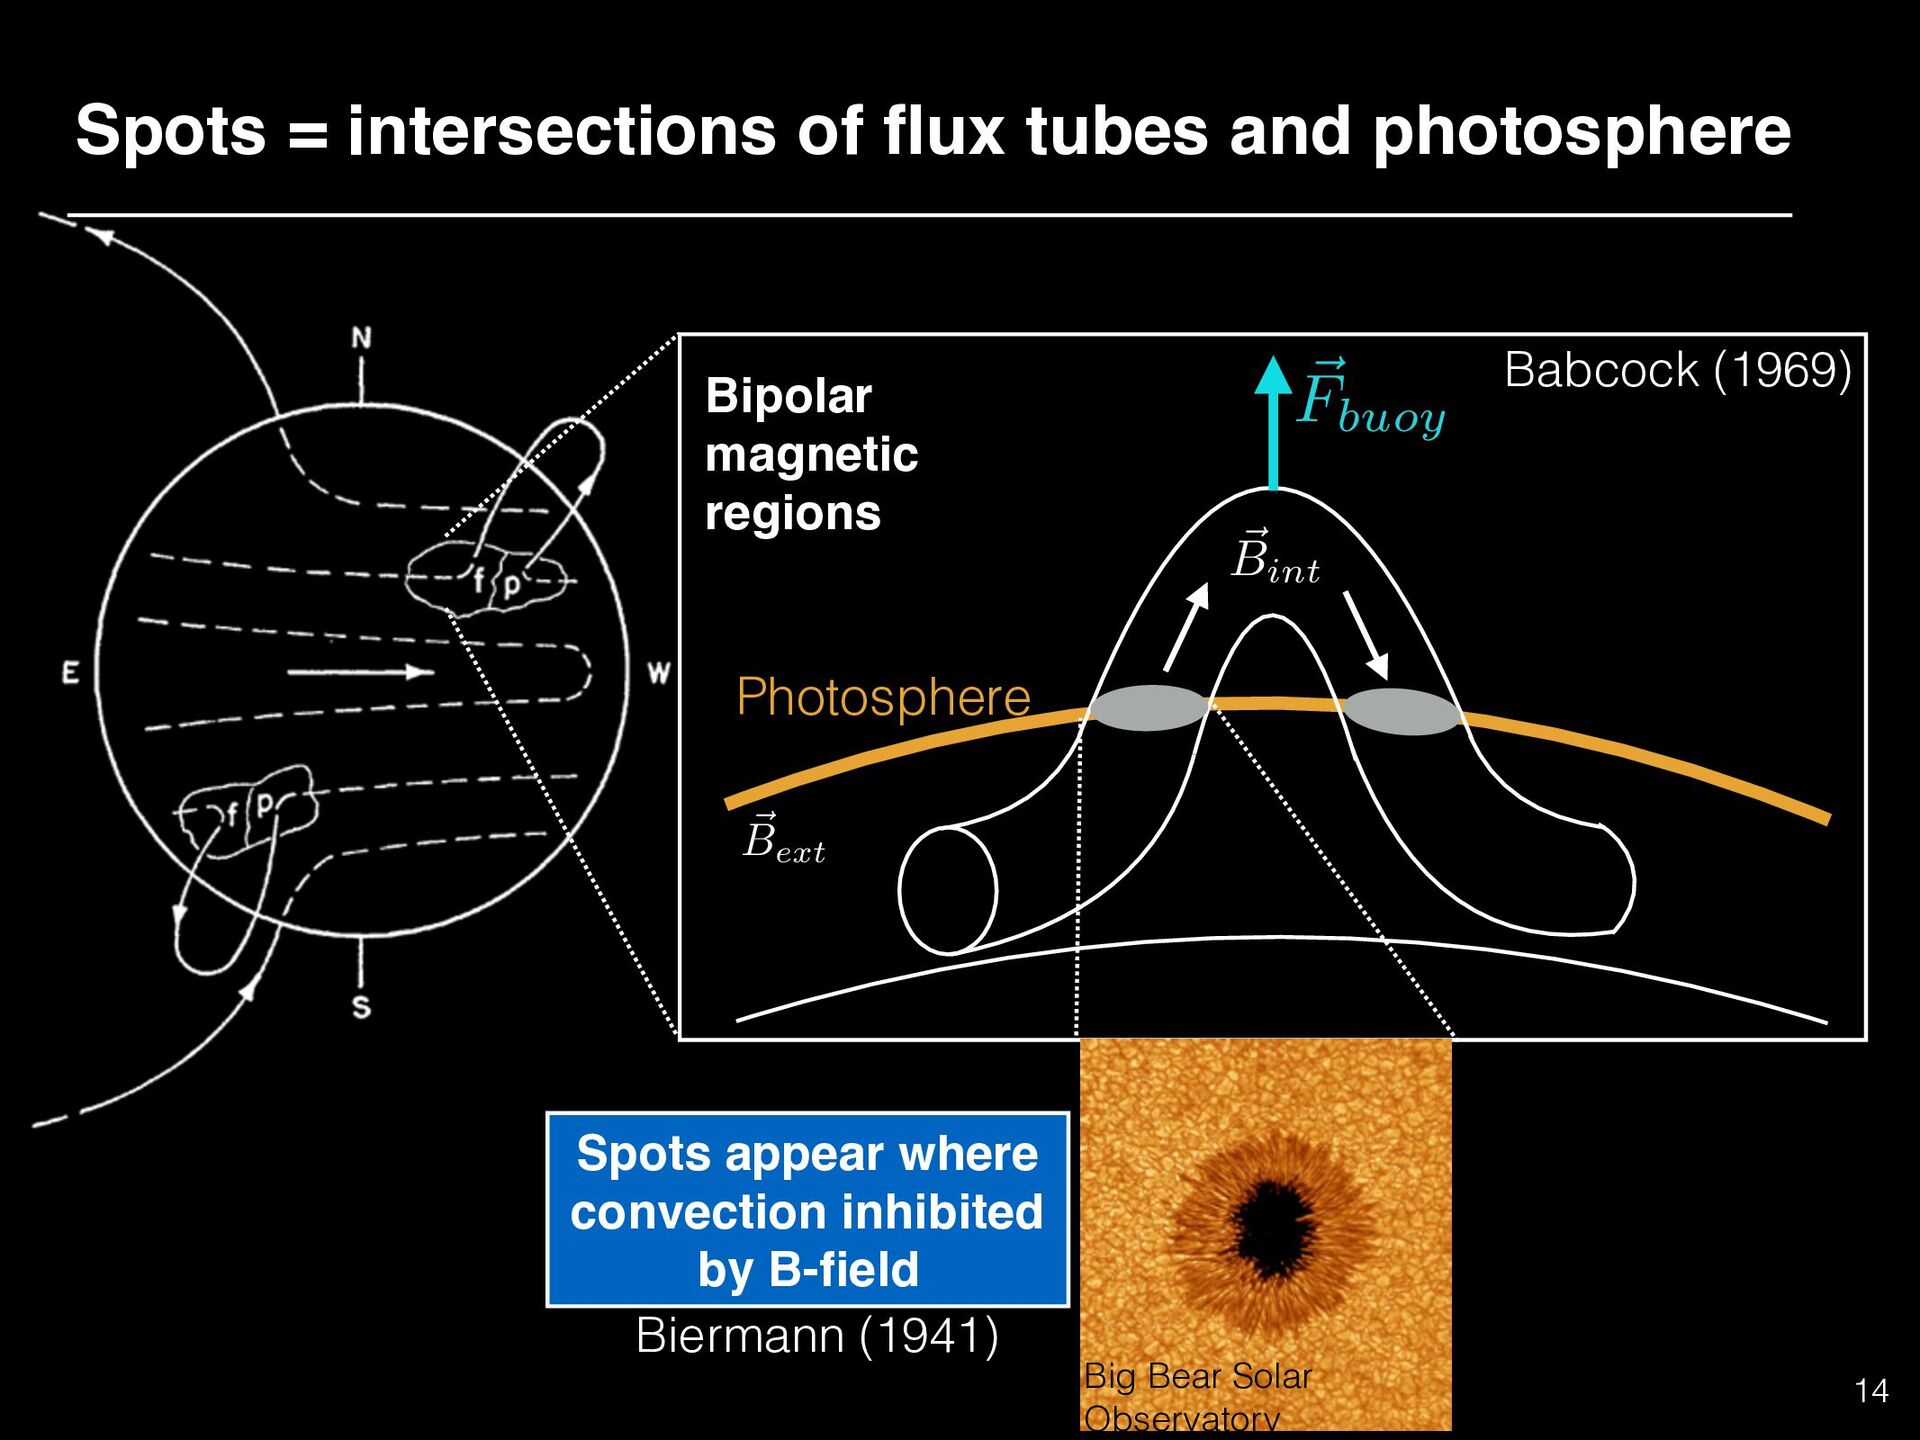
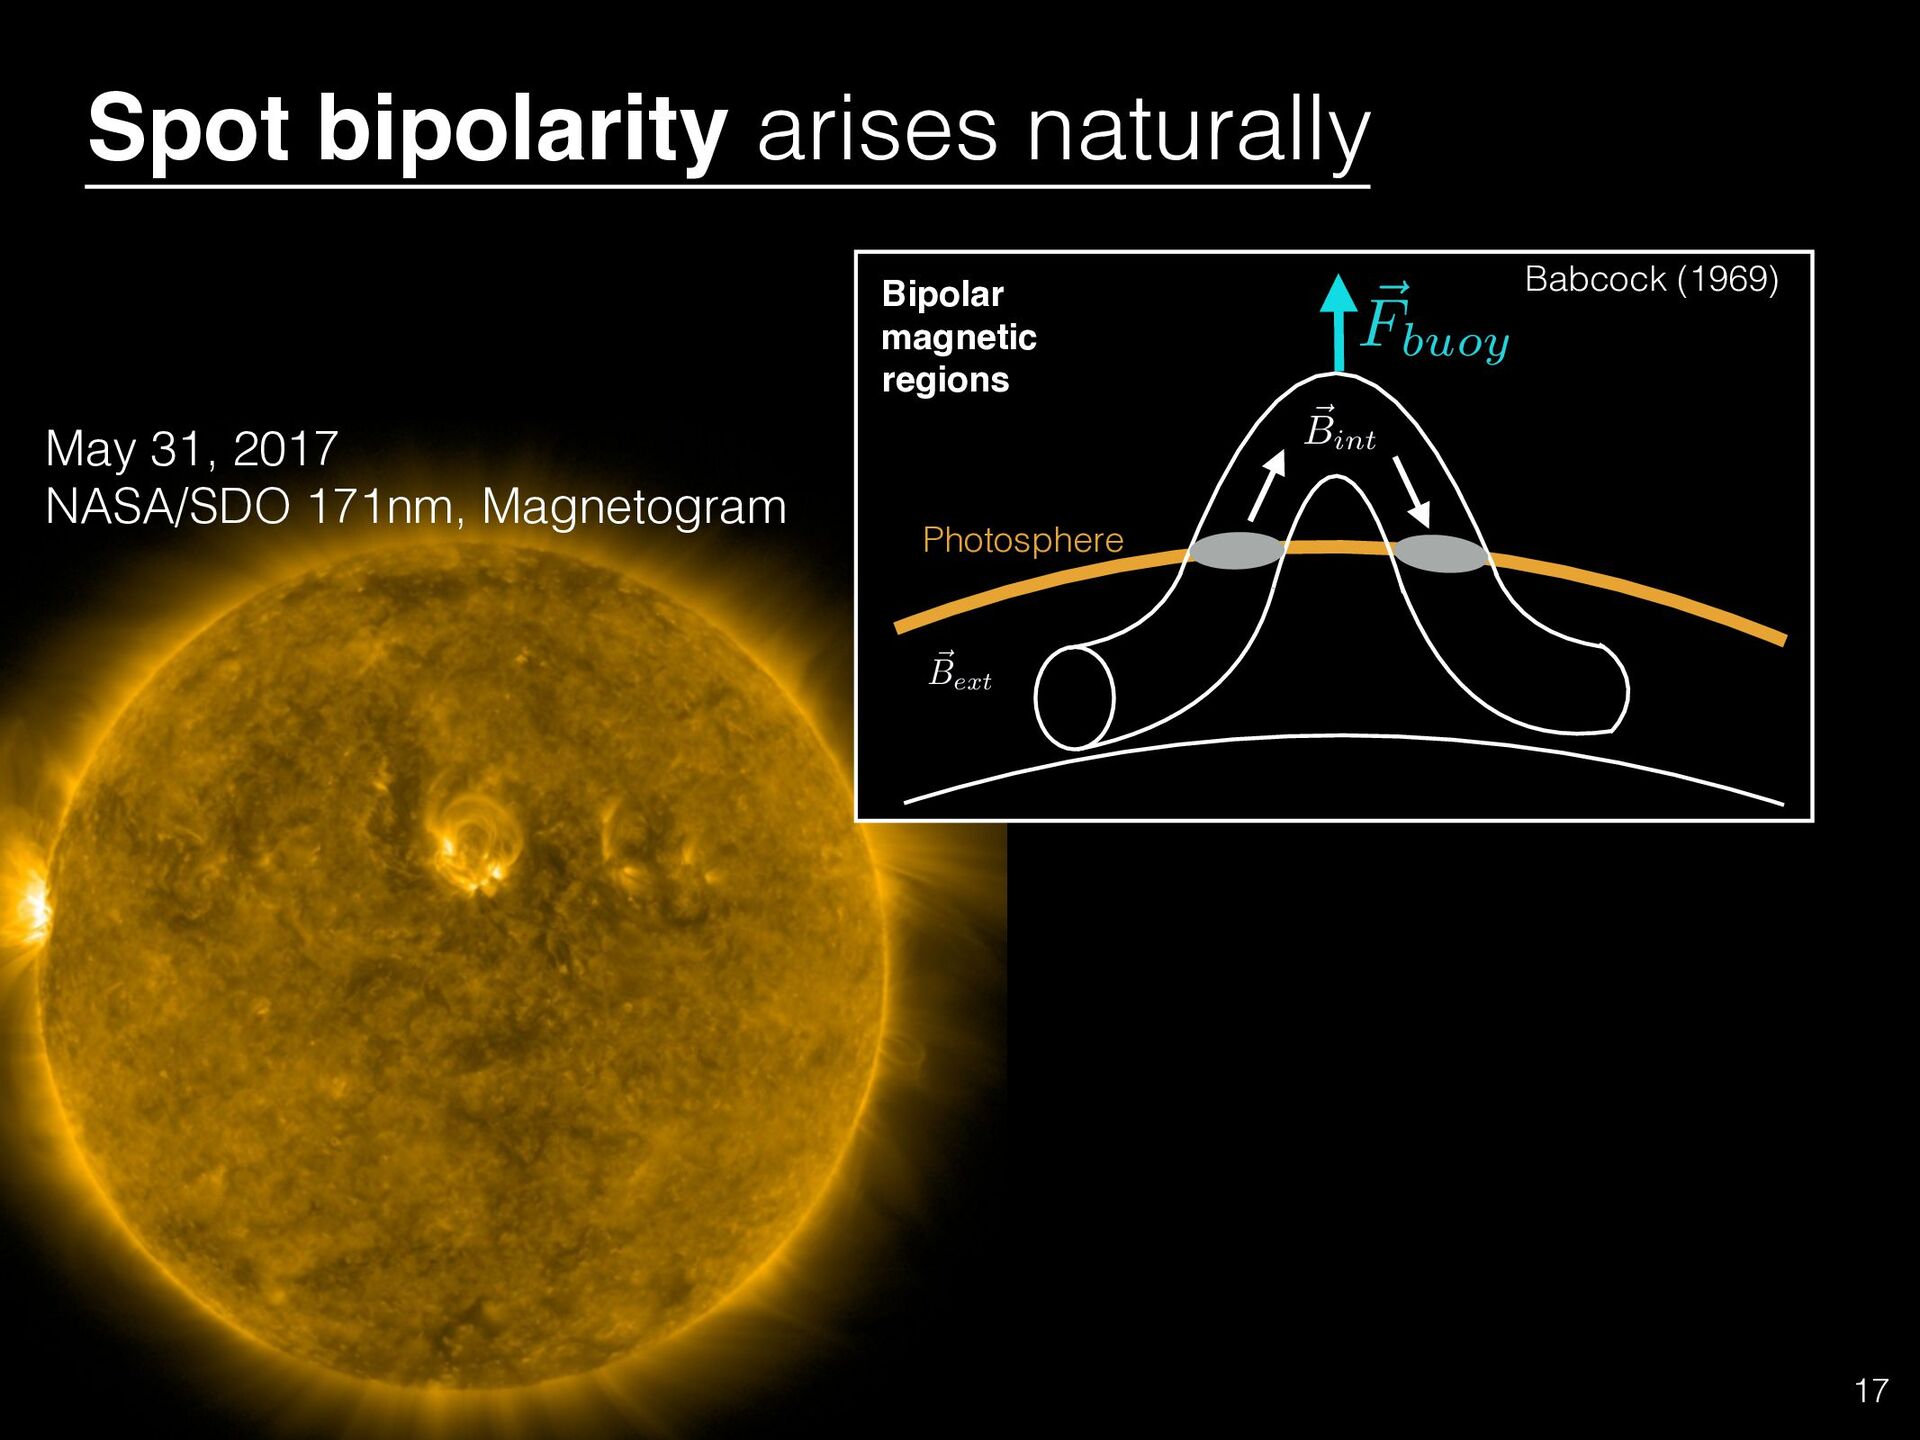
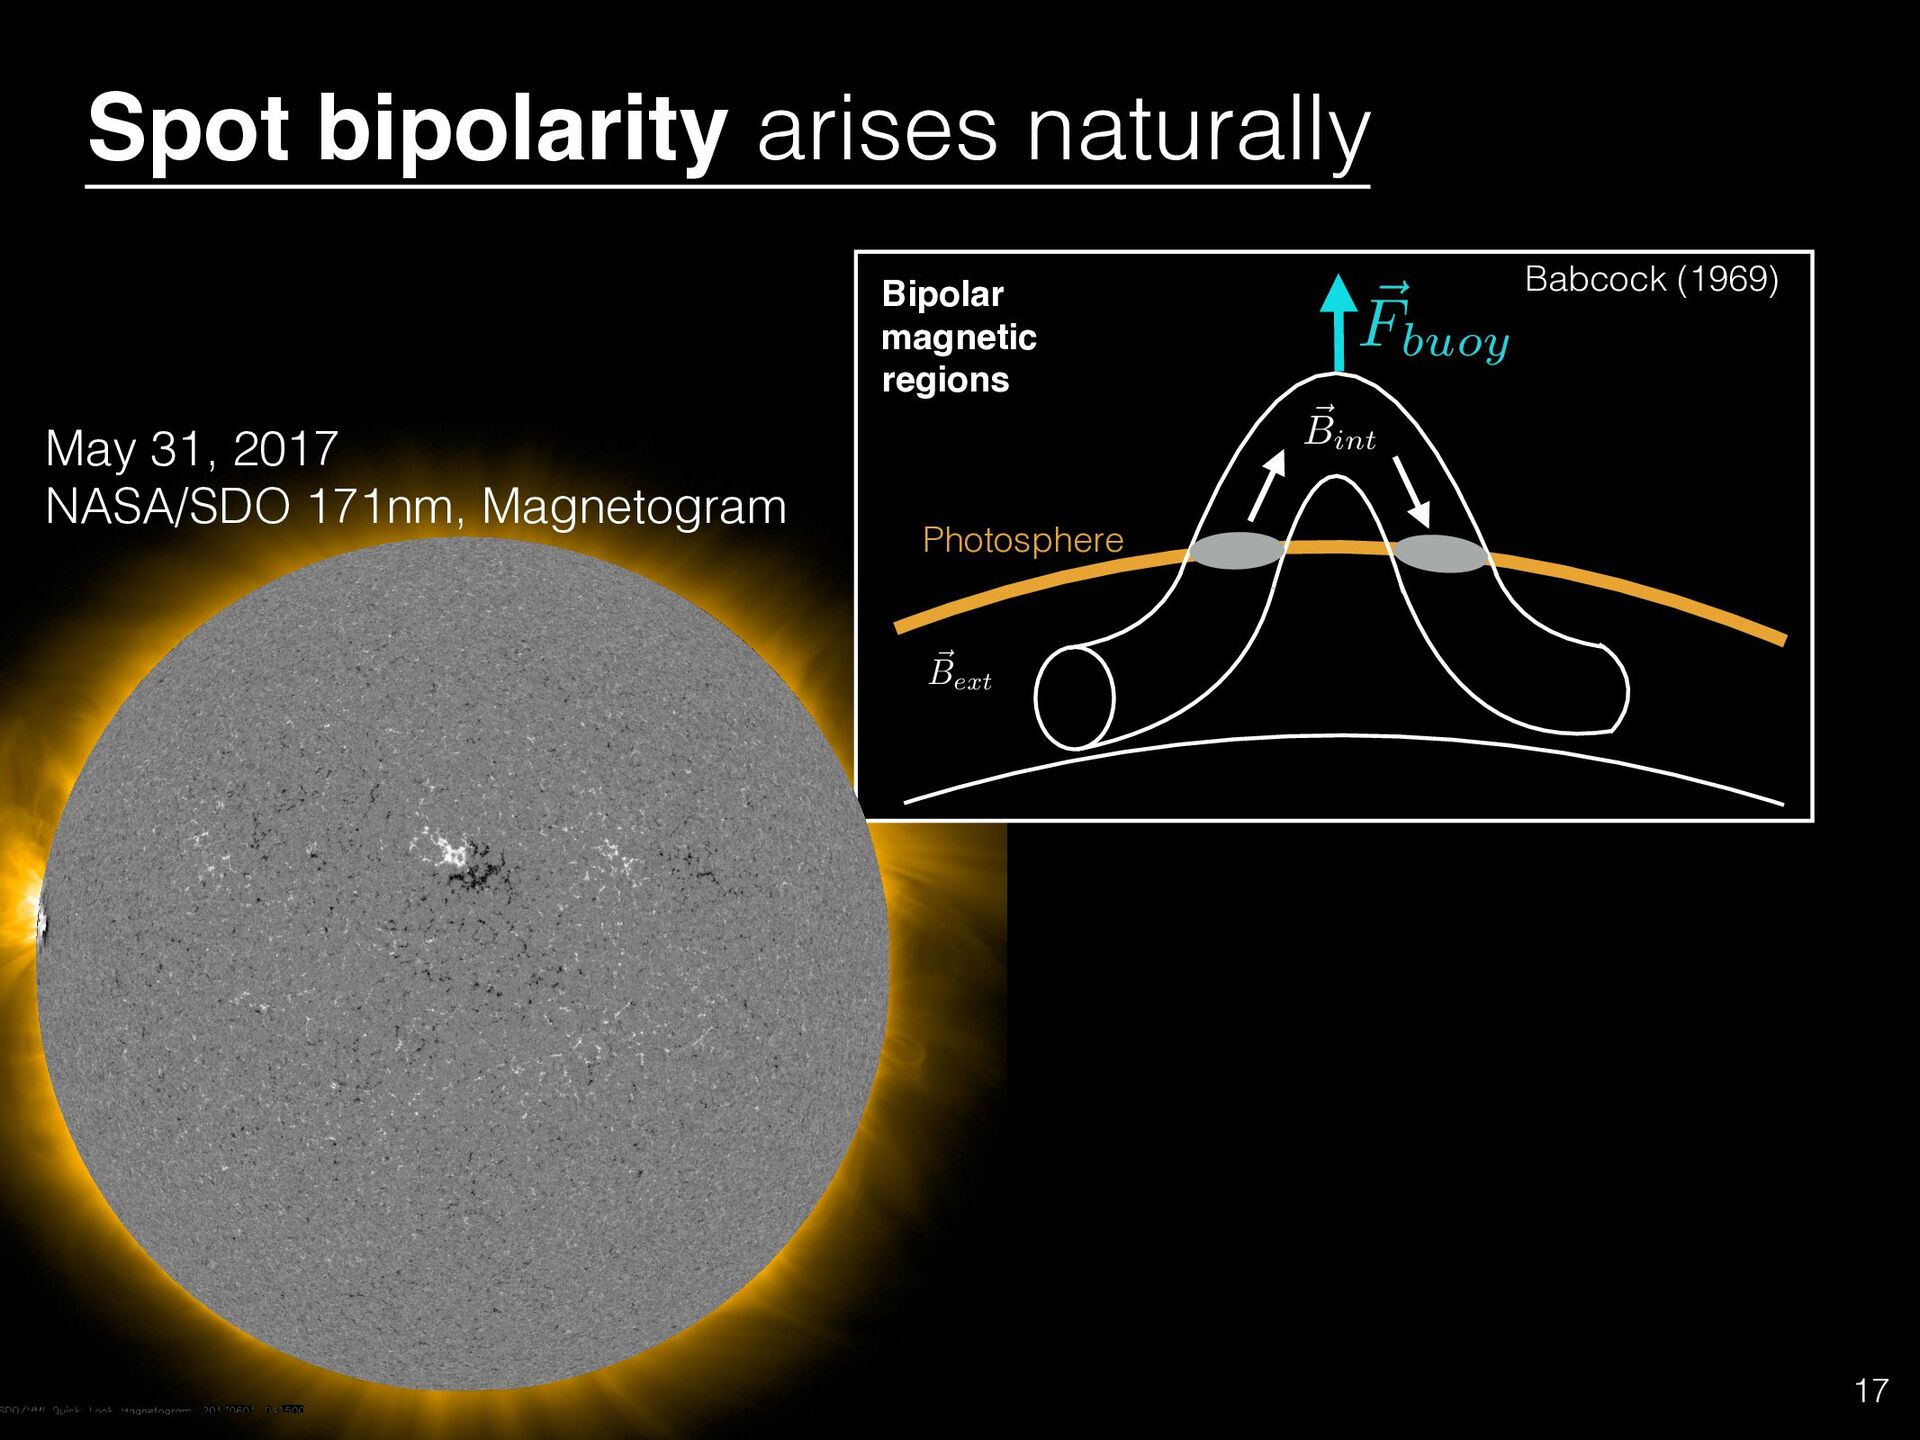
amplified ~ B ~ B Babcock (1969) How does the amplified field affect the flux tubes? ~ B Poloidal B-field + Differential Rotation = Toroidal Field Poloidal Toroidal
Babcock (1969) Spots = intersections of flux tubes and photosphere ~ F buoy Biermann (1941) Spots appear where convection inhibited by B-field Big Bear Solar Observatory
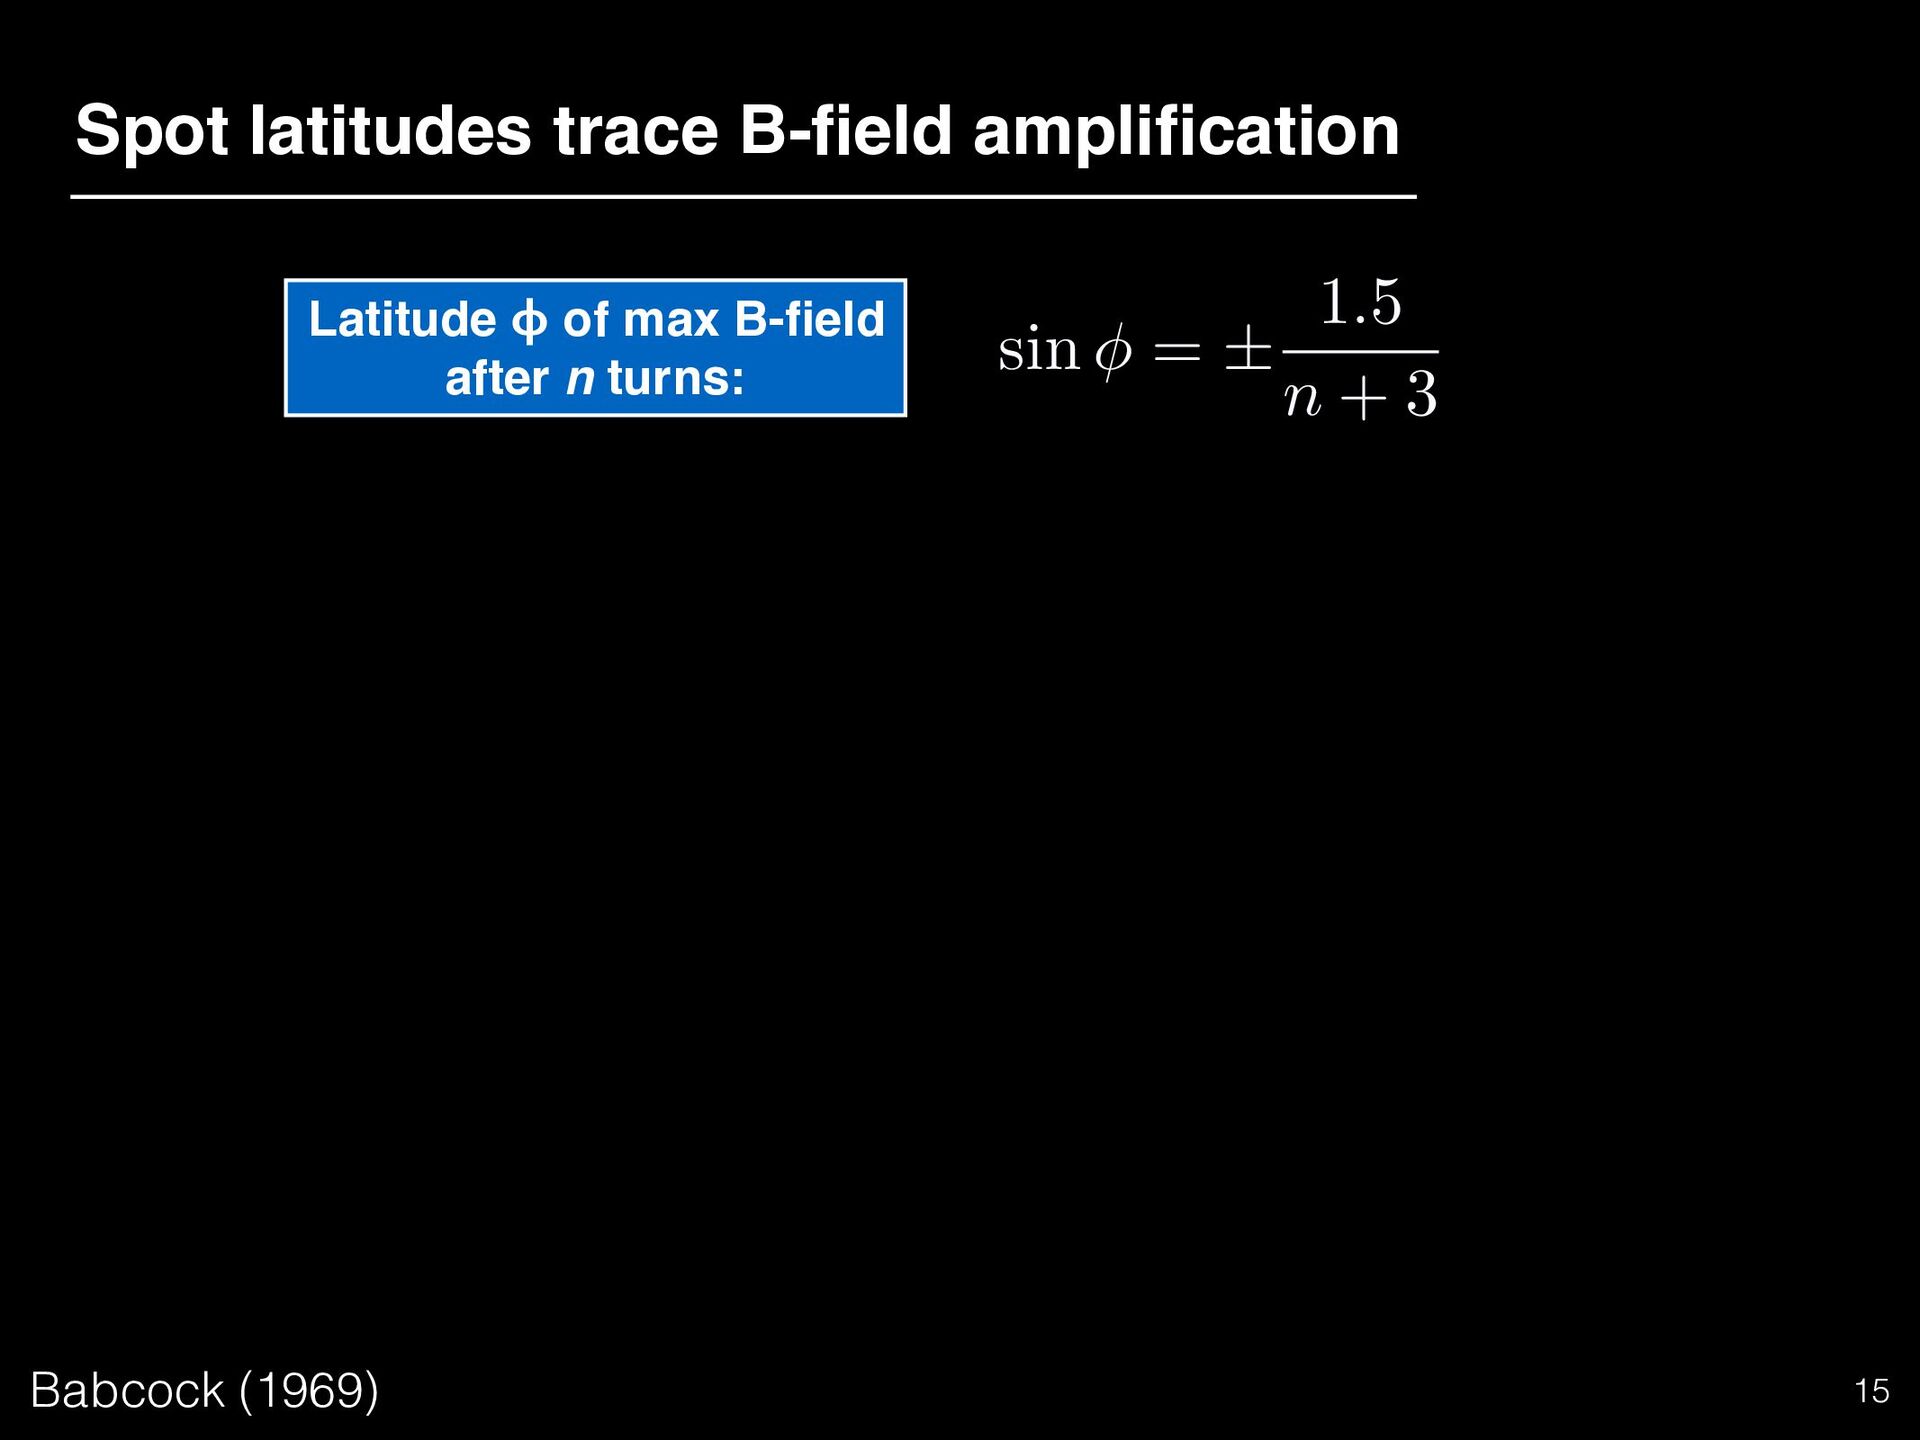
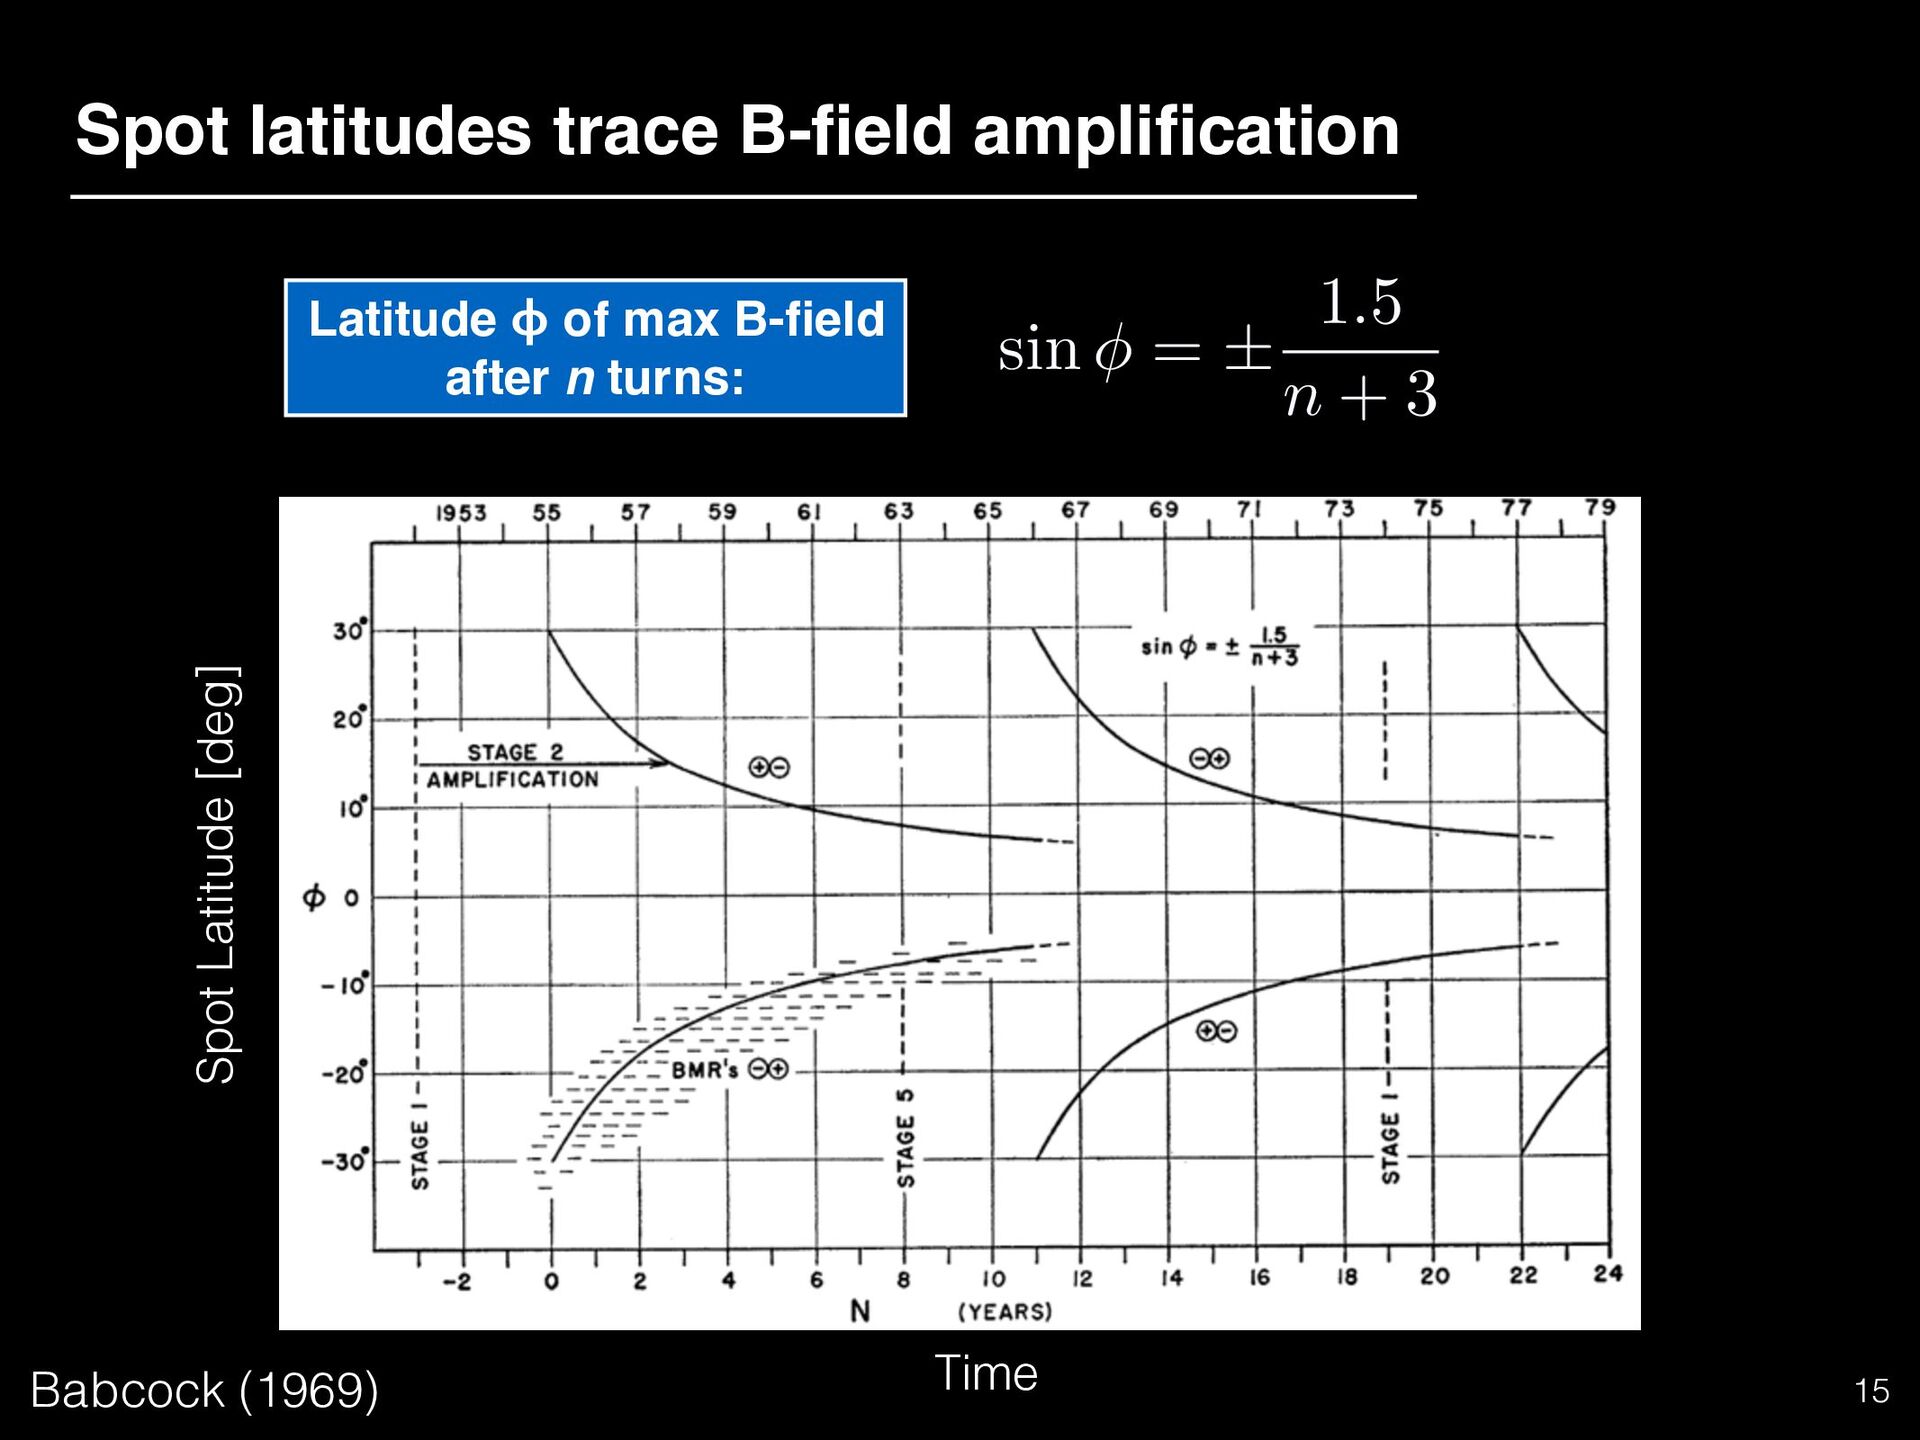
al. (2017) 16 • Spots begin to appear near 30° • Active latitudes drift towards equator • Spots near 15° at spot number maximum Spot latitudes trace B-field amplification
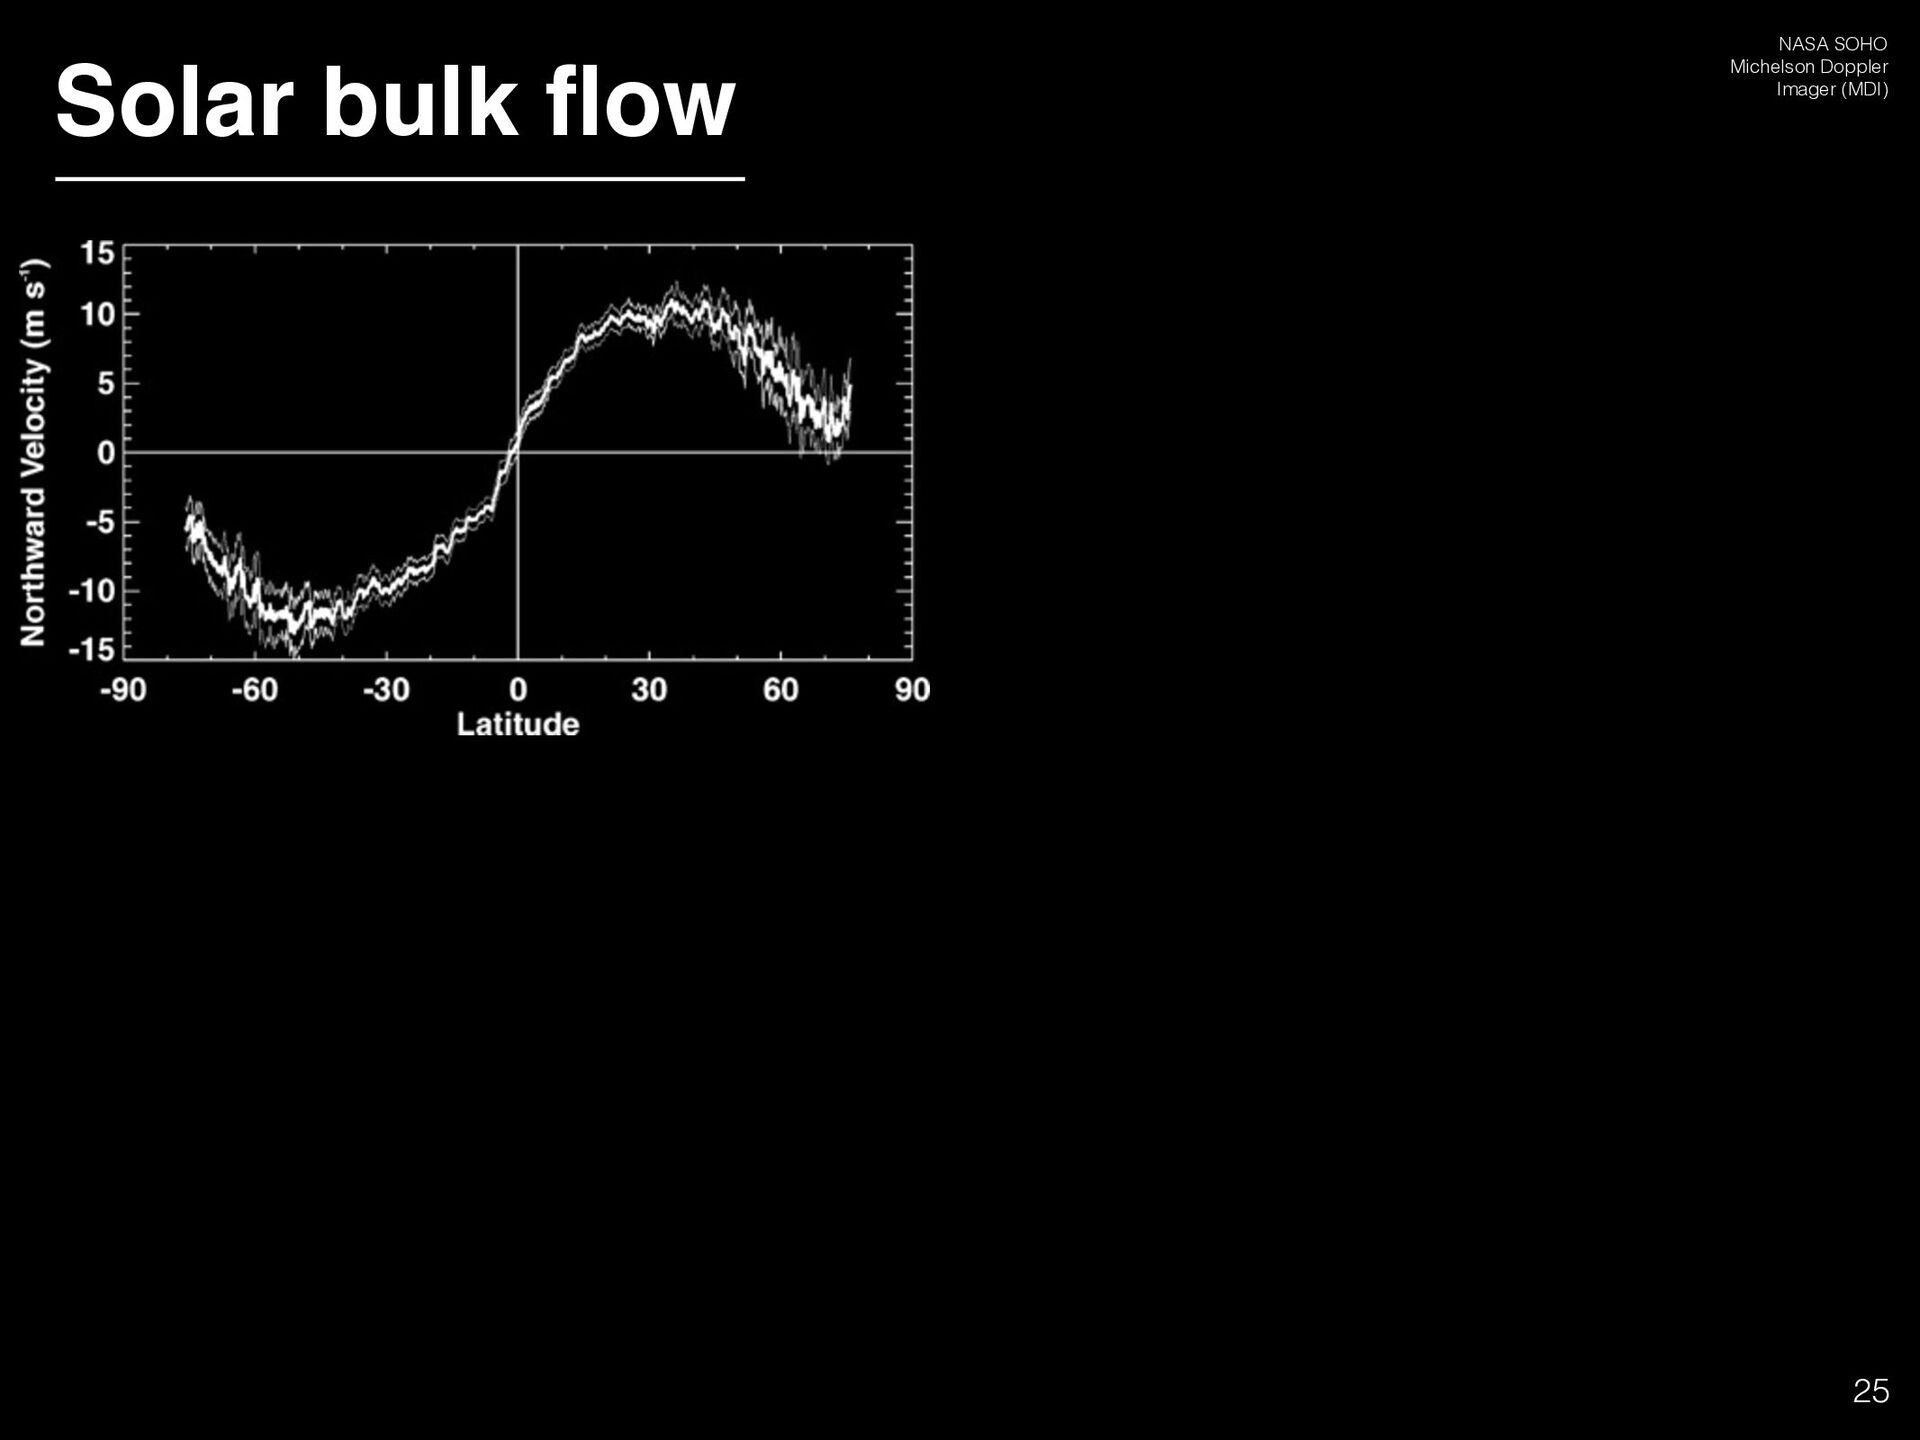
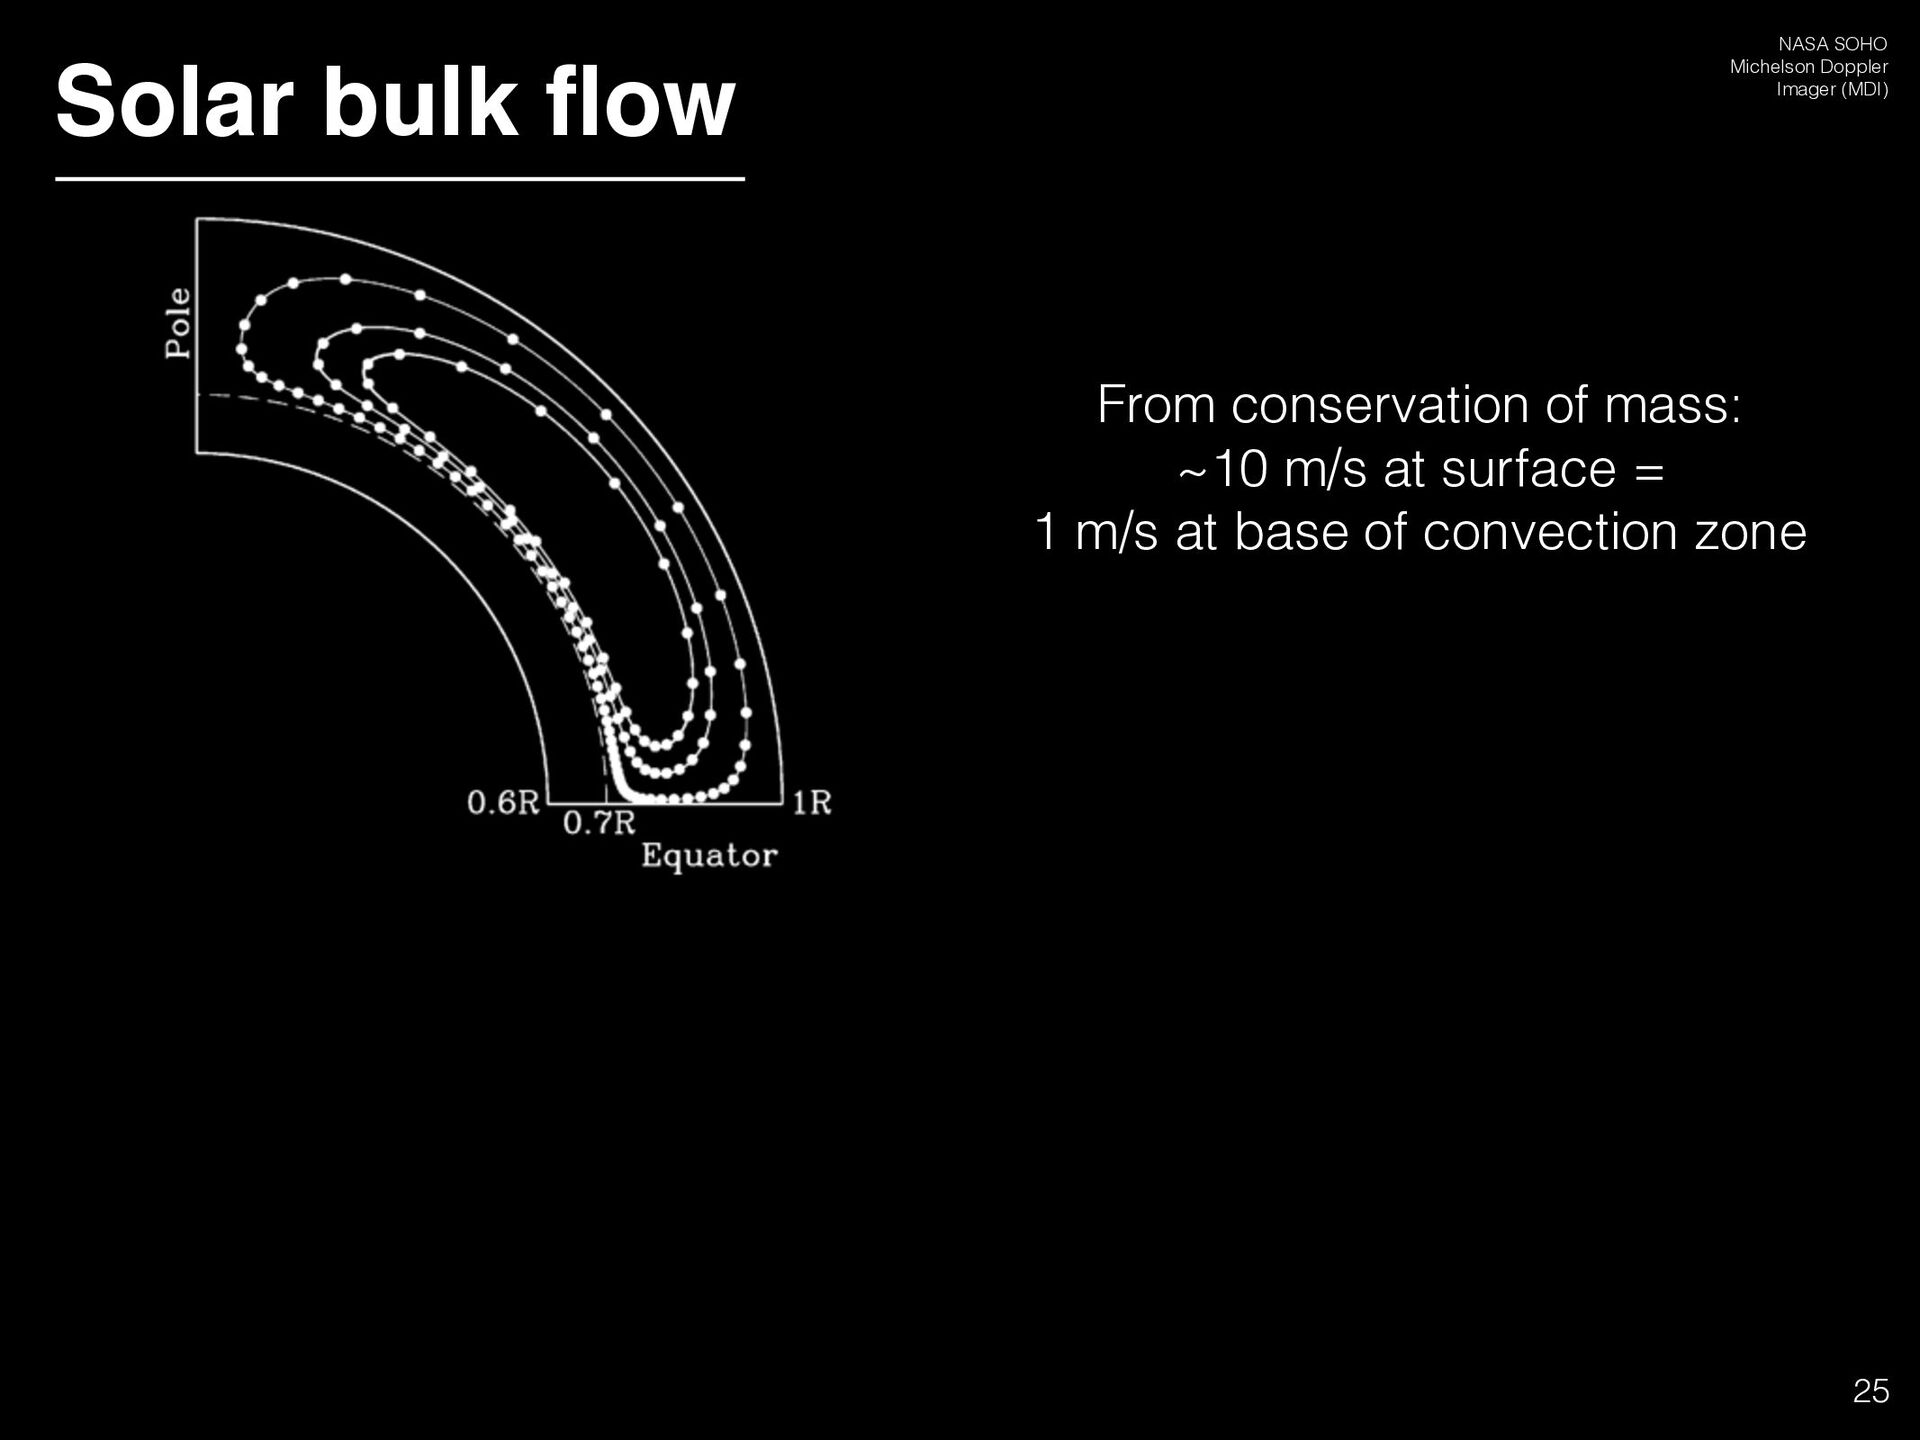
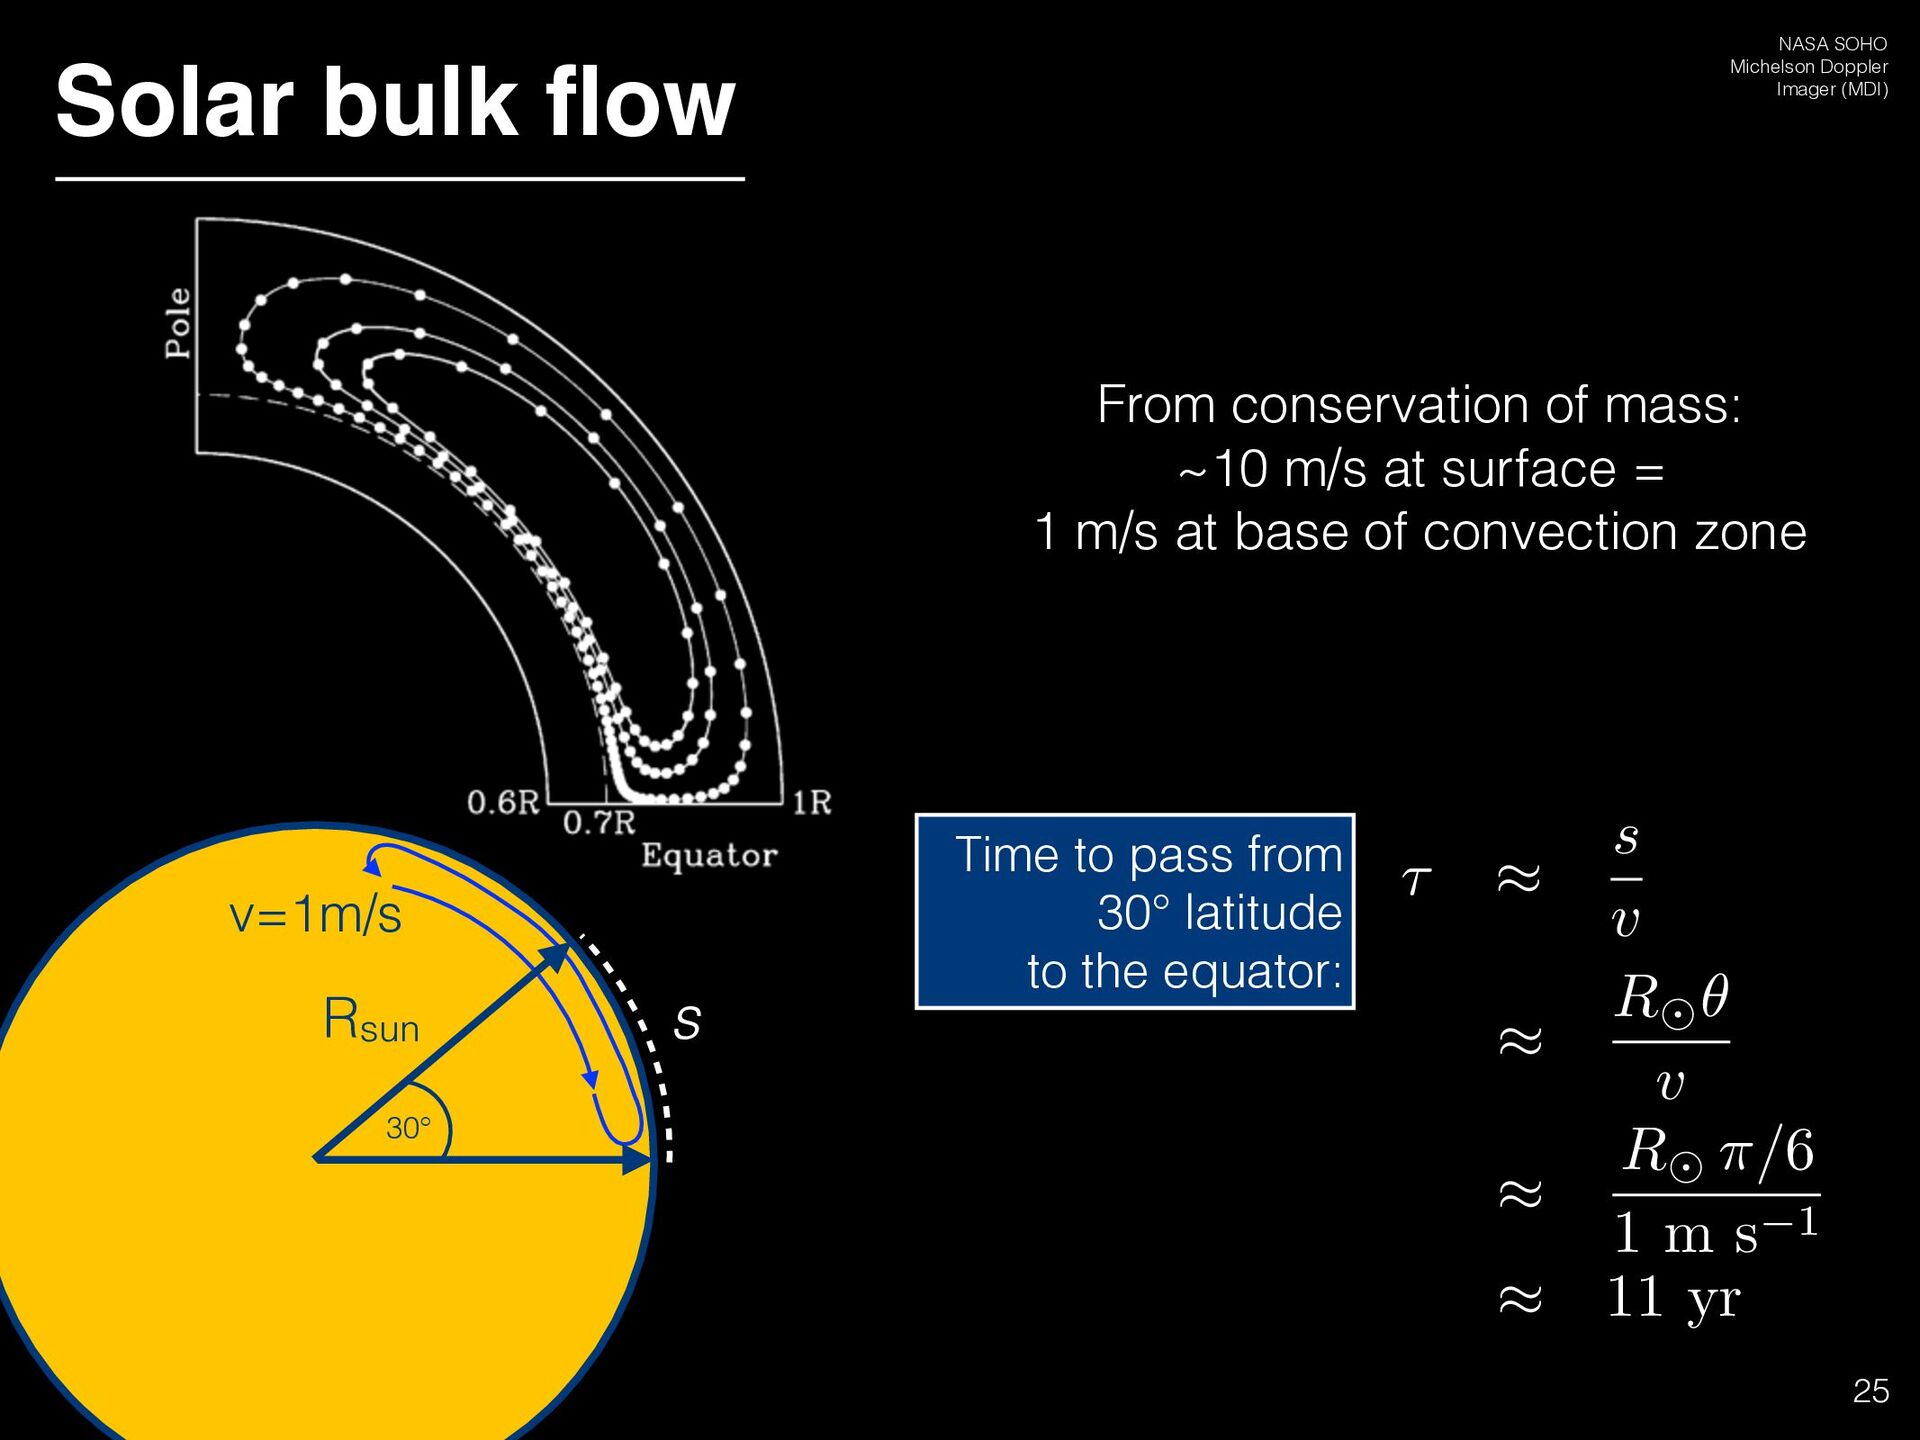
Michelson Doppler Imager (MDI) From conservation of mass: ~10 m/s at surface = 1 m/s at base of convection zone Time to pass from 30° latitude to the equator: ⌧ ⇡ s v ⇡ R ✓ v ⇡ R ⇡/6 1 m s 1 ⇡ 11 yr
Michelson Doppler Imager (MDI) From conservation of mass: ~10 m/s at surface = 1 m/s at base of convection zone Time to pass from 30° latitude to the equator: ⌧ ⇡ s v ⇡ R ✓ v ⇡ R ⇡/6 1 m s 1 ⇡ 11 yr ⌧ ⇡ s v ⇡ R ✓ v ⇡ R ⇡/6 1 m s 1 ⇡ 11 yr
Michelson Doppler Imager (MDI) From conservation of mass: ~10 m/s at surface = 1 m/s at base of convection zone Time to pass from 30° latitude to the equator: ⌧ ⇡ s v ⇡ R ✓ v ⇡ R ⇡/6 1 m s 1 ⇡ 11 yr ⌧ ⇡ s v ⇡ R ✓ v ⇡ R ⇡/6 1 m s 1 ⇡ 11 yr
![NASA/SDO 4 Solar Cycle: Active latitudes Spot latitude [deg] Howard](https://files.speakerdeck.com/presentations/37880773851b42d5a8211a471a883f67/slide_7.jpg)
![Spot latitude [deg] Years Howard et al. (1984), Morris et](https://files.speakerdeck.com/presentations/37880773851b42d5a8211a471a883f67/slide_8.jpg)
![Spot latitude [deg] Years Howard et al. (1984), Morris et](https://files.speakerdeck.com/presentations/37880773851b42d5a8211a471a883f67/slide_9.jpg)
![Spot latitude [deg] Years Howard et al. (1984), Morris et](https://files.speakerdeck.com/presentations/37880773851b42d5a8211a471a883f67/slide_10.jpg)
![Spot latitude [deg] Years Howard et al. (1984), Morris et](https://files.speakerdeck.com/presentations/37880773851b42d5a8211a471a883f67/slide_11.jpg)
![Spot latitude [deg] Years Howard et al. (1984), Morris et](https://files.speakerdeck.com/presentations/37880773851b42d5a8211a471a883f67/slide_12.jpg)
![Spot latitude [deg] Years Howard et al. (1984), Morris et](https://files.speakerdeck.com/presentations/37880773851b42d5a8211a471a883f67/slide_13.jpg)
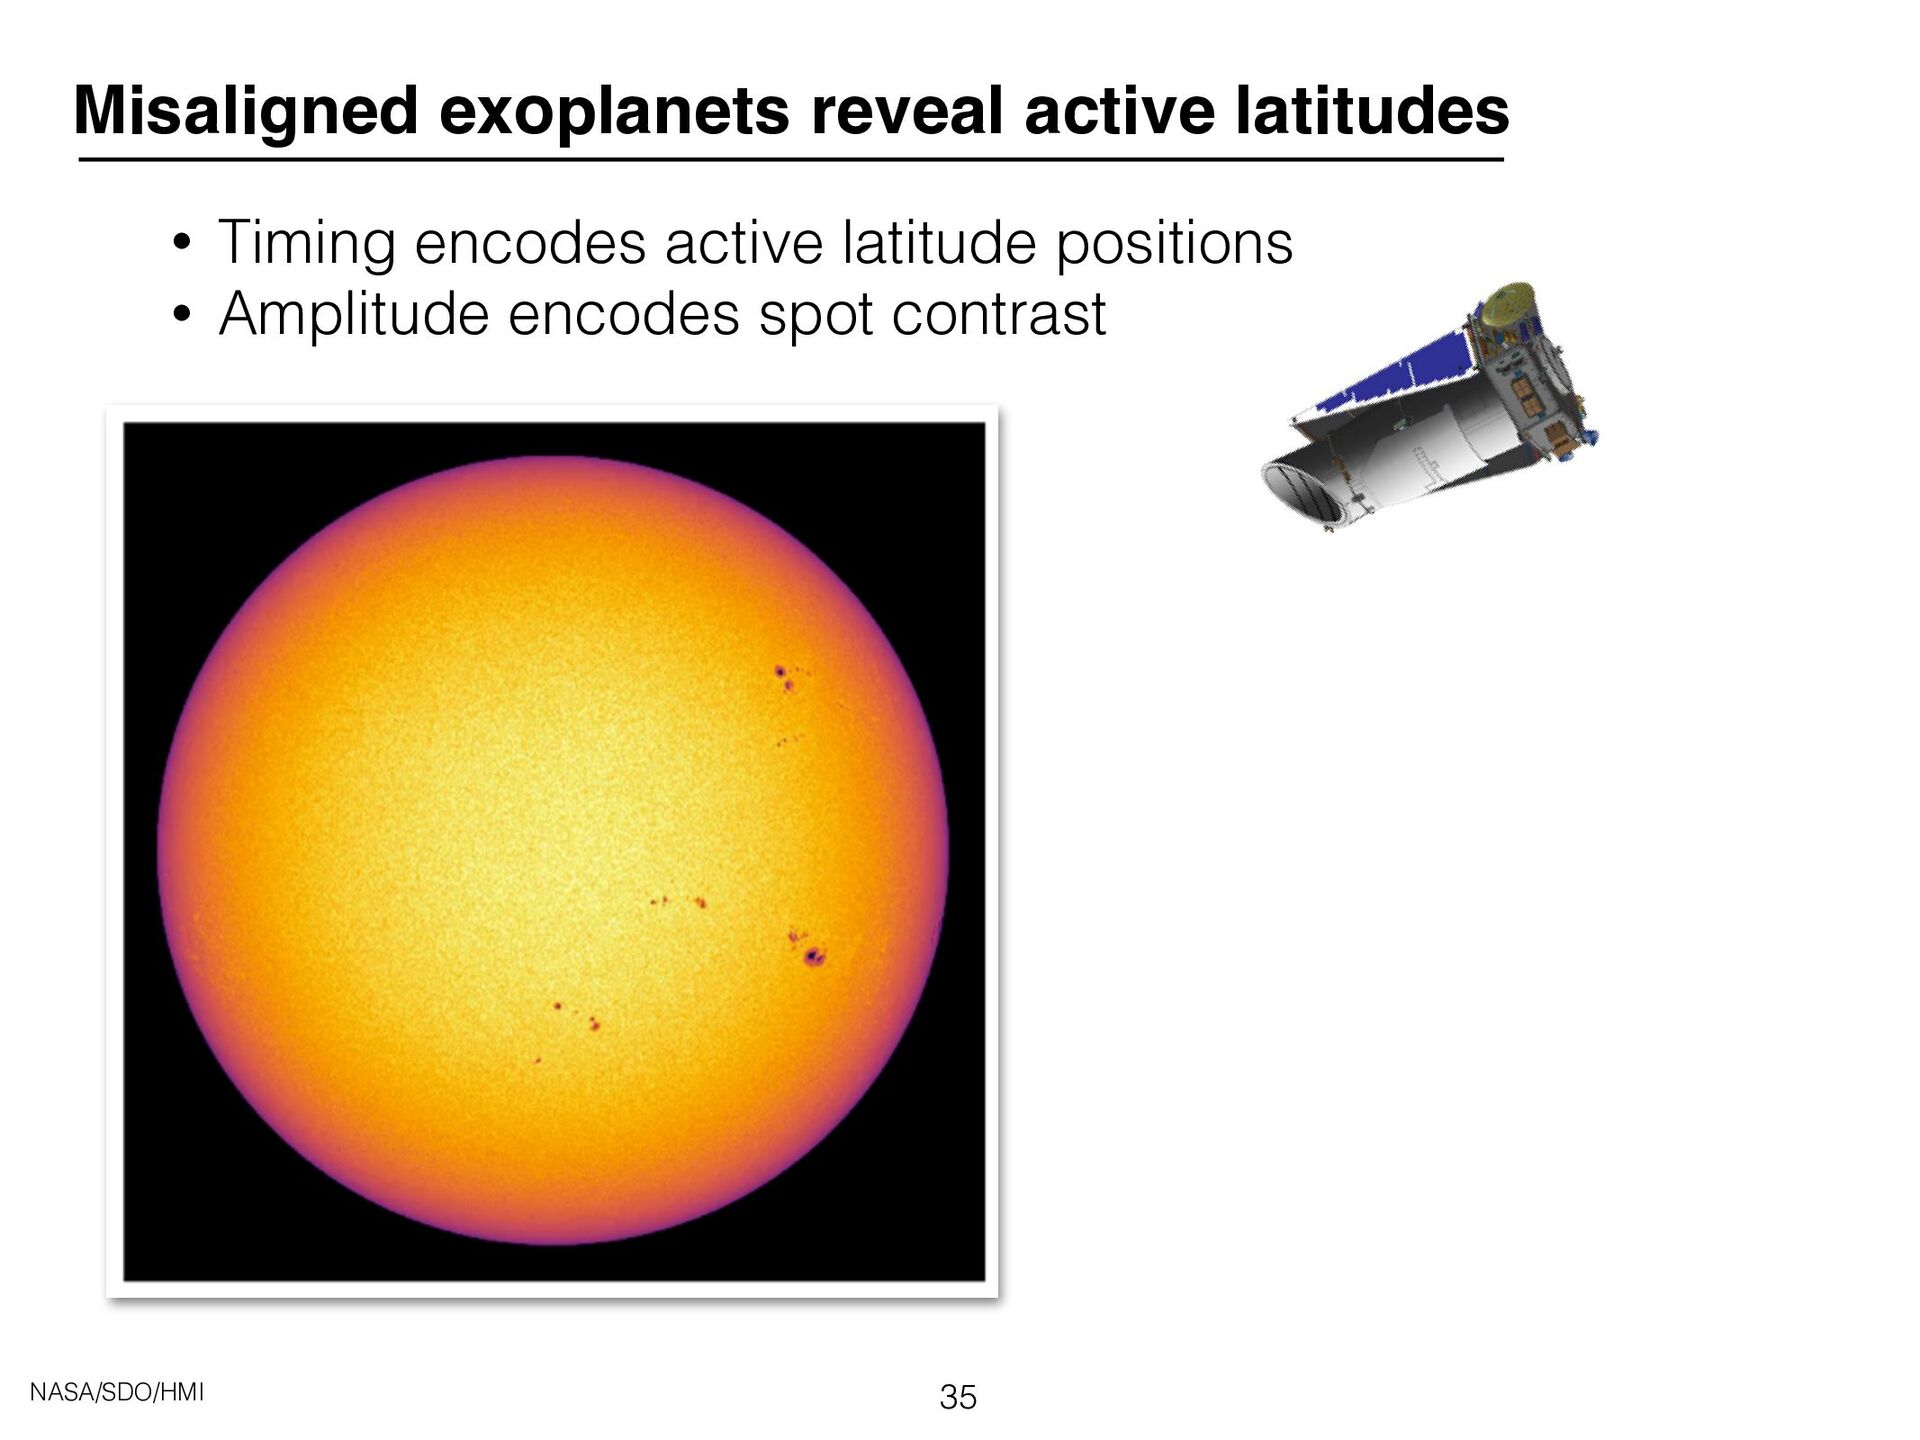
![Spot latitude [deg] Years Howard et al. (1984), Morris et](https://files.speakerdeck.com/presentations/37880773851b42d5a8211a471a883f67/slide_35.jpg)
![22 r/R ⌦/2⇡ [nHz] Rotation Frequency Radiative Convective Howe et](https://files.speakerdeck.com/presentations/37880773851b42d5a8211a471a883f67/slide_46.jpg)
![22 r/R ⌦/2⇡ [nHz] Rotation Frequency Radiative Convective Howe et](https://files.speakerdeck.com/presentations/37880773851b42d5a8211a471a883f67/slide_47.jpg)
![22 r/R ⌦/2⇡ [nHz] Rotation Frequency Radiative Convective Howe et](https://files.speakerdeck.com/presentations/37880773851b42d5a8211a471a883f67/slide_48.jpg)