Upgrade to Pro
— share decks privately, control downloads, hide ads and more …
Speaker Deck
Features
Speaker Deck
PRO
Sign in
Sign up for free
Search
Search
Visibility for web developers
Search
Bruno Renié
May 13, 2014
Technology
480
3
Share
Embed
Copy iframe code
Copy JS code
Copy link
Start on current slide
Visibility for web developers
Bruno Renié
May 13, 2014
More Decks by Bruno Renié
See All by Bruno Renié
Decentralization & real-time with PubSubHubbub
brutasse
1
190
Deployability of Python Web Applications
brutasse
17
2.4k
Stop writing settings files
brutasse
21
2.6k
Class-based Views: patterns and anti-patterns
brutasse
9
1.7k
Packager son projet Django
brutasse
4
590
Staticfiles : tout ce qu'il faut savoir, rien que ce qu'il faut savoir
brutasse
4
590
Introduction to Django
brutasse
3
460
Other Decks in Technology
See All in Technology
新しい SLO が良い感じにハマっている話
z63d
0
120
事業成長とAI活用を止めないデータ基盤アーキテクチャの設計思想
hiracky16
0
770
なぜ、あなたのAPIは使われないのか? AX時代の設計原則、ガードレール、運用体制
yokawasa
1
260
PLaMo 3.0 Primeの構造化出力サポート
pfn
PRO
0
100
PLaMoを毎日の開発で使い育てていく
pfn
PRO
0
100
BigQuery を検索ソースとした AI Agent の作り方って 〇〇 通りあんねん
satohjohn
0
140
A Bag-of-Documents Model for Query Specificity
dtunkelang
0
170
QAと開発の両側から進める AI活用 -QAプロセスAI支援ツールキットと Inner Loop / Outer Loopの取り組み-
legalontechnologies
PRO
2
370
StepFunctionsとGraphRAGを活用した暗黙知活用のためのRAG基盤
yakumo
0
190
Power Automateアップデート情報
miyakemito
0
280
ウォーターフォール開発案件のPMとしてAI活用を模索している話
hatahata021
2
200
テックカンファレンス三大ステークホルダーの文化人類学 ─ 違いを認め合う関係性作り
bash0c7
4
1.1k
Featured
See All Featured
Chasing Engaging Ingredients in Design
codingconduct
0
240
Jamie Indigo - Trashchat’s Guide to Black Boxes: Technical SEO Tactics for LLMs
techseoconnect
PRO
0
540
A brief & incomplete history of UX Design for the World Wide Web: 1989–2019
jct
2
430
JAMstack: Web Apps at Ludicrous Speed - All Things Open 2022
reverentgeek
1
510
How to build a perfect <img>
jonoalderson
1
5.8k
The State of eCommerce SEO: How to Win in Today's Products SERPs - #SEOweek
aleyda
2
11k
Marketing Yourself as an Engineer | Alaka | Gurzu
gurzu
0
270
The browser strikes back
jonoalderson
0
1.4k
Deep Space Network (abreviated)
tonyrice
0
240
SEOcharity - Dark patterns in SEO and UX: How to avoid them and build a more ethical web
sarafernandez
0
230
Building a Modern Day E-commerce SEO Strategy
aleyda
45
9.1k
Agile Leadership in an Agile Organization
kimpetersen
PRO
0
190
Transcript
Visibility for Web Developers Bruno Renié Django Island 2014
Working with ops & support staff Large infrastructure, lots of
moving parts whoami: lead dev @ exoscale
People need to know what's going on, anytime Not everyone
is a developer SSH, grep and tail not acceptable
Goal: visibility on infrastructure & apps
Errors Events Metrics
Errors
Easy: use sentry
Great tool for developers, but… People also need to know
about things that are not broken
Events
Event == log call Timestamped information about something worth knowing
Easy to emit logs Searching on remote machines, not so
much
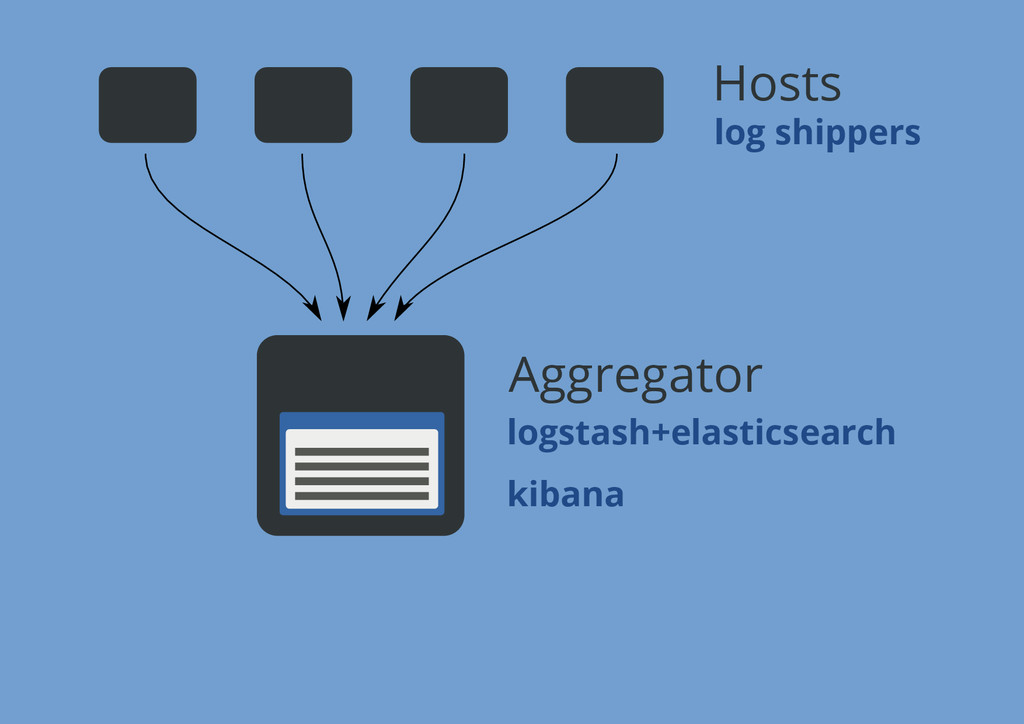
Centralized logging Agent forwards logs to an aggregator Aggregator stores
logs and provides a search interface
Aggregator Hosts logstash+elasticsearch kibana log shippers
Collecting logs rsyslog / syslog-ng logstash-forwarder (lumberjack) logstash
In Python logging.handlers.SyslogHandler
Centralizing isn't enough
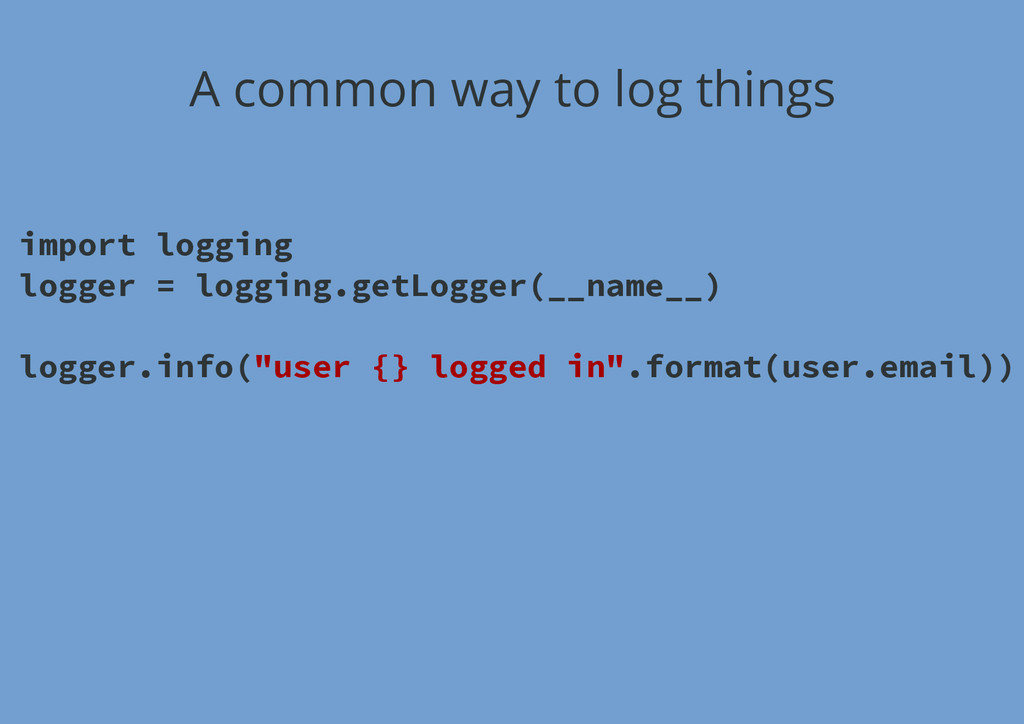
A common way to log things import logging logger =
logging.getLogger(__name__) logger.info("user {} logged in".format(user.email))
Not much information No structure
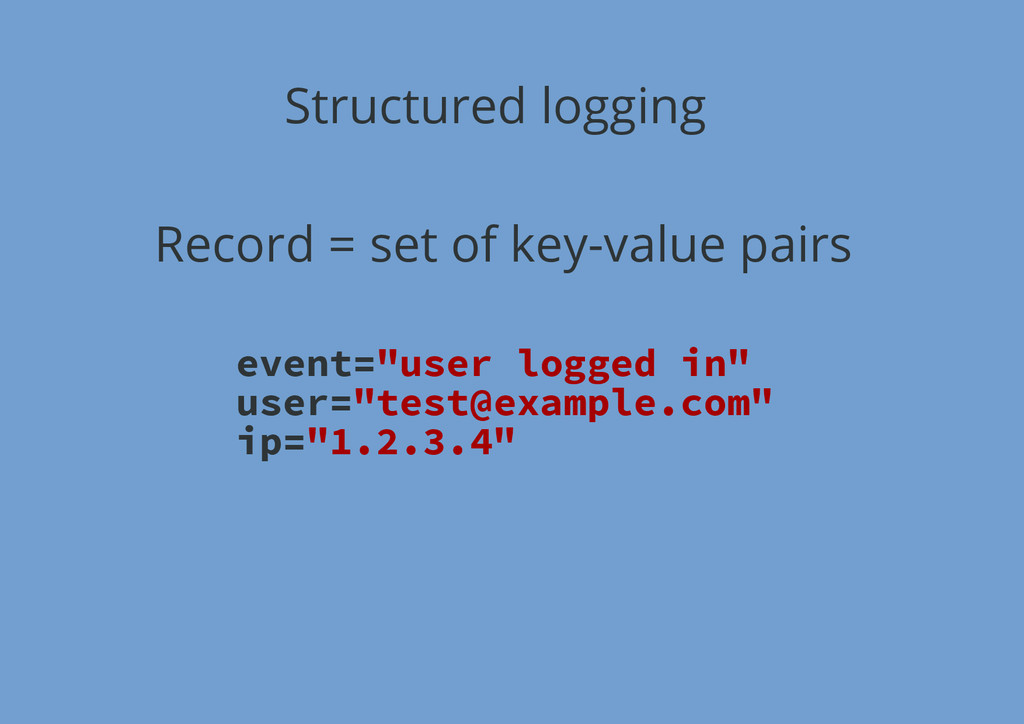
Structured logging Record = set of key-value pairs event="user logged
in" user="
[email protected]
" ip="1.2.3.4"
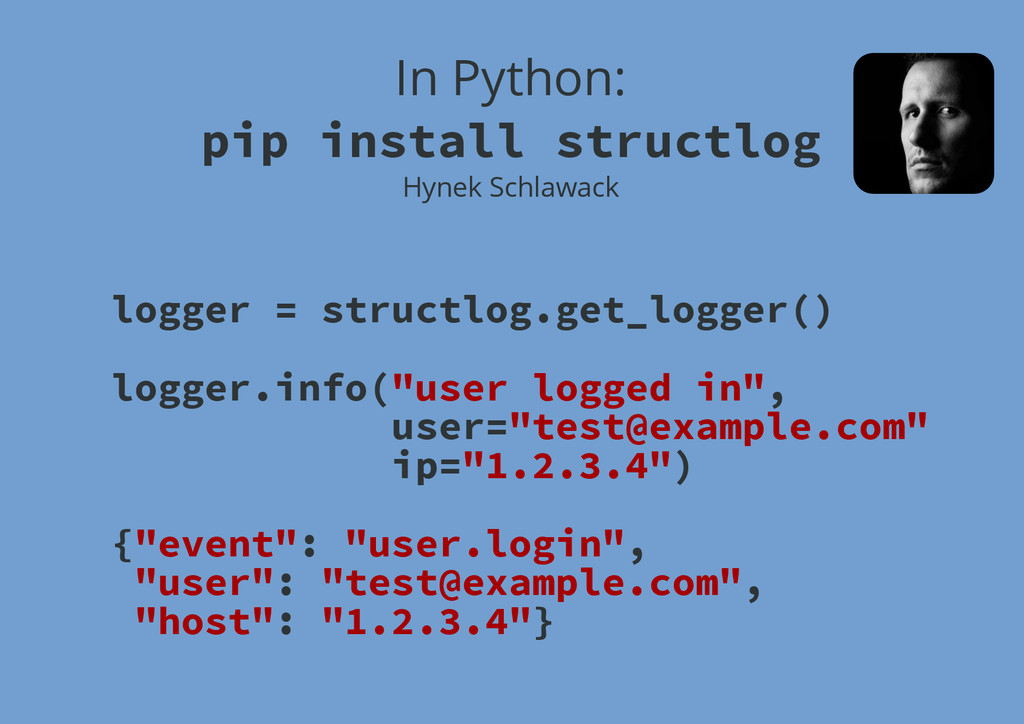
In Python: pip install structlog Hynek Schlawack logger = structlog.get_logger()
logger.info("user logged in", user="
[email protected]
" ip="1.2.3.4") {"event": "user.login", "user": "
[email protected]
", "host": "1.2.3.4"}
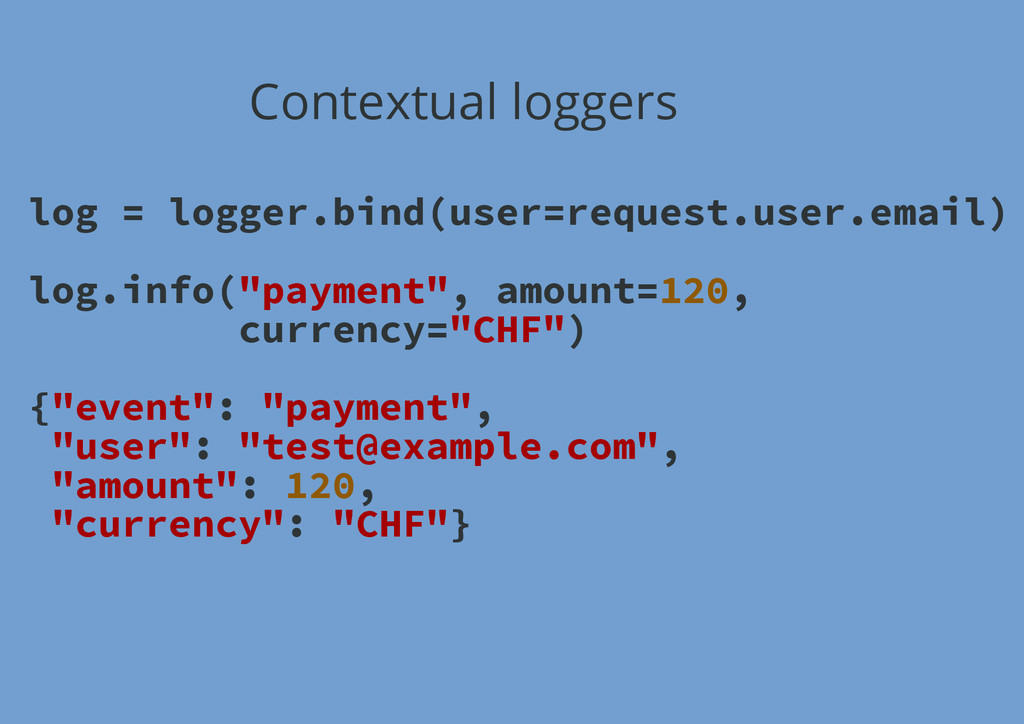
Contextual loggers log = logger.bind(user=request.user.email) log.info("payment", amount=120, currency="CHF") {"event": "payment",
"user": "
[email protected]
", "amount": 120, "currency": "CHF"}
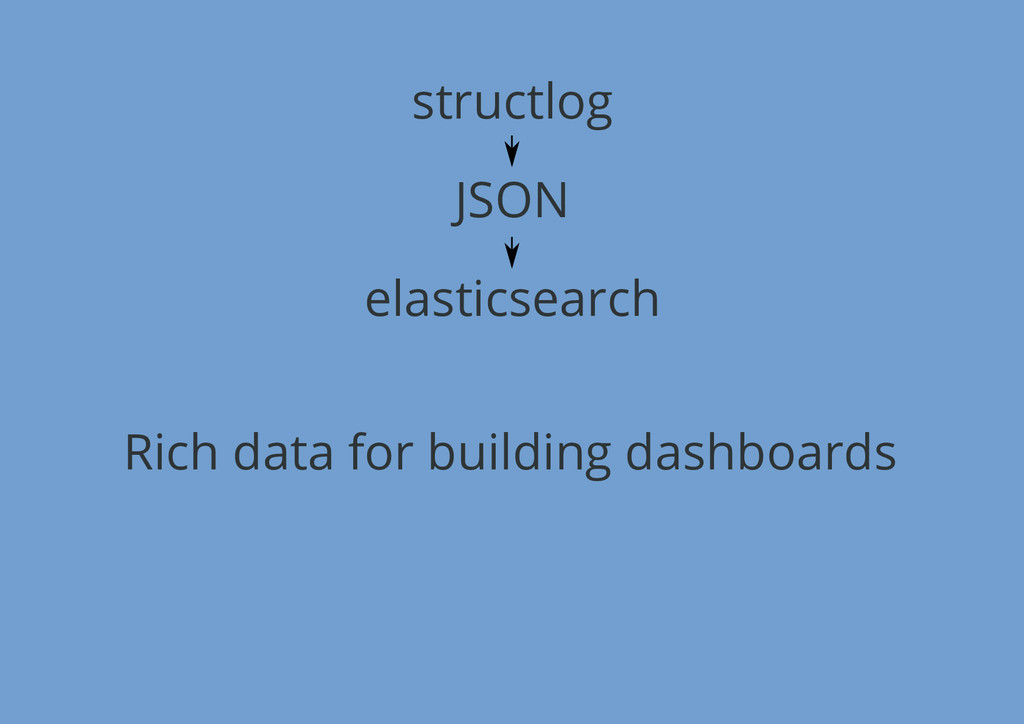
structlog JSON elasticsearch Rich data for building dashboards
Demo
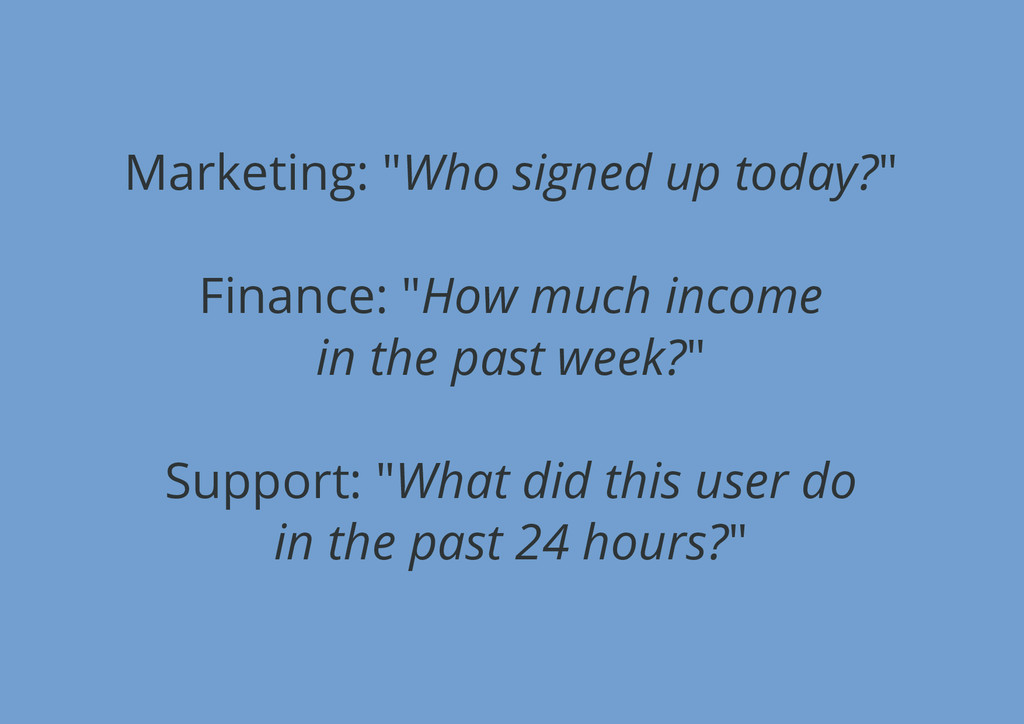
Marketing: "Who signed up today?" Finance: "How much income in
the past week?" Support: "What did this user do in the past 24 hours?"
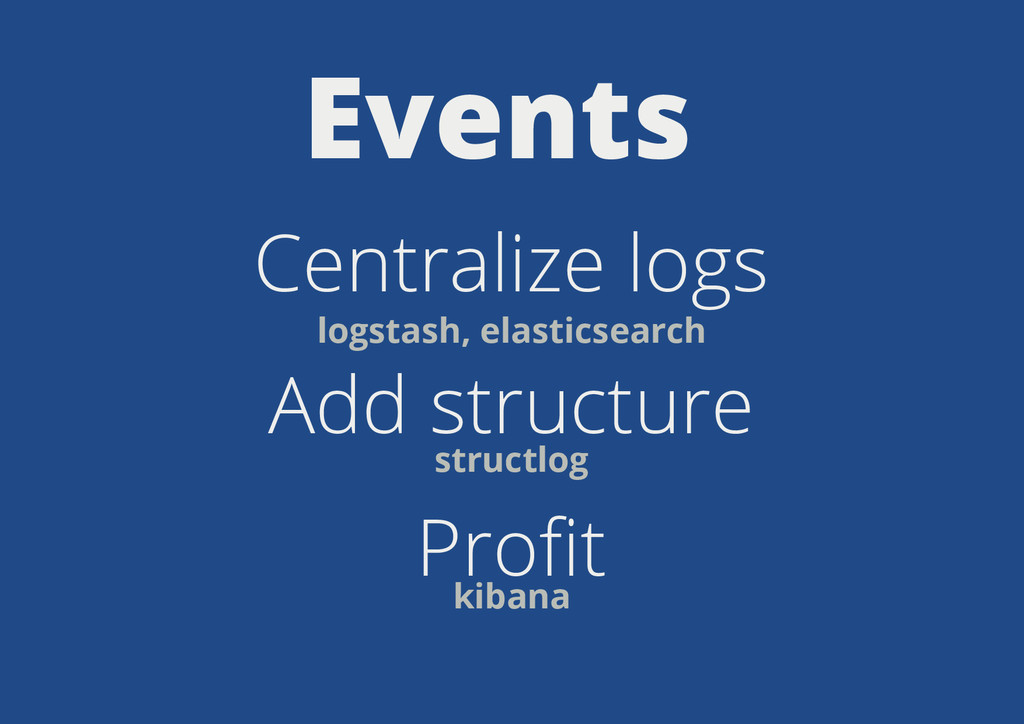
Events Centralize logs Add structure Profit logstash, elasticsearch structlog kibana
Metrics
Time series data Continuous, regular intervals Big player: graphite ecosystem
carbon whisper graphite
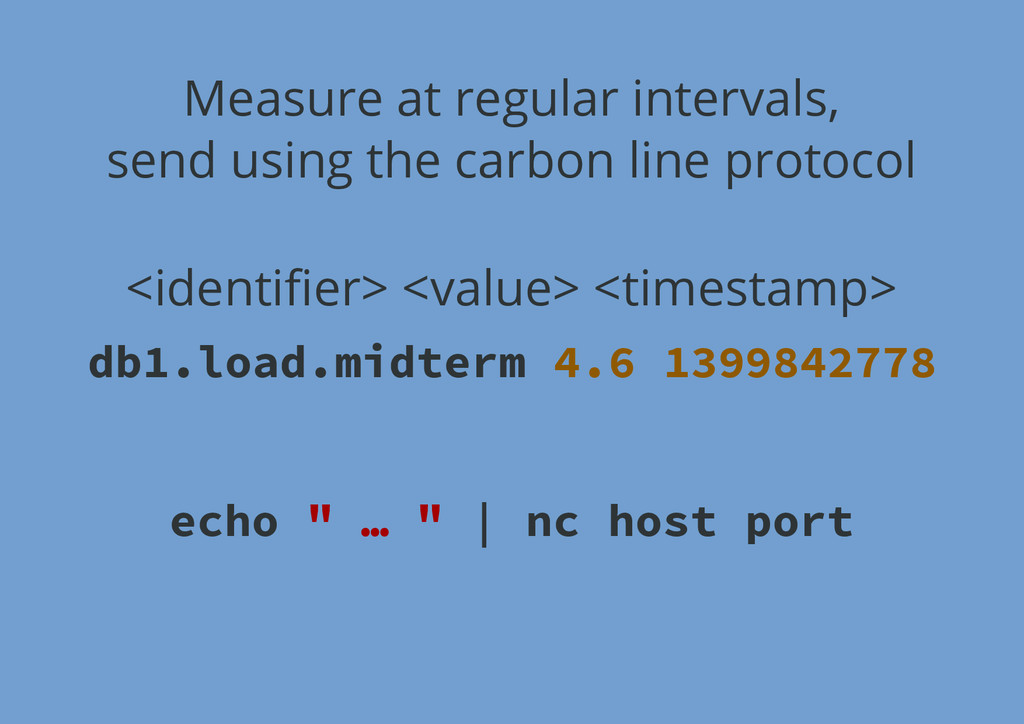
<identifier> <value> <timestamp> db1.load.midterm 4.6 1399842778 Measure at regular intervals,
send using the carbon line protocol echo " … " | nc host port
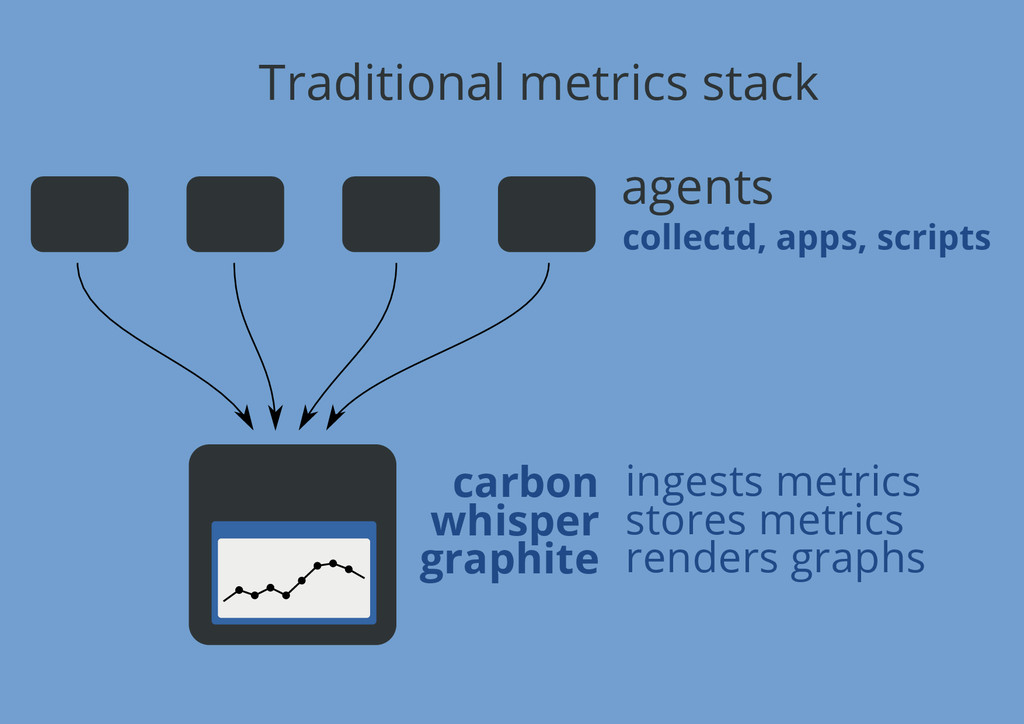
Traditional metrics stack agents collectd, apps, scripts carbon whisper graphite
ingests metrics stores metrics renders graphs
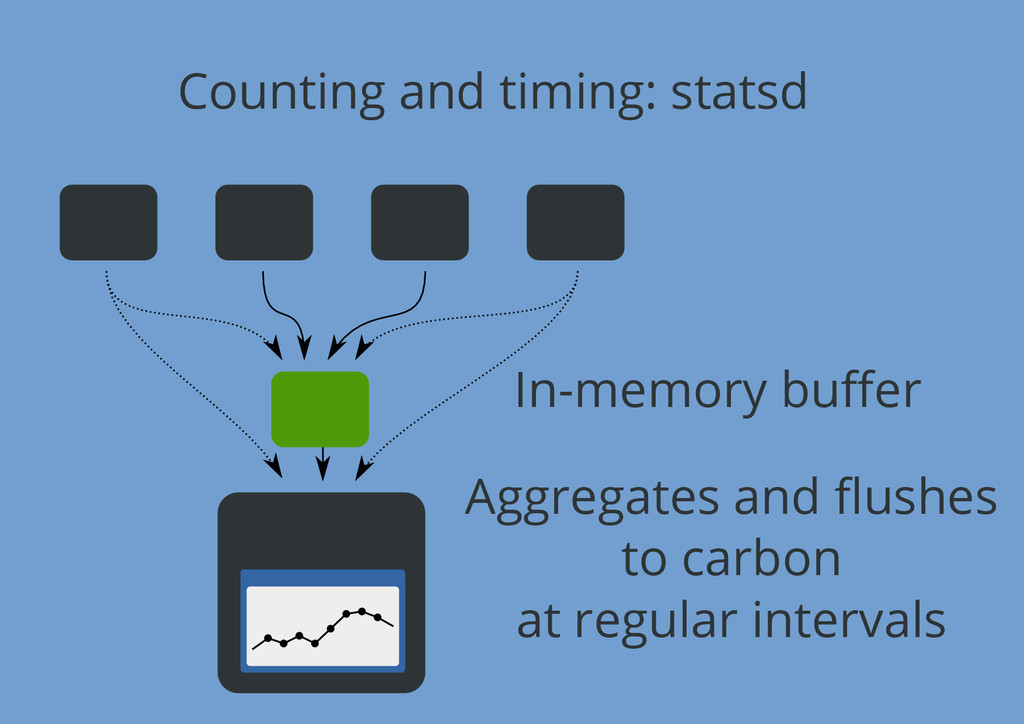
Counting and timing: statsd In-memory buffer Aggregates and flushes to
carbon at regular intervals
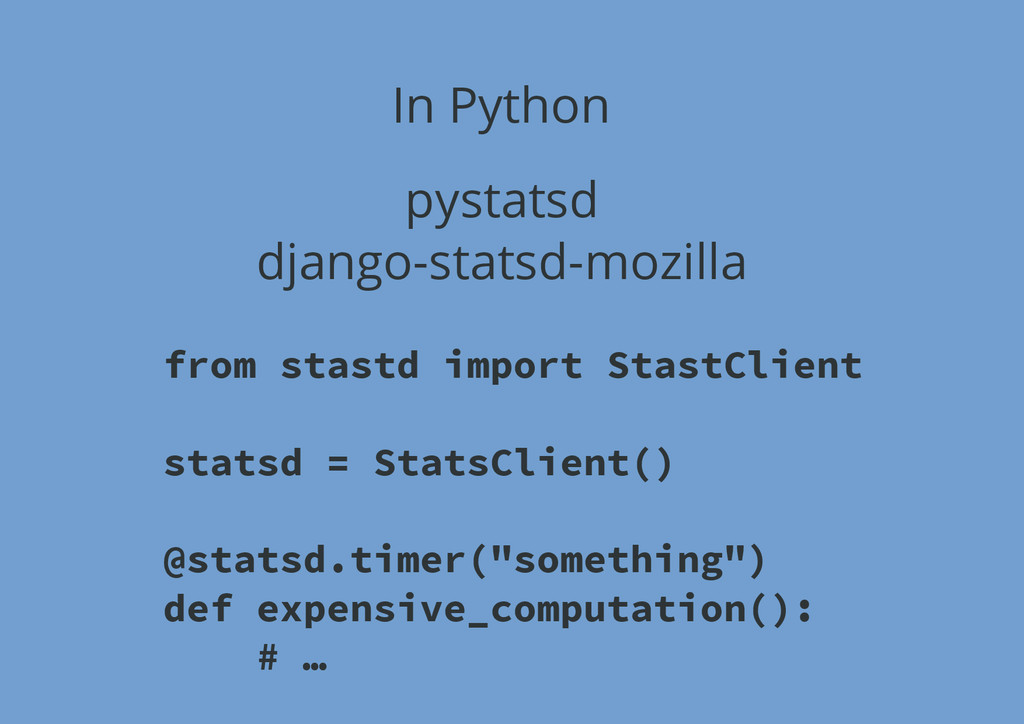
In Python pystatsd django-statsd-mozilla from stastd import StastClient statsd =
StatsClient() @statsd.timer("something") def expensive_computation(): # …
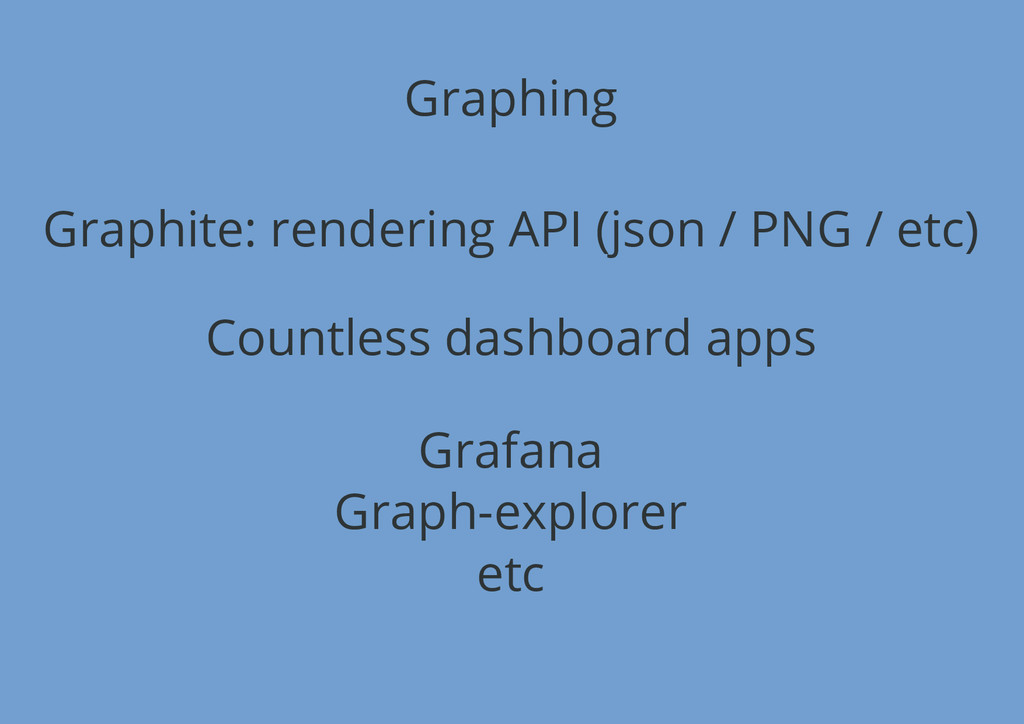
Graphing Graphite: rendering API (json / PNG / etc) Countless
dashboard apps Grafana Graph-explorer etc
Demo
What about alerts? Riemann: metrics hub/proxy App server overloaded, full
disk, etc Analyzes metrics computes aggregates notifies
Demo
we are hiring! Questions! @brutasse Image credits: http://en.wikipedia.org/wiki/Explosion
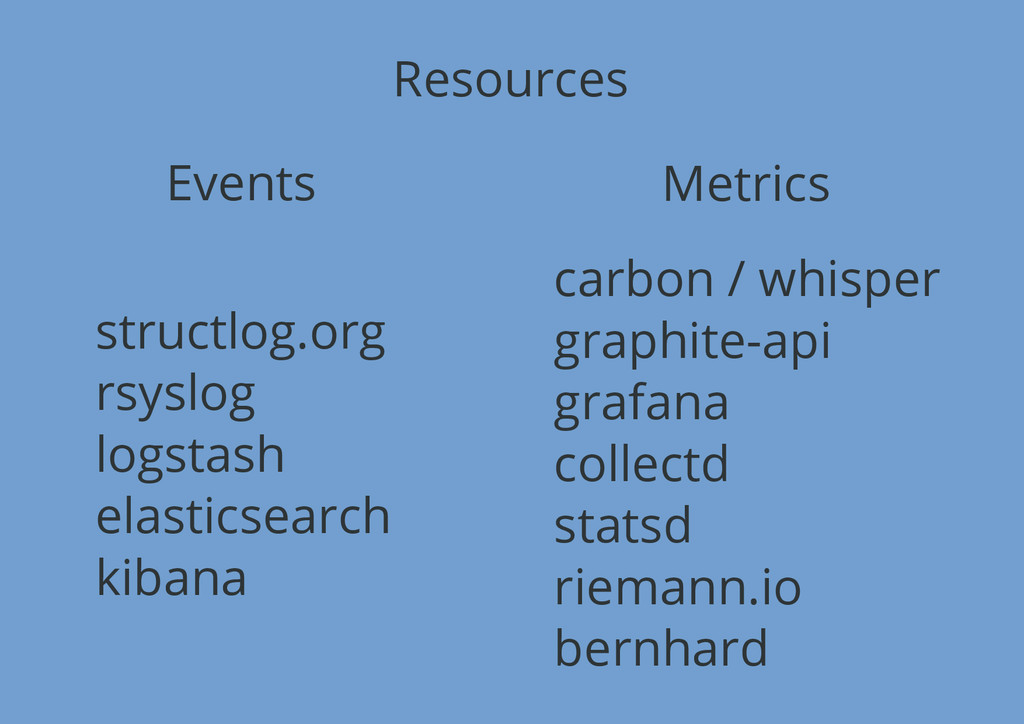
Resources Events Metrics structlog.org rsyslog logstash elasticsearch kibana carbon /
whisper graphite-api grafana collectd statsd riemann.io bernhard
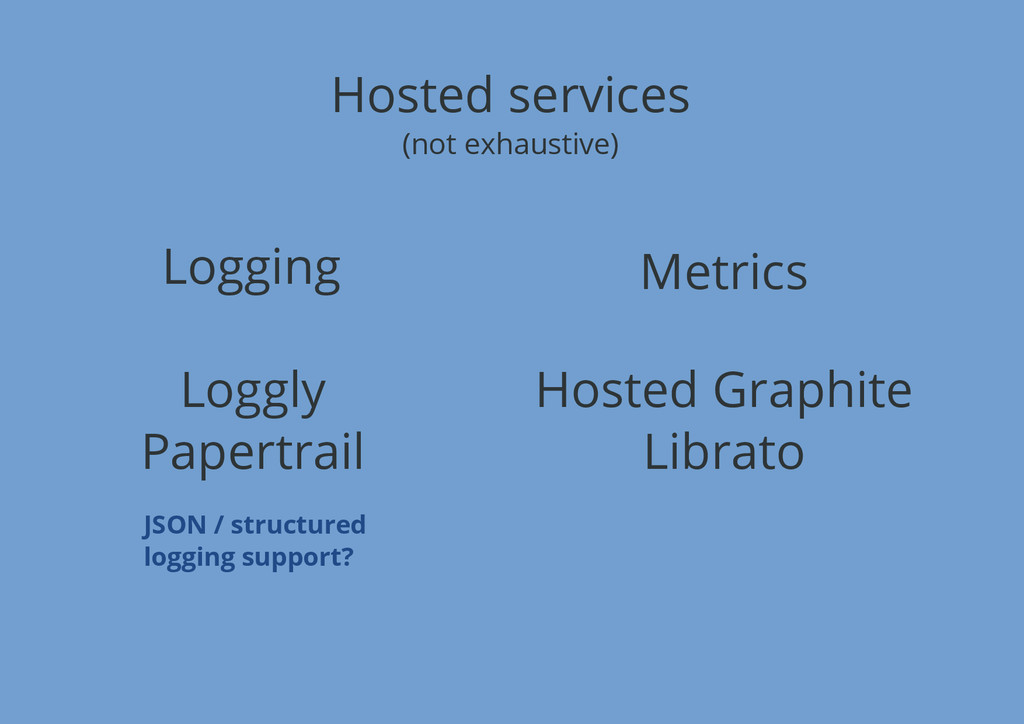
Hosted services (not exhaustive) Logging Metrics Loggly Papertrail Hosted Graphite
Librato JSON / structured logging support?