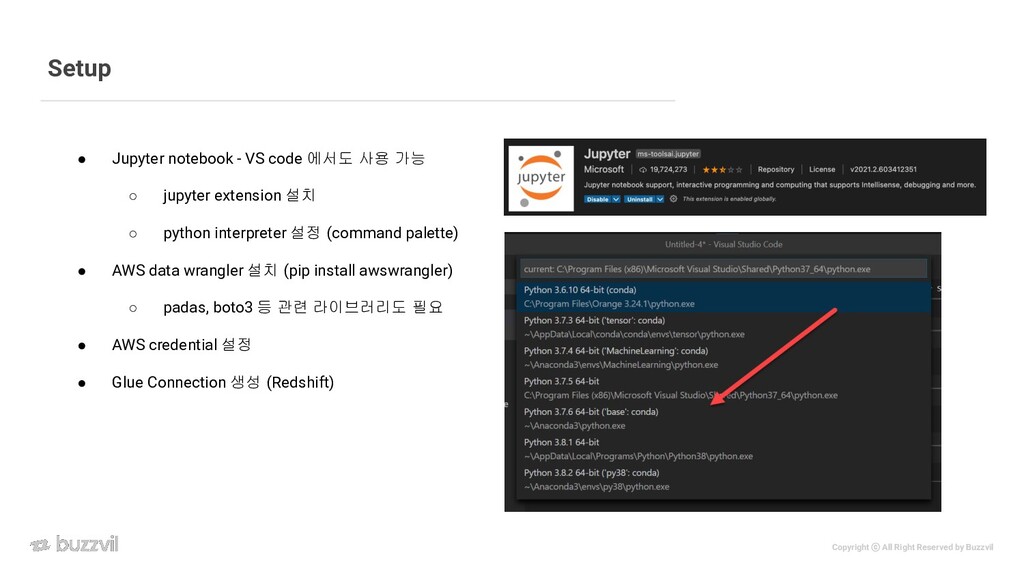
notebook - VS code 에서도 사용 가능 ◦ jupyter extension 설치 ◦ python interpreter 설정 (command palette) • AWS data wrangler 설치 (pip install awswrangler) ◦ padas, boto3 등 관련 라이브러리도 필요 • AWS credential 설정 • Glue Connection 생성 (Redshift)
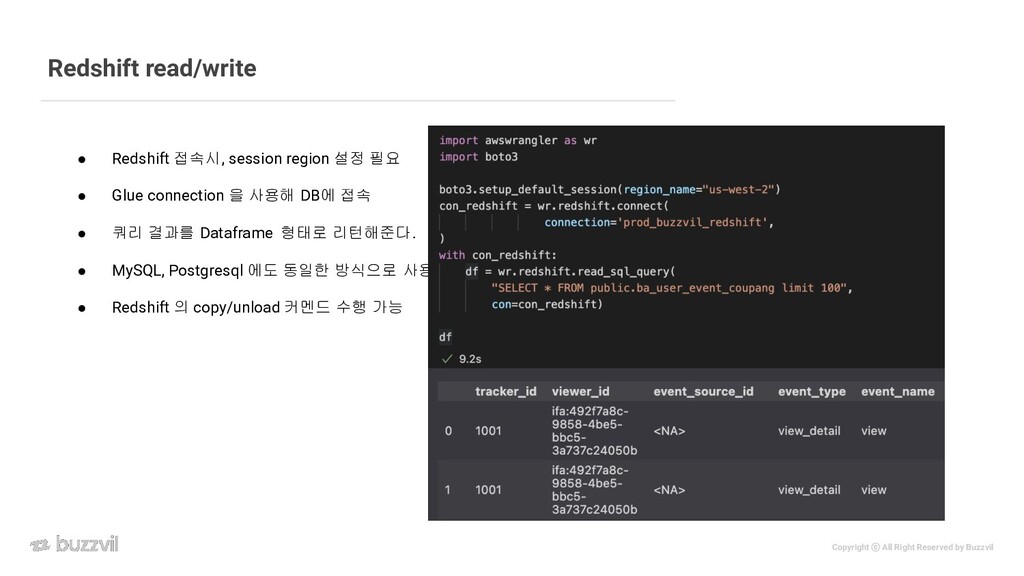
Redshift 접속시, session region 설정 필요 • Glue connection 을 사용해 DB에 접속 • 쿼리 결과를 Dataframe 형태로 리턴해준다. • MySQL, Postgresql 에도 동일한 방식으로 사용 • Redshift 의 copy/unload 커멘드 수행 가능
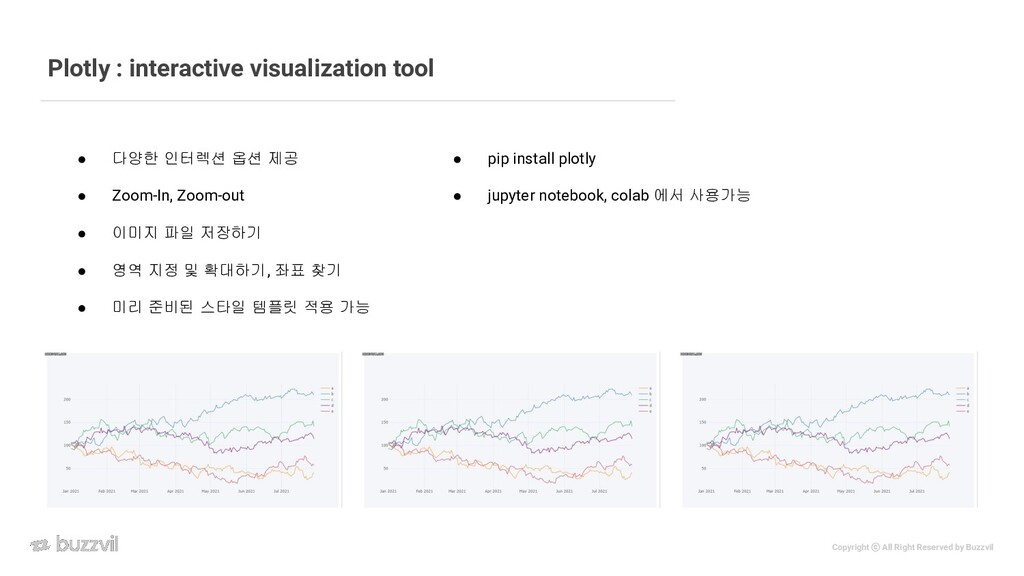
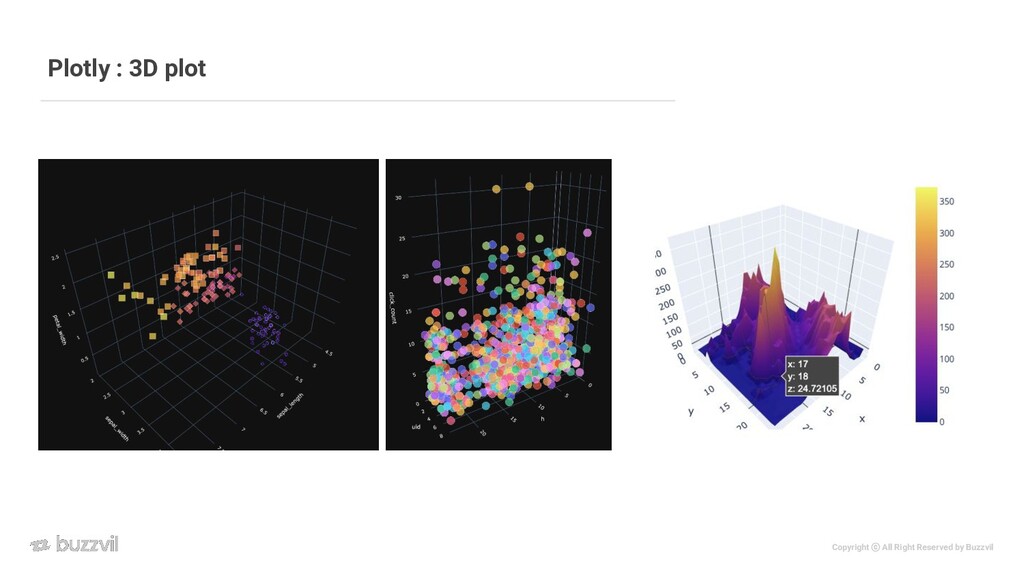
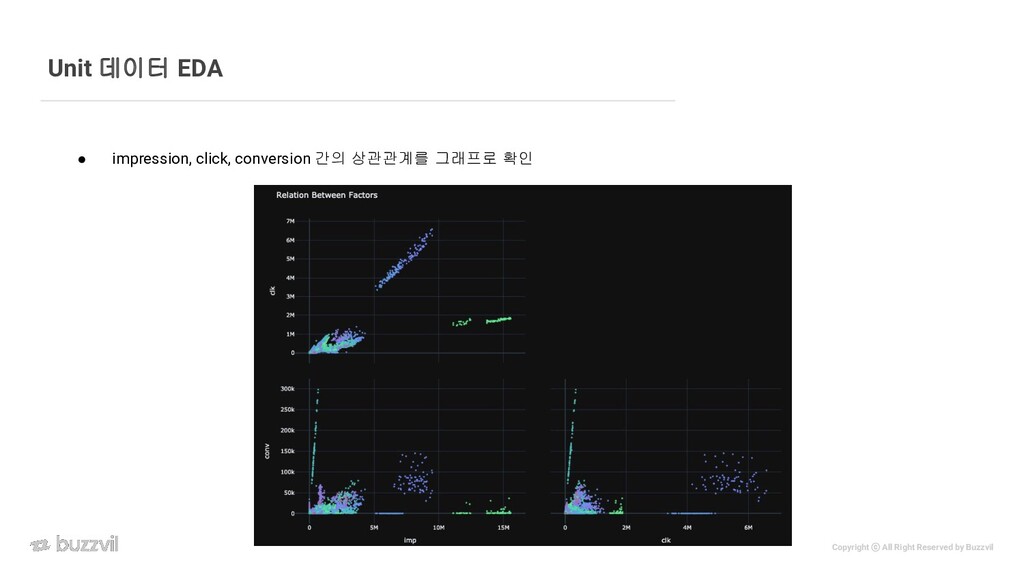
visualization tool • 다양한 인터렉션 옵션 제공 • Zoom-In, Zoom-out • 이미지 파일 저장하기 • 영역 지정 및 확대하기, 좌표 찾기 • 미리 준비된 스타일 템플릿 적용 가능 • pip install plotly • jupyter notebook, colab 에서 사용가능
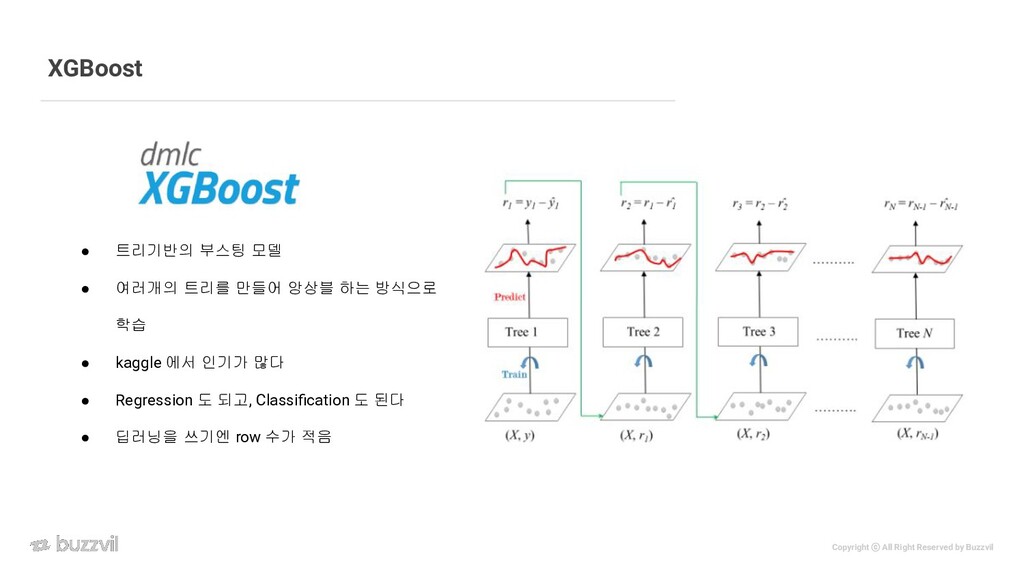
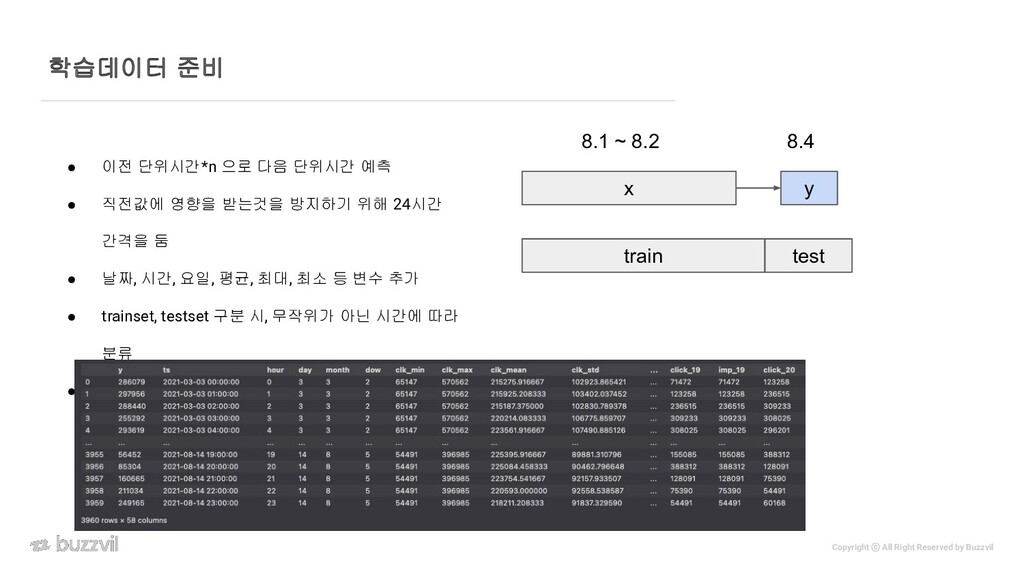
이전 단위시간*n 으로 다음 단위시간 예측 • 직전값에 영향을 받는것을 방지하기 위해 24시간 간격을 둠 • 날짜, 시간, 요일, 평균, 최대, 최소 등 변수 추가 • trainset, testset 구분 시, 무작위가 아닌 시간에 따라 분류 • 3960 * 58 의 늠름한 데이터셋 x y 8.4 8.1 ~ 8.2 train test
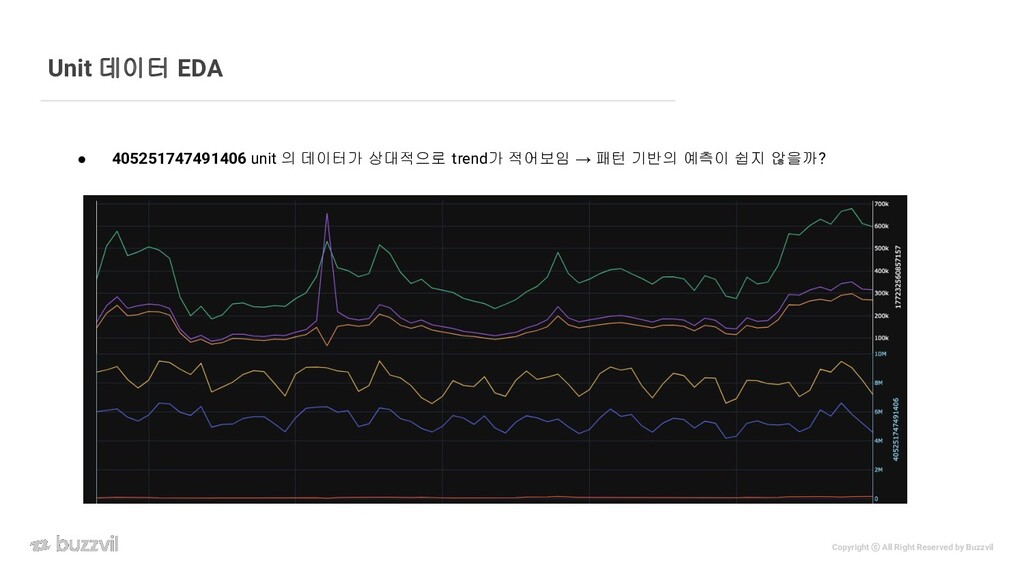
데이터를 보는 대회들과 다르게, 들여다 봐야할 데이터가 많다 • 다양한 디멘션으로 고려해야할 사항들이 많다 → 패턴을 찾는 것이 쉽지 않음 • EDA를 할때마다 고구마 줄기처럼 나오는 질문들 • 도메인 지식과 데이터 지식이 둘다 필요하다 • Digging은 언제나 즐겁다