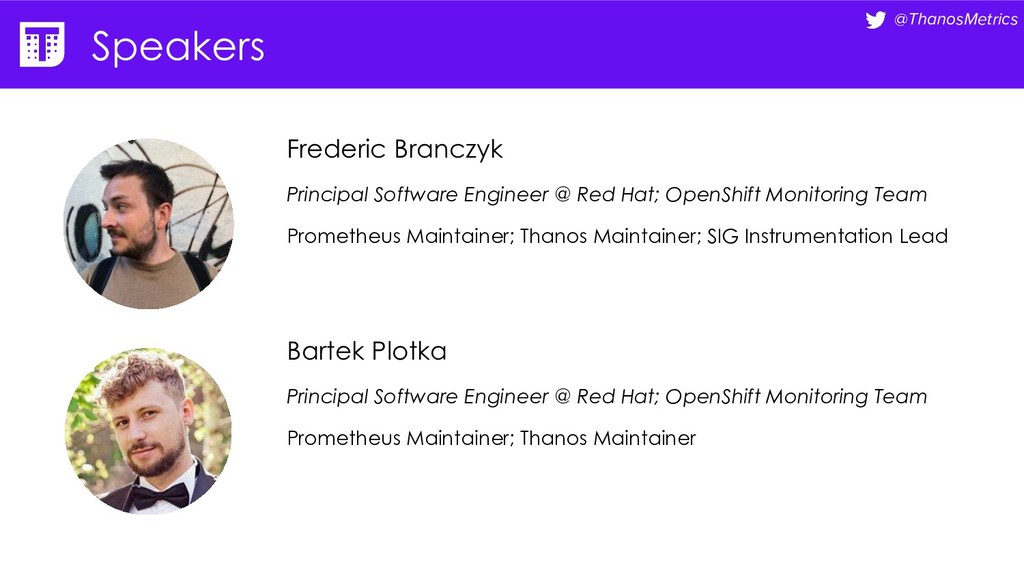
OpenShift Monitoring Team Prometheus Maintainer; Thanos Maintainer; SIG Instrumentation Lead Bartek Plotka Principal Software Engineer @ Red Hat; OpenShift Monitoring Team Prometheus Maintainer; Thanos Maintainer
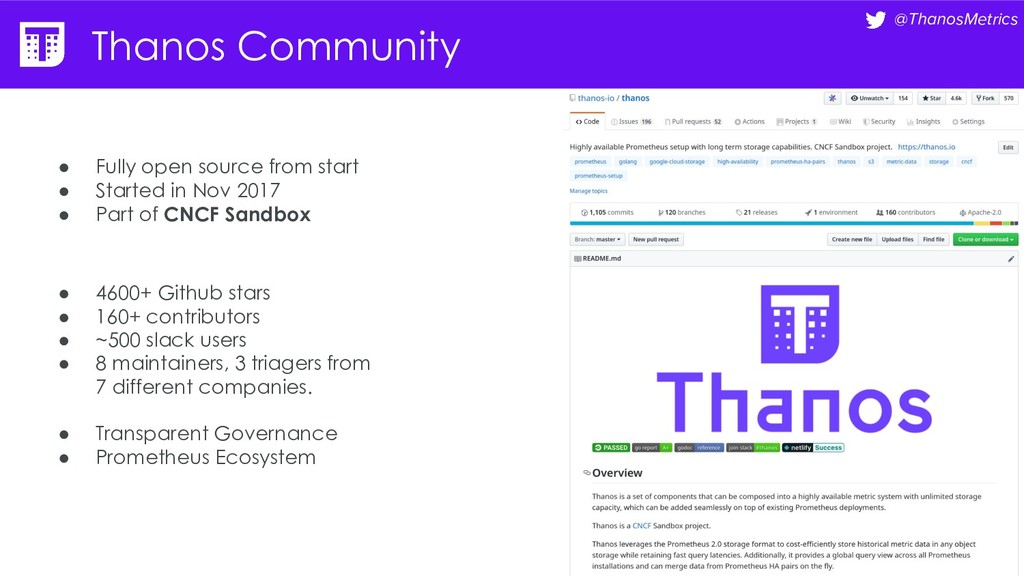
Started in Nov 2017 • Part of CNCF Sandbox • 4600+ Github stars • 160+ contributors • ~500 slack users • 8 maintainers, 3 triagers from 7 different companies. • Transparent Governance • Prometheus Ecosystem
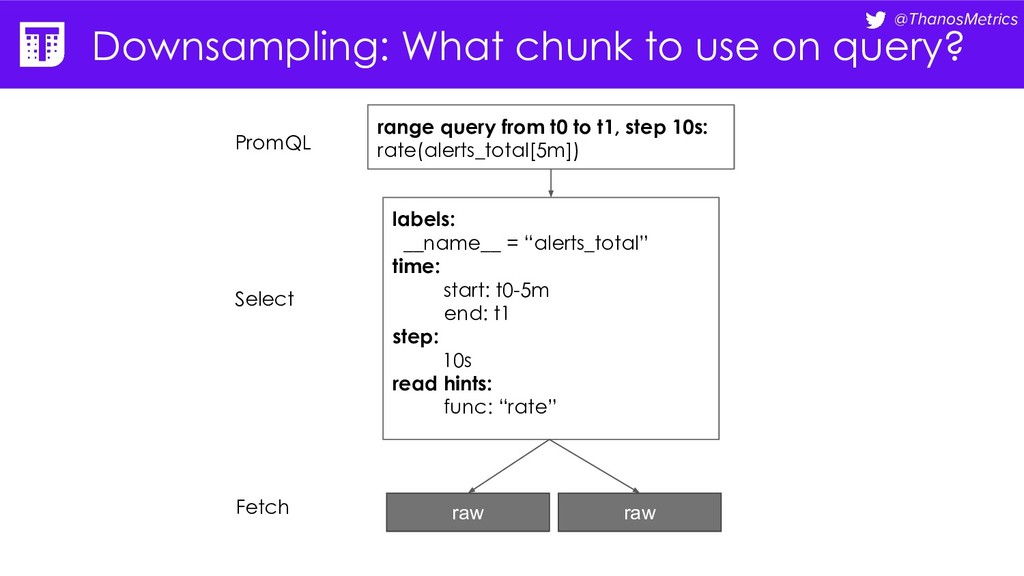
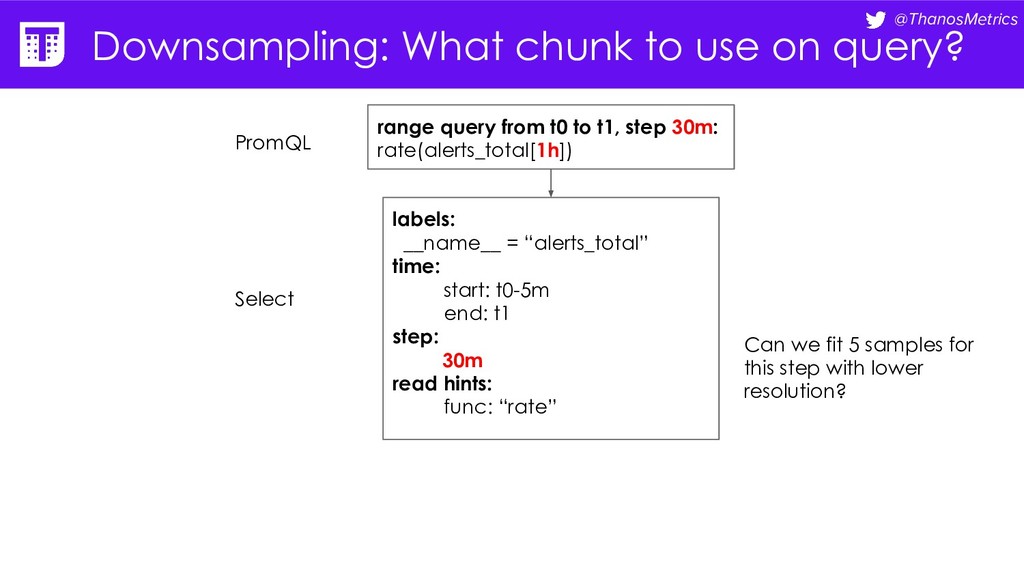
= “alerts_total” time: start: t0-5m end: t1 step: 30m read hints: func: “rate” range query from t0 to t1, step 30m: rate(alerts_total[1h]) PromQL Select Can we fit 5 samples for this step with lower resolution?
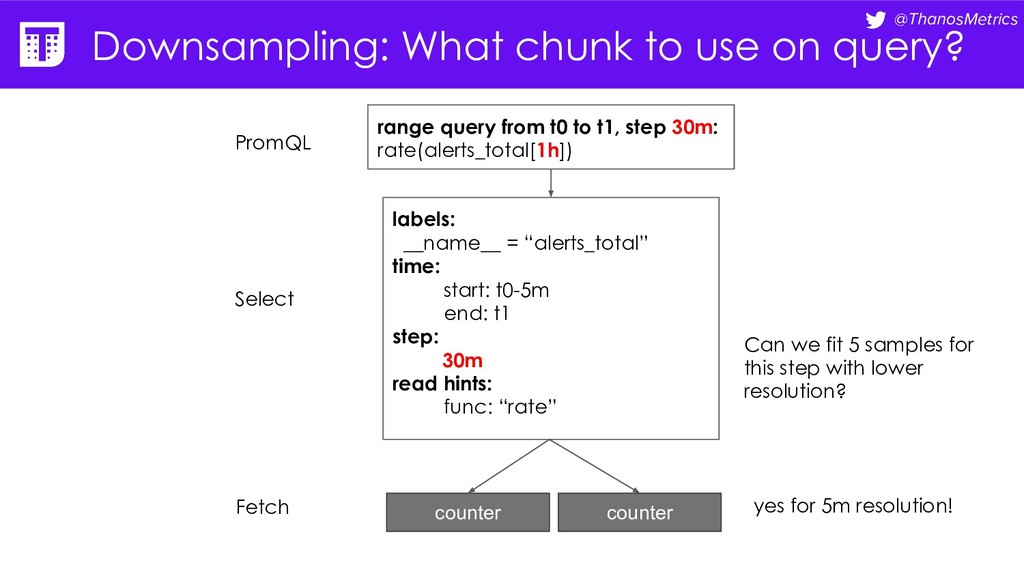
= “alerts_total” time: start: t0-5m end: t1 step: 30m read hints: func: “rate” range query from t0 to t1, step 30m: rate(alerts_total[1h]) PromQL Select Fetch counter counter Fetch Can we fit 5 samples for this step with lower resolution? yes for 5m resolution!
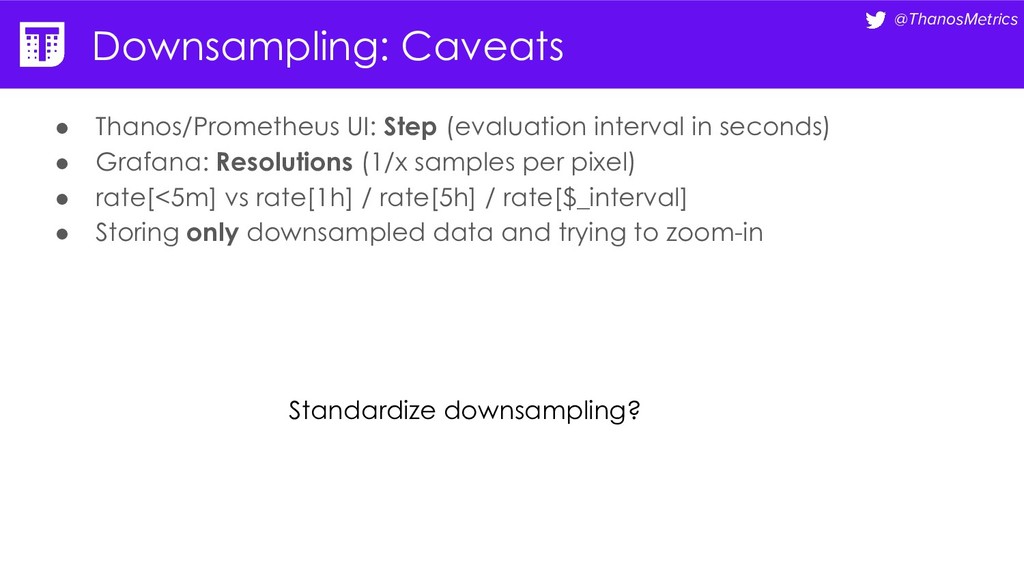
seconds) • Grafana: Resolutions (1/x samples per pixel) • rate[<5m] vs rate[1h] / rate[5h] / rate[$_interval] • Storing only downsampled data and trying to zoom-in
seconds) • Grafana: Resolutions (1/x samples per pixel) • rate[<5m] vs rate[1h] / rate[5h] / rate[$_interval] • Storing only downsampled data and trying to zoom-in Standardize downsampling?
![@ThanosMetrics Downsampling count sum min max counter count(requests_total) count_over_time(requests_total[1h])](https://files.speakerdeck.com/presentations/66a104942f58419ba5c1d46c777435a3/slide_32.jpg)
![@ThanosMetrics Downsampling count sum min max counter sum_over_time(requests_total[1h])](https://files.speakerdeck.com/presentations/66a104942f58419ba5c1d46c777435a3/slide_33.jpg)
![@ThanosMetrics Downsampling count sum min max counter min(requests_total) min_over_time(requests_total[1h])](https://files.speakerdeck.com/presentations/66a104942f58419ba5c1d46c777435a3/slide_34.jpg)
![@ThanosMetrics Downsampling count sum min max counter max(requests_total) max_over_time(requests_total[1h])](https://files.speakerdeck.com/presentations/66a104942f58419ba5c1d46c777435a3/slide_35.jpg)
![@ThanosMetrics Downsampling count sum min max counter rate(requests_total[1h]) increase(requests_total[1h])](https://files.speakerdeck.com/presentations/66a104942f58419ba5c1d46c777435a3/slide_36.jpg)