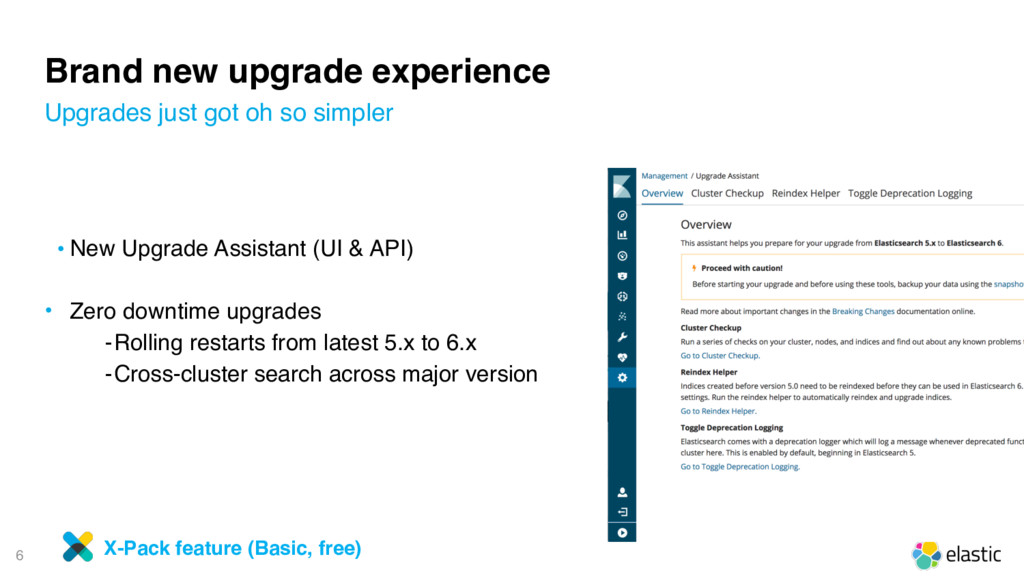
& API) • Zero downtime upgrades ‒Rolling restarts from latest 5.x to 6.x ‒Cross-cluster search across major version Upgrades just got oh so simpler X-Pack feature (Basic, free)
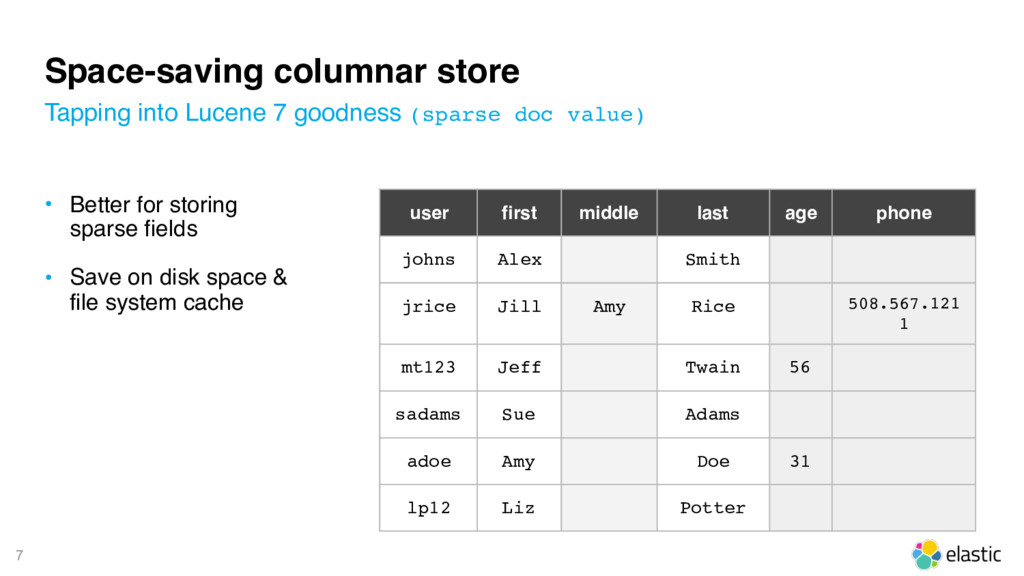
• Save on disk space & file system cache Tapping into Lucene 7 goodness (sparse doc value) user first middle last age phone johns Alex Smith jrice Jill Amy Rice 508.567.121 1 mt123 Jeff Twain 56 sadams Sue Adams adoe Amy Doe 31 lp12 Liz Potter
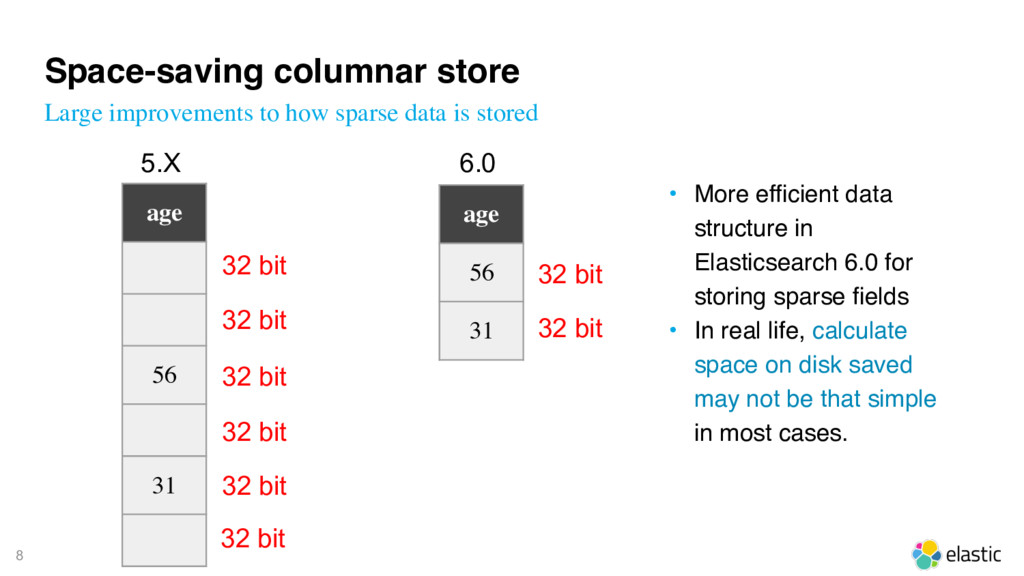
bit 32 bit 32 bit 32 bit age 56 31 6.0 32 bit 32 bit Space-saving columnar store Large improvements to how sparse data is stored • More efficient data structure in Elasticsearch 6.0 for storing sparse fields • In real life, calculate space on disk saved may not be that simple in most cases.
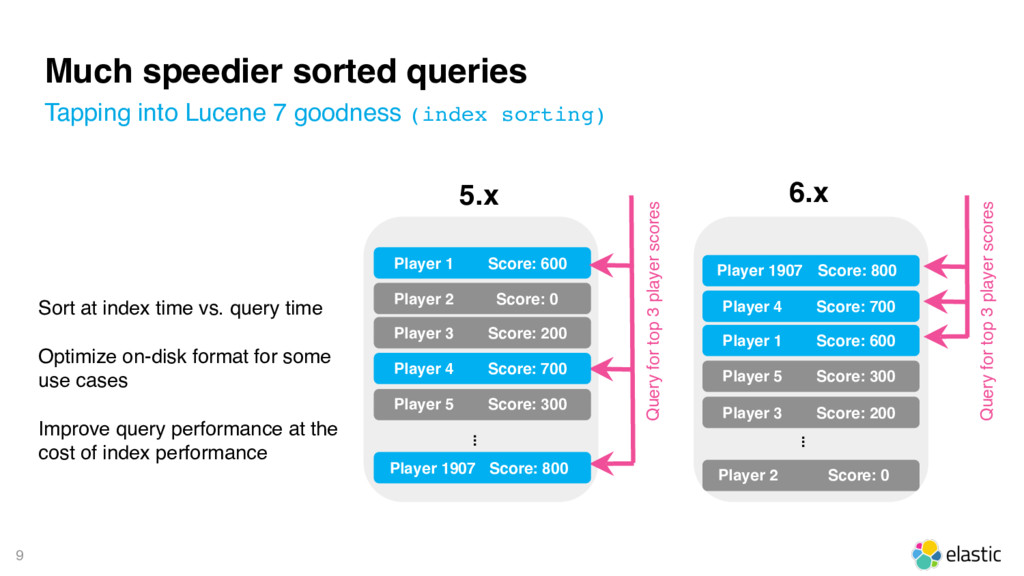
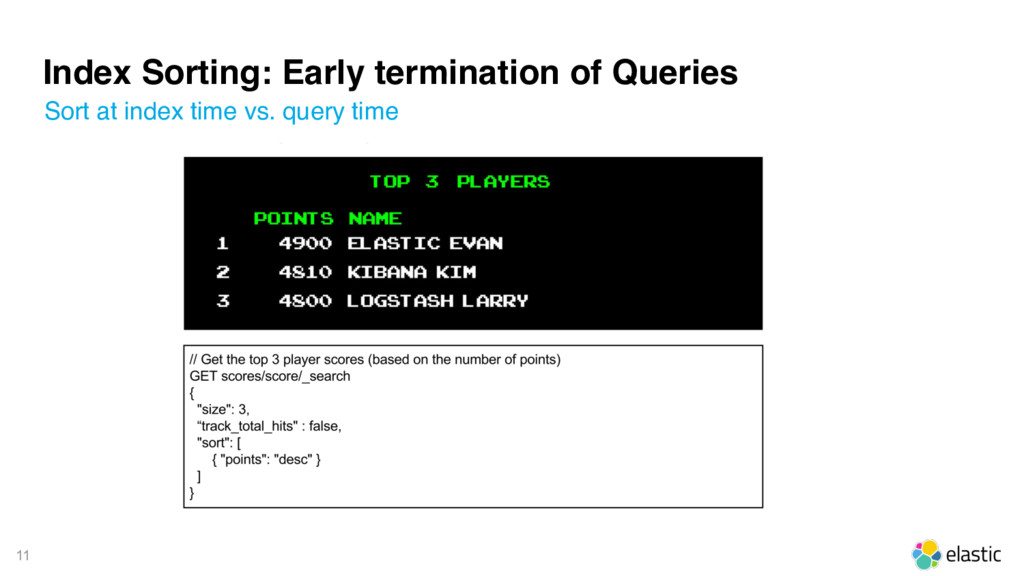
(index sorting) Player 1 Score: 600 5.x Query for top 3 player scores Player 2 Score: 0 Player 3 Score: 200 Player 4 Score: 700 Player 5 Score: 300 Player 1907 Score: 800 ... Query for top 3 player scores ... Player 1907 Score: 800 Player 4 Score: 700 Player 1 Score: 600 Player 5 Score: 300 Player 3 Score: 200 Player 2 Score: 0 6.x Sort at index time vs. query time Optimize on-disk format for some use cases Improve query performance at the cost of index performance
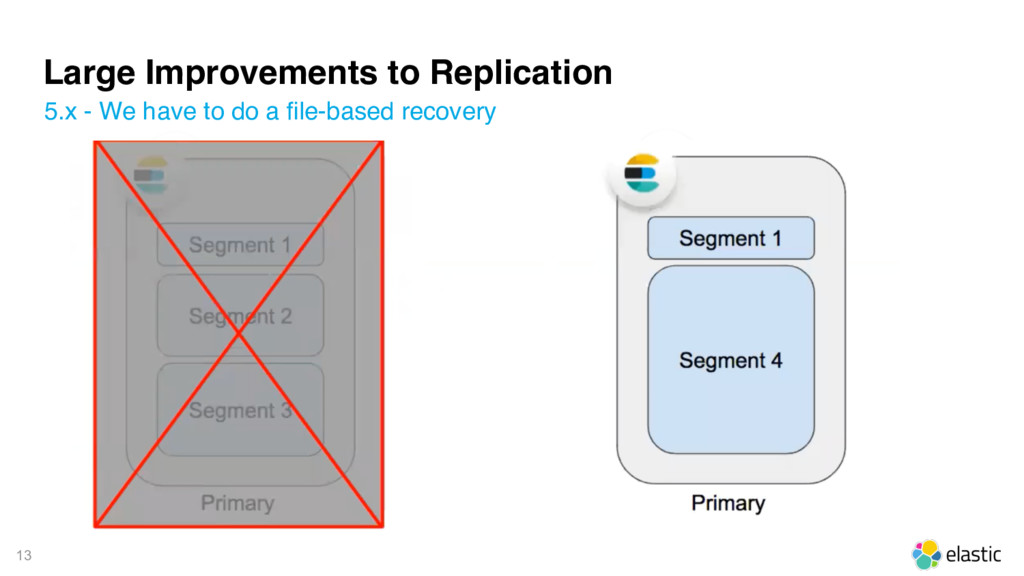
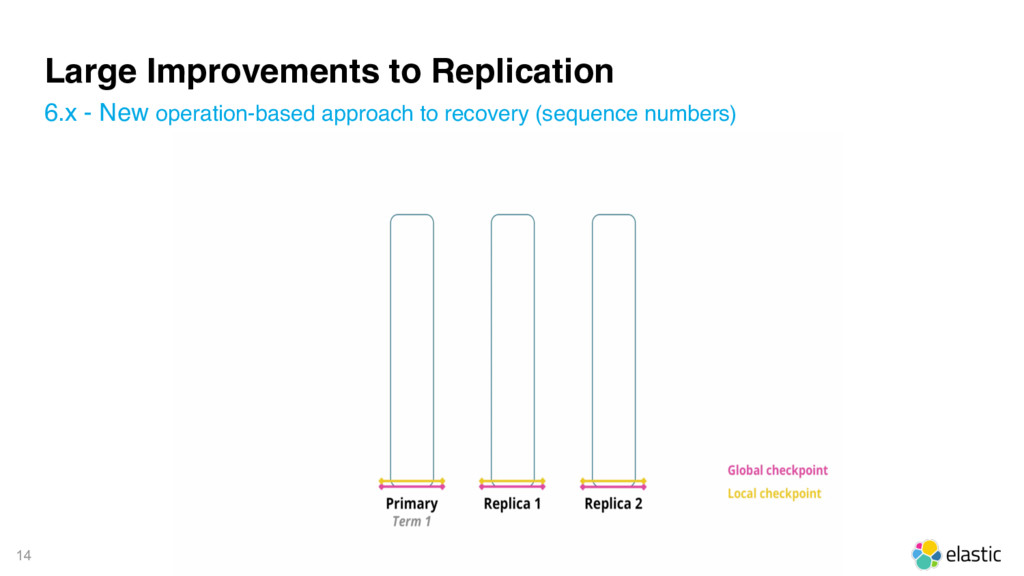
changed documents (instead of file-based recovery) • Fast replica recovery after temporary unavailability (network issues, etc.) • Re-sync on primary failure • Laying foundation for future big league features ‒Cross-datacenter replication ‒Changes API (tbd) New operation-based approach to recovery (sequence numbers)
• Gradual migration path ‒ 6.0 indices can be created with only one type ‒ Existing 5.x indices using _type will continue to function • Introducing new APIs for type-less operations Say goodbye to _type confusion
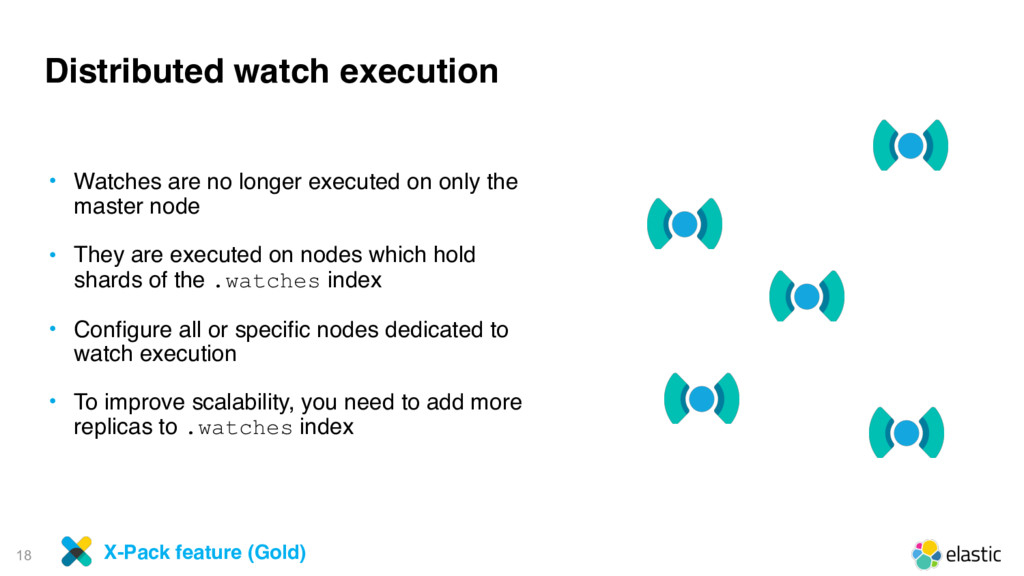
on only the master node • They are executed on nodes which hold shards of the .watches index • Configure all or specific nodes dedicated to watch execution • To improve scalability, you need to add more replicas to .watches index X-Pack feature (Gold)
JVM • Simplify dataflow logic by managing per data source logic independently • Monitor each pipeline separately with the new Pipeline Viewer Multiple Pipelines, One Logstash Logstash JDBC Pipeline Netflow Pipeline Apache Pipeline
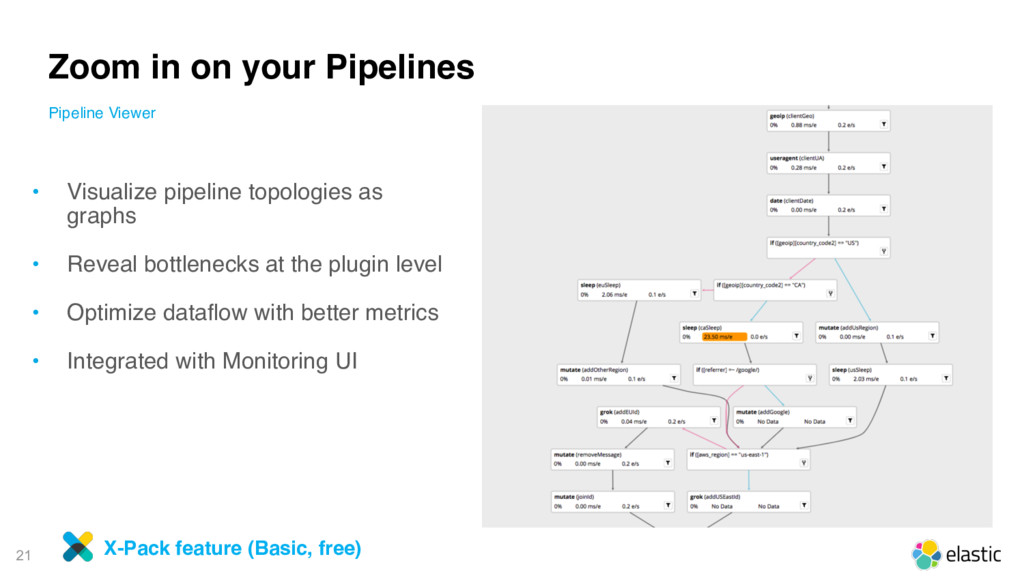
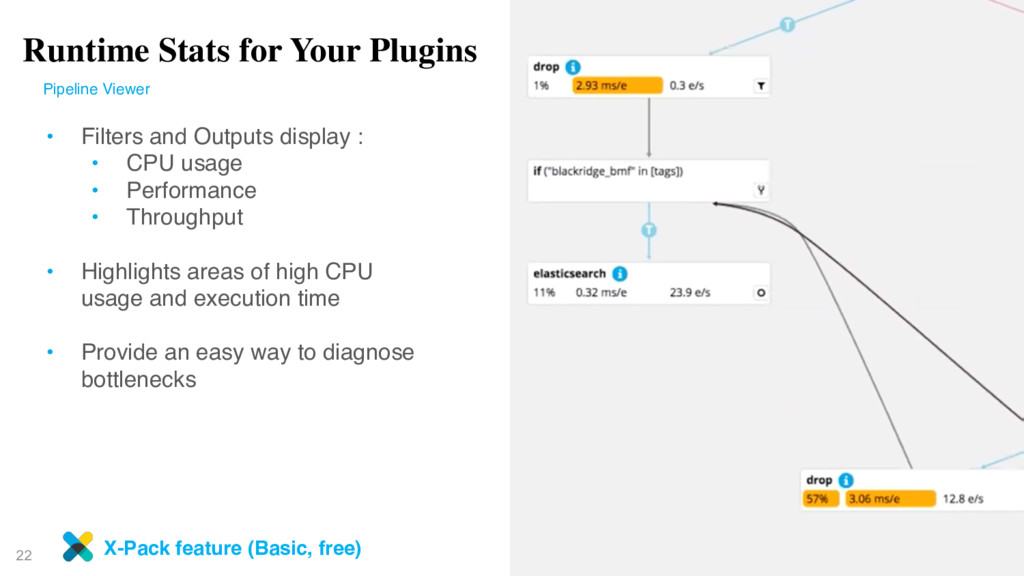
at the plugin level • Optimize dataflow with better metrics • Integrated with Monitoring UI Zoom in on your Pipelines Pipeline Viewer X-Pack feature (Basic, free)
display : • CPU usage • Performance • Throughput • Highlights areas of high CPU usage and execution time • Provide an easy way to diagnose bottlenecks Pipeline Viewer X-Pack feature (Basic, free)
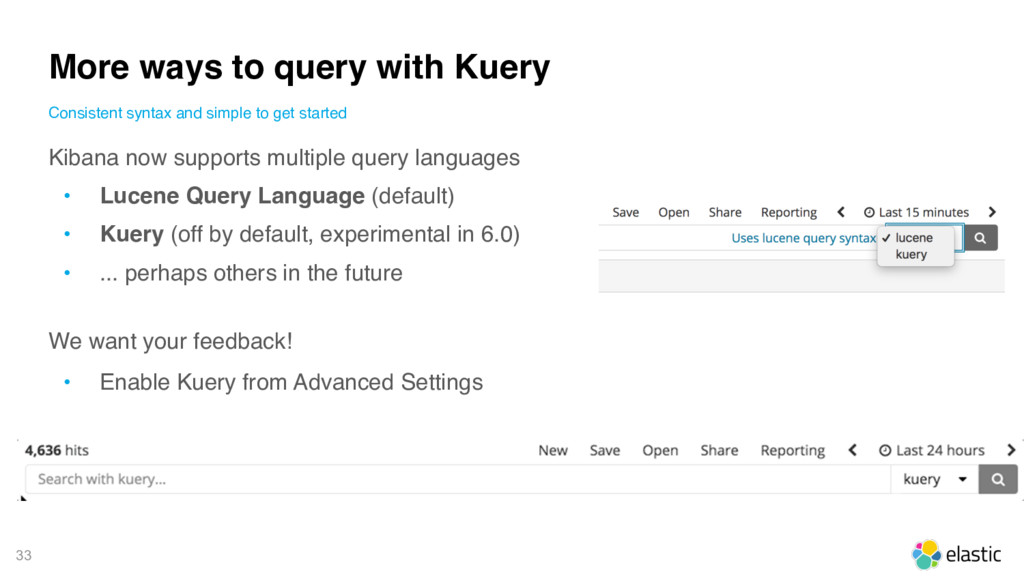
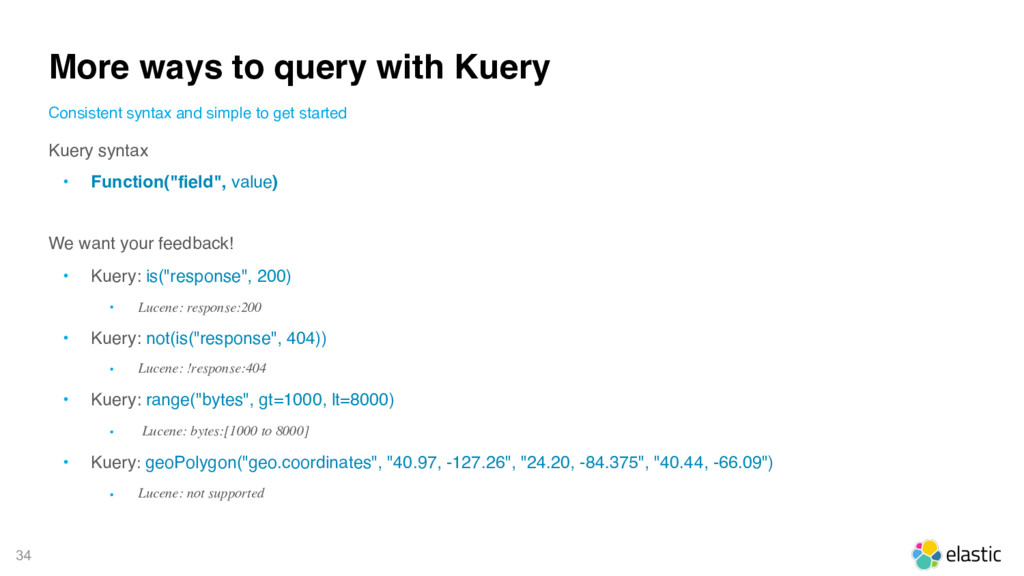
Language (default) • Kuery (off by default, experimental in 6.0) • ... perhaps others in the future We want your feedback! • Enable Kuery from Advanced Settings More ways to query with Kuery Consistent syntax and simple to get started
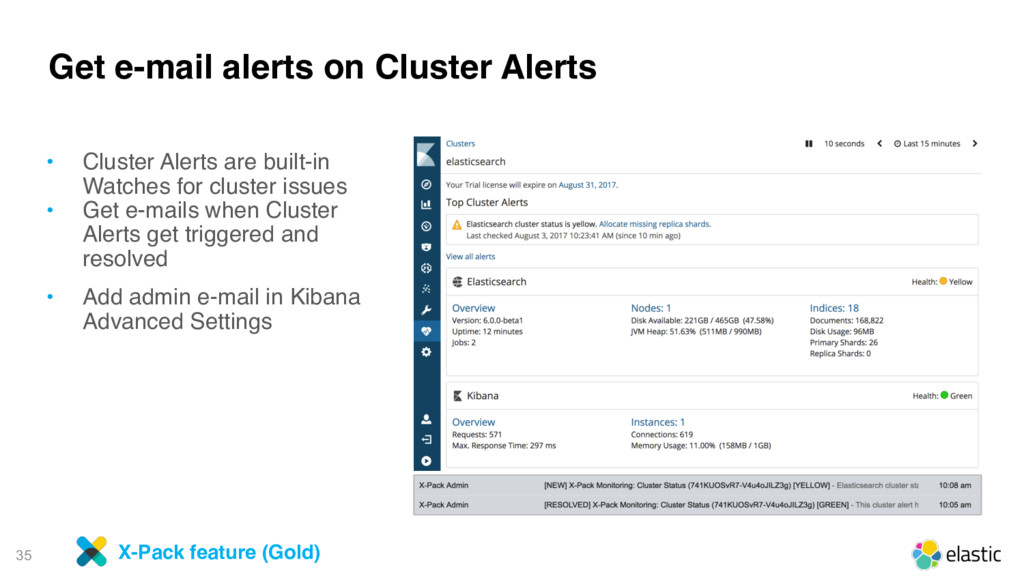
are built-in Watches for cluster issues • Get e-mails when Cluster Alerts get triggered and resolved • Add admin e-mail in Kibana Advanced Settings X-Pack feature (Gold)
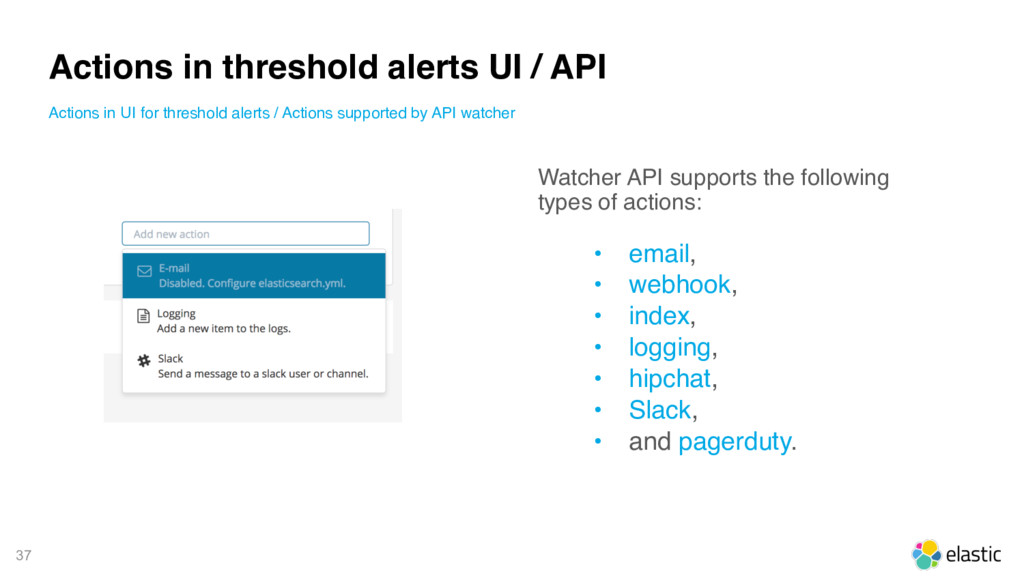
UI for threshold alerts / Actions supported by API watcher Watcher API supports the following types of actions: • email, • webhook, • index, • logging, • hipchat, • Slack, • and pagerduty.
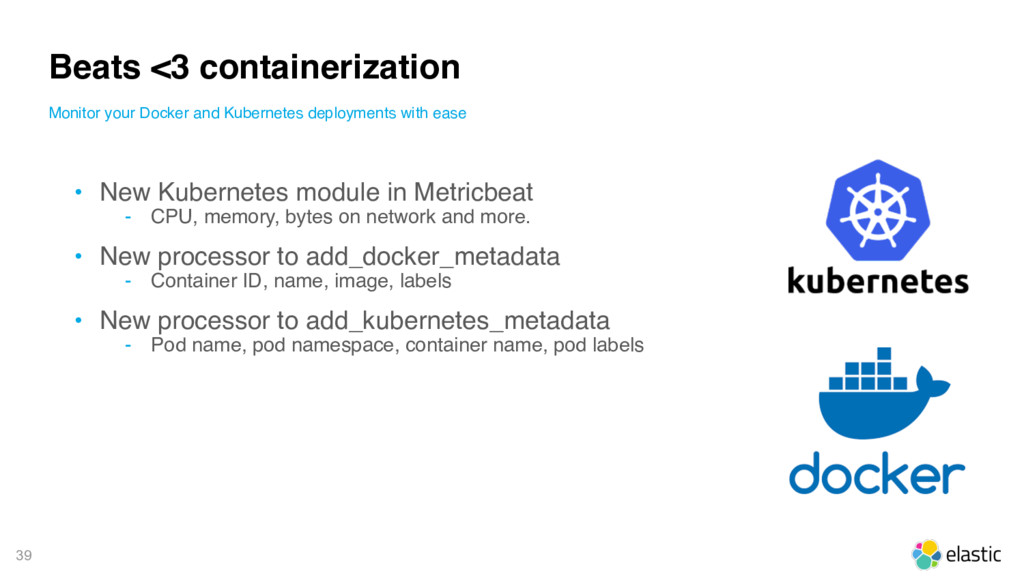
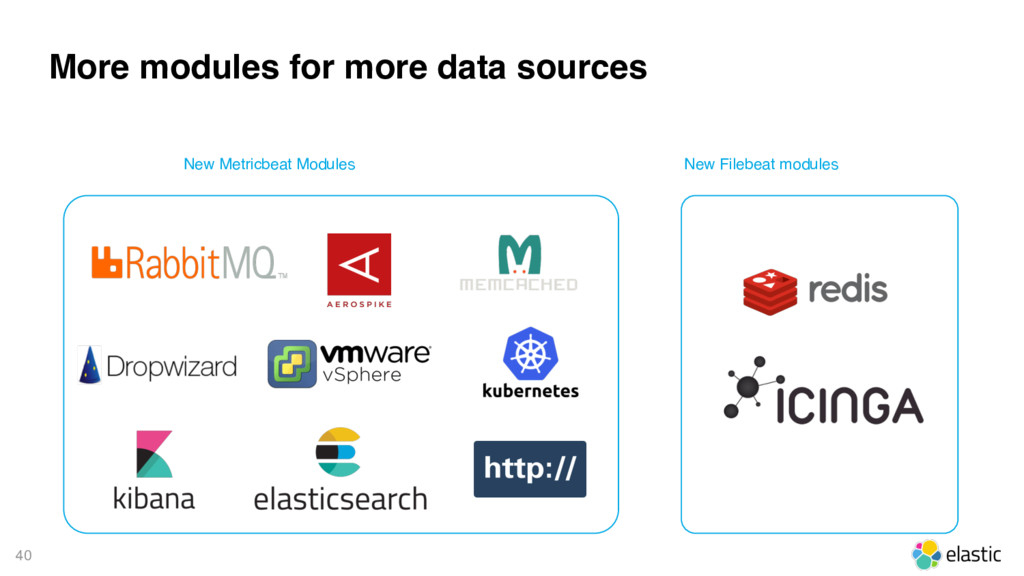
bytes on network and more. • New processor to add_docker_metadata ‒ Container ID, name, image, labels • New processor to add_kubernetes_metadata ‒ Pod name, pod namespace, container name, pod labels Beats <3 containerization Monitor your Docker and Kubernetes deployments with ease
Auditbeat subscribes to the kernel directly • Reuse auditd rule formats (no need to learn new rule formats) • Plus, file integrity checks on Linux, macOS, and Windows ‒ Watch files or directories (non-recursively) for changes ‒ Report file metadata and MD5, SHA1, SHA256 hashes on changes Auditbeat - a simpler way to track audit logs An alternative to auditd on Linux
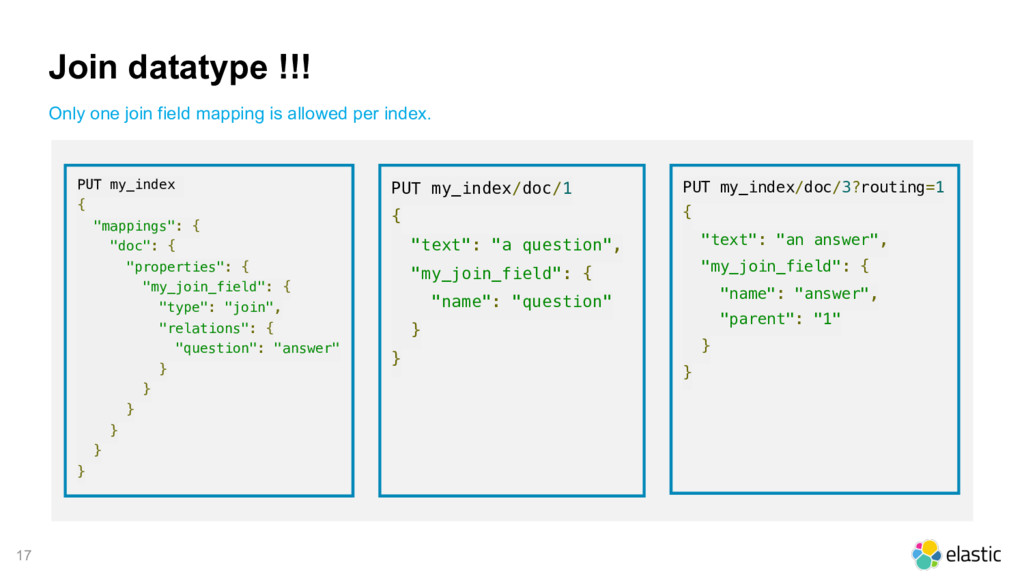
Top queries are super-fast (sort at index time), • Save disk space (save a lot of both disk space and file-system cache), • Say goodbye to multiple _types within index (parent/child become Join datatype) • Fast replica recovery (Sequence numbers improve replicas synchronization, recovery if primary shard fails... much more to come)
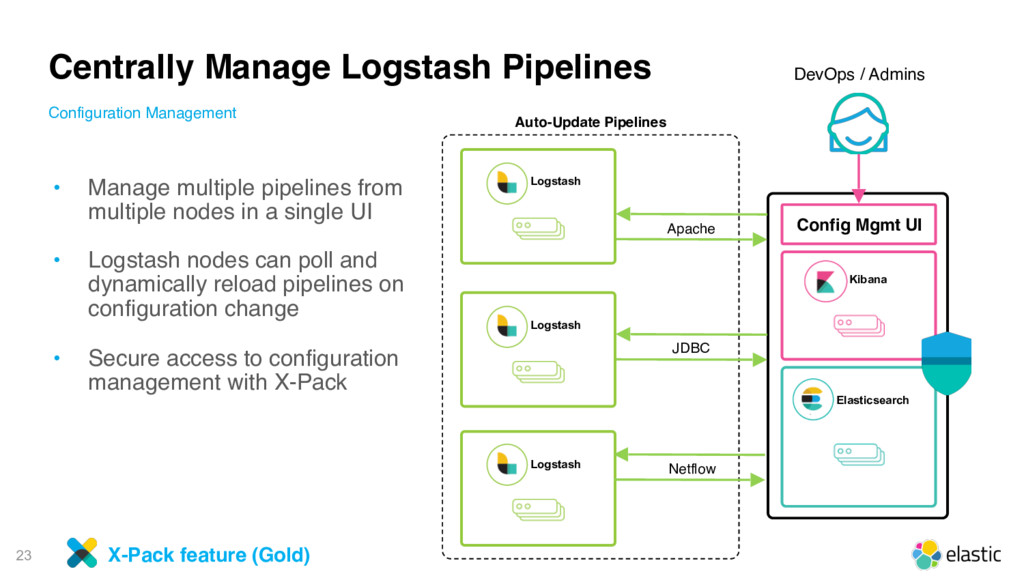
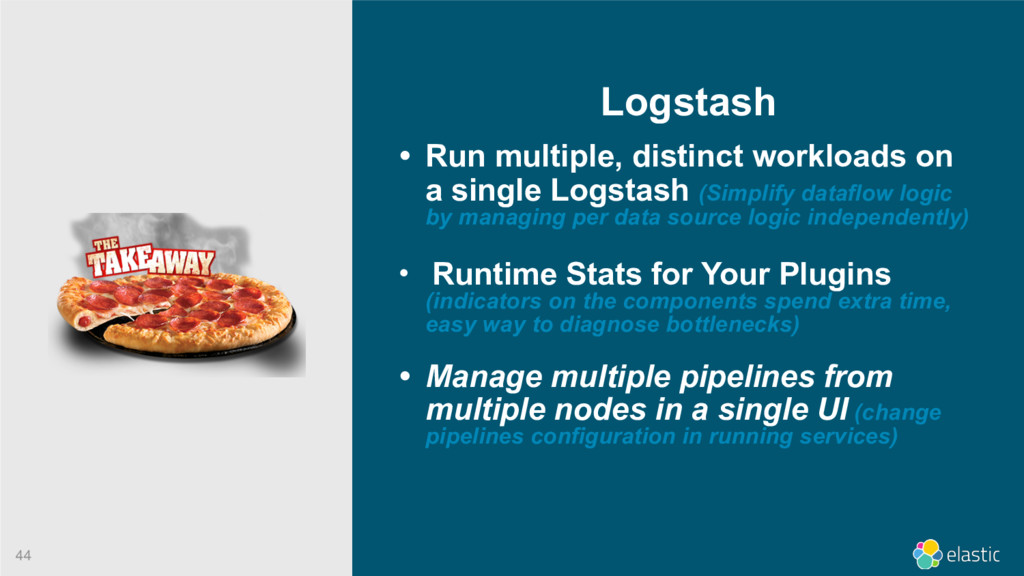
Logstash (Simplify dataflow logic by managing per data source logic independently) • Runtime Stats for Your Plugins (indicators on the components spend extra time, easy way to diagnose bottlenecks) • Manage multiple pipelines from multiple nodes in a single UI (change pipelines configuration in running services)
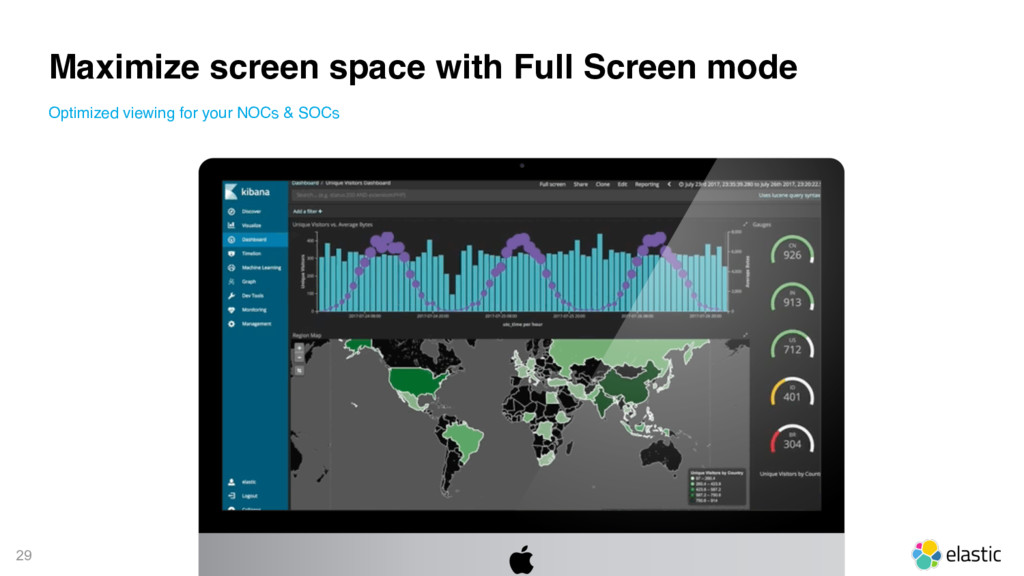
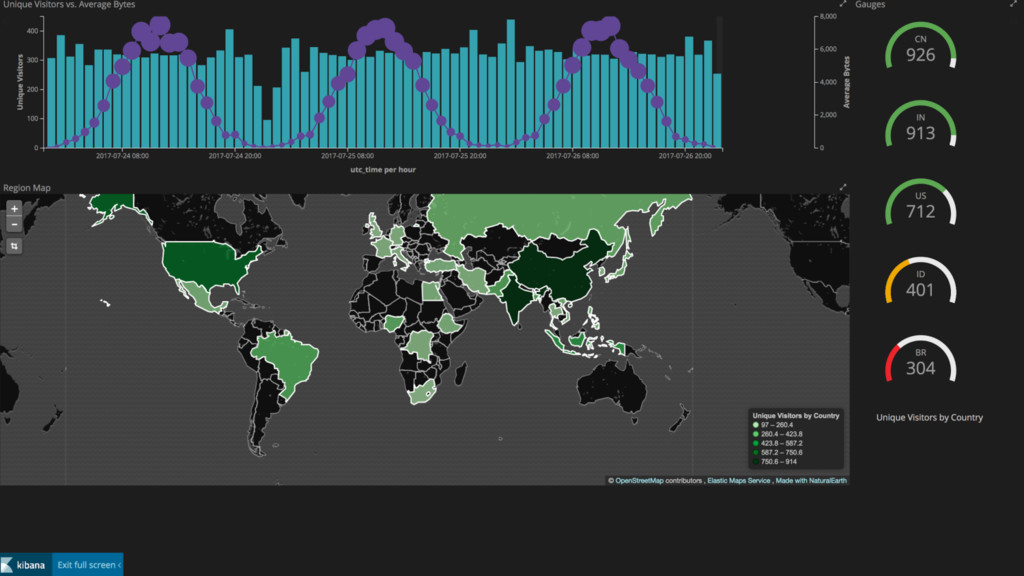
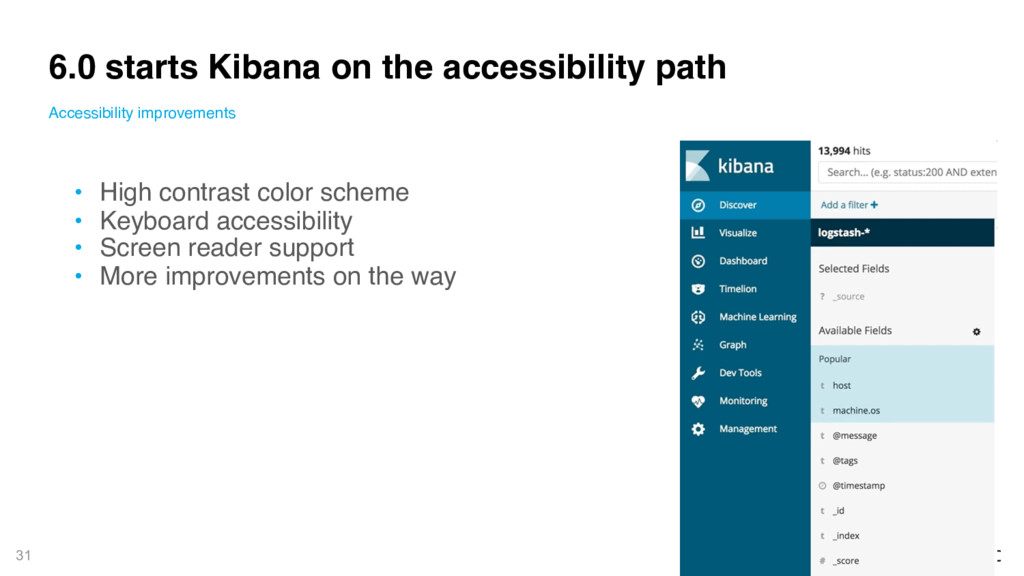
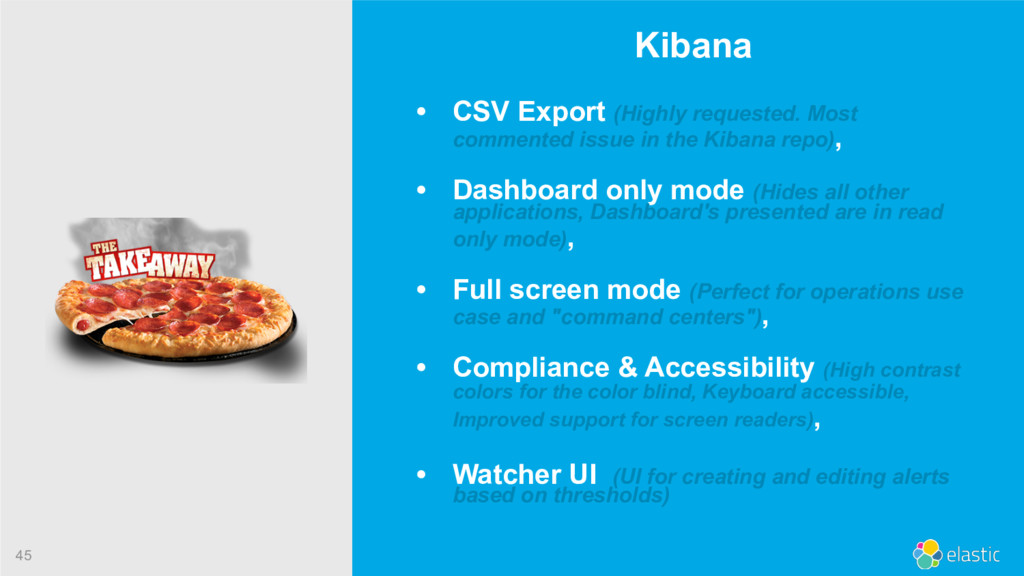
in the Kibana repo), • Dashboard only mode (Hides all other applications, Dashboard's presented are in read only mode), • Full screen mode (Perfect for operations use case and "command centers"), • Compliance & Accessibility (High contrast colors for the color blind, Keyboard accessible, Improved support for screen readers), • Watcher UI (UI for creating and editing alerts based on thresholds)