Upgrade to Pro — share decks privately, control downloads, hide ads and more …

AAGW3 - Helina Tilahun - Spatial Analysis of Livestock Production Patterns in Ethiopia

CGIAR-CSI
March 29, 2013
300

AAGW3 - Helina Tilahun - Spatial Analysis of Livestock Production Patterns in Ethiopia

CGIAR-CSI

March 29, 2013
Tweet

Transcript

  1. ETHIOPIAN DEVELOPMENT RESEARCH INSTITUTE Spatial Analysis of Livestock Production Patterns

    in Ethiopia Helina Tilahun Emily Schmidt IFPRI ESSP-II Africa Agriculture GIS Week 2013 March 12-14, 2013 Addis Ababa 1
  2. 2 Overview • What are the current trends in cattle,

    sheep and goat population? – Where are most of the livestock population located? • Herd composition • Travel time • Pressure on grazing land? • Link livestock population data and Geographic Information Systems (GIS) data.
  3. 3 Current Trends • Livestock population in Ethiopia continues to

    grow, with the highland regions producing the largest share of cattle, sheep and goats. • Livestock population (cattle, sheep, and goat) increased 22 percentage points between 2005 and 2008. – Oromiya, Amhara and SNNP regions produced 87 percent of cattle in 2007/08.
  4. 4 0 10 20 30 40 50 60 2005/06 2006/07

    2007/08 Millions Cattle Population CSA FAO 0 10 20 30 40 50 60 2005/06 2006/07 2007/08 Millions Sheep and Goat Population CSA FAO Source: Author’s calculations; CSA: Agricultural Sample Survey (2005–2008) and FAO (2005–2008)
  5. 9 Herd Composition: Ethiopia • Sheep and goat population is

    increasing compared to cattle population. • In 2001/02 a majority of regions produced more cattle than sheep and goat. • By 2007/08, sheep and goat population dominated in Tigray, Amhara, Benishangul Gumuz, Harari.
  6. 10 Ethiopia: Sheep and Goat to Cattle Ratio (2001 –

    2008) Source: Authors’ calculations; CSA: Agricultural Census (2001) and Agricultural Sample Survey (2005-2008) Region Sheep and goat: Cattle 2001/02 Sheep and goat: Cattle 2005/06 Sheep and goat: Cattle 2006/07 Sheep and goat: Cattle 2007/08 Tigray 0.92 1.22 1.27 1.41 Afar 2.88 3.11 3.05 3.19 Amhara 0.87 1.23 1.28 1.27 Oromiya 0.49 0.74 0.76 0.80 Somali 2.27 2.41 2.90 4.48 Benishangul Gumuz 0.84 1.09 1.33 1.26 SNNP 0.66 0.68 0.78 0.69 Gambella 0.74 0.74 0.74 0.48 Harari 0.73 1.00 1.03 1.13 Addis Ababa 0.46 0.58 0.49 0.46 Dire Dawa 2.31 4.64 4.77 4.30 Ethiopia 0.80 0.99 1.04 1.07
  7. 11 Ratio of Sheep and Goat to Cattle (2000 –

    2009) 0 10 20 30 40 50 60 70 80 90 100 Ethiopia 2000 Ethiopia 2005 Ethiopia 2009 Kenya 2000 Kenya 2005 Kenya 2009 Million head of livestock Cattle Shoats Sheep and goats Source: Food and Agriculture Organization (FAO)
  8. 12 Market Access and Livestock Population • Transportation infrastructure has

    improved considerably between 2000 and 2008. – Better road infrastructure enables the highland areas to prevail as primary supplier of livestock for the domestic markets in Ethiopia (FEWS NET, 2007). – Although the cost of trucking livestock is higher compared to trekking, traders and producers prefer trucking fattened animals in order to avoid weight loss (Gebremedhin et al. 2007). • Data suggest that cattle population is higher within 5 hours of a major livestock market. • In 2001/02, 57 percent of cattle population in Amhara region were located within 5 hours of market, in 2007/08 this figure reached 73 percent; Oromiya from 64 to 81, SNNP from 60 to 78. • Sheep and goat population within 5 hours travel time to a market increased. – But not as dependent to accessibility as cattle population.
  9. 17 Livestock Population and Grazing Land Pressure • Availability of

    natural pastures is declining : – greater human population density, – larger herd sizes, and – relatively fixed grazing land resources. (Benin et al., 2002; Degefe and Nega 2000). • To approximate measure of livestock density per square kilometer of grazing land, we have paired the landcover data produced by the Woody Biomass Inventory and Strategic Planning Project (WBISPP, 2000) with the estimated woreda livestock population figures from 2001/02 through 2007/08.
  10. 20 East Africa: Tropical Livestock Unit per sq. km of

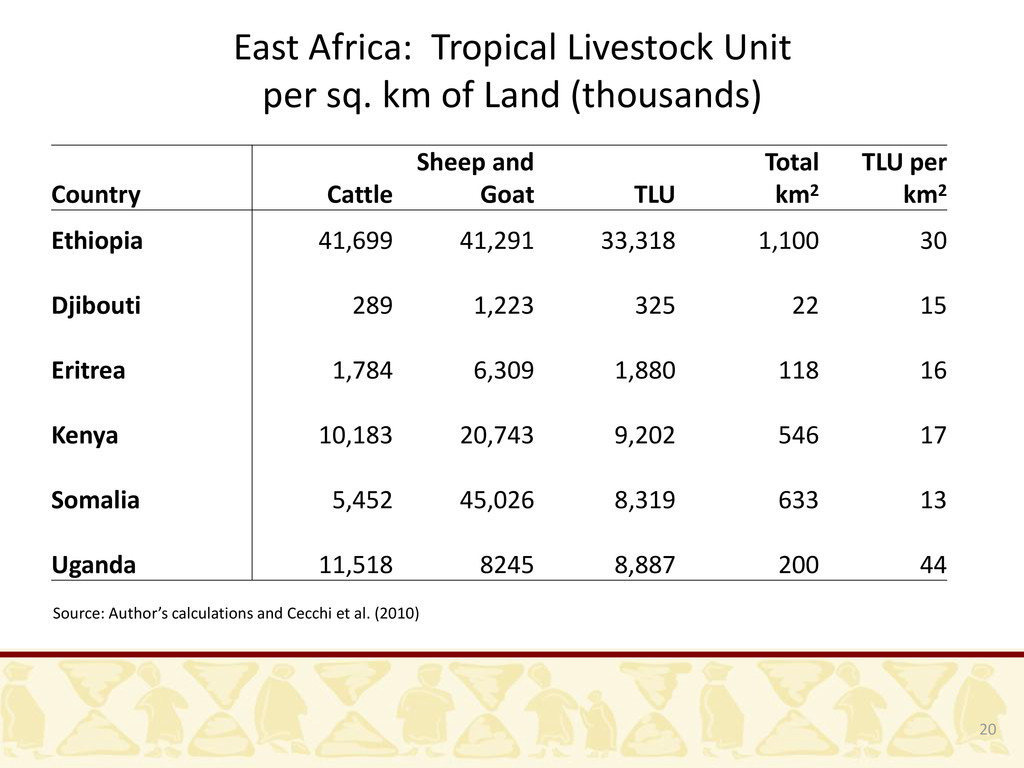
    Land (thousands) Country Cattle Sheep and Goat TLU Total km2 TLU per km2 Ethiopia 41,699 41,291 33,318 1,100 30 Djibouti 289 1,223 325 22 15 Eritrea 1,784 6,309 1,880 118 16 Kenya 10,183 20,743 9,202 546 17 Somalia 5,452 45,026 8,319 633 13 Uganda 11,518 8245 8,887 200 44 Source: Author’s calculations and Cecchi et al. (2010)
  11. 21 Conclusions • Livestock population in Ethiopia continues to grow,

    with the highland regions producing the largest share. • Data comparing herd composition suggest that the sheep and goat population is increasing compared to cattle population. • Data suggest that a large majority of growth is occurring in the highland regions, within 5 hours of a livestock market. • In 2007/08, more than 70 percent of cattle population in the four major highland regions occurred within 5 hours travel time of a market.
  12. Conclusions (2) • Pressure on grazing land is also increasing.

    • Further research on landcover change and livestock growth in the highlands is necessary in order to understand pasture land / environmental viability in coming years.