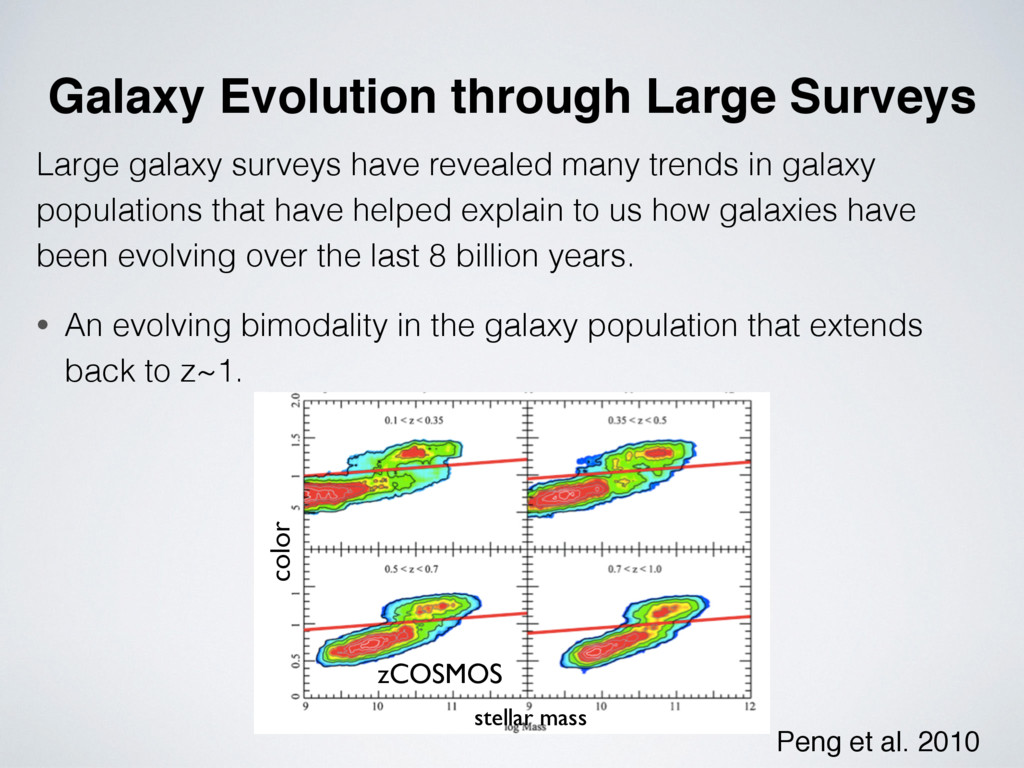
many trends in galaxy populations that have helped explain to us how galaxies have been evolving over the last 8 billion years. • An evolving bimodality in the galaxy population that extends back to z~1. zCOSMOS color stellar mass Peng et al. 2010
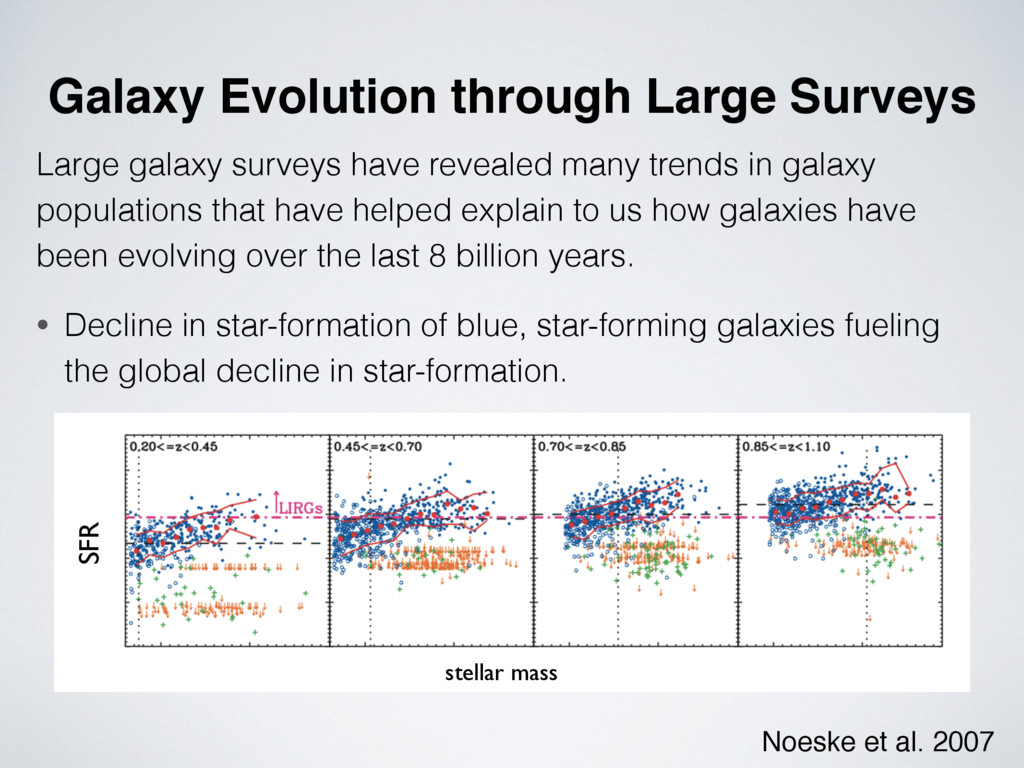
many trends in galaxy populations that have helped explain to us how galaxies have been evolving over the last 8 billion years. • Decline in star-formation of blue, star-forming galaxies fueling the global decline in star-formation. stellar mass SFR Noeske et al. 2007
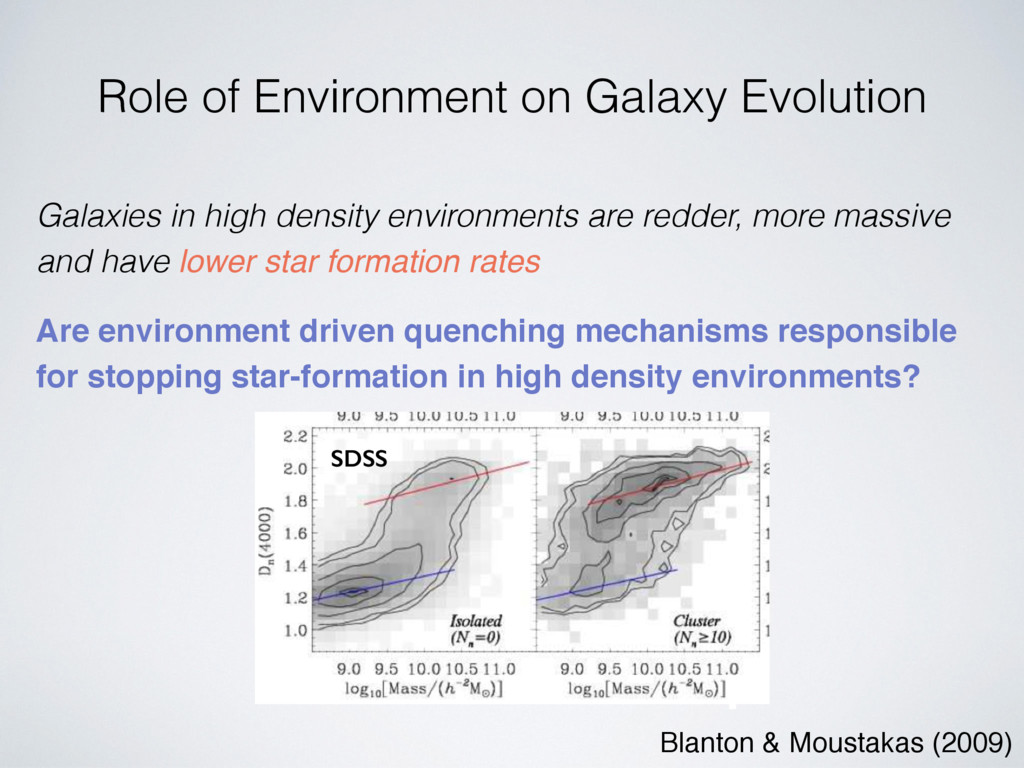
environments are redder, more massive and have lower star formation rates Are environment driven quenching mechanisms responsible for stopping star-formation in high density environments? SDSS Blanton & Moustakas (2009)
effects from underlying correlations among observable galaxy properties is challenging. But with the statistics available from SDSS and PRIMUS… We evaluate the quiescent fraction in bins of stellar mass, redshift and environment. fQ( M⇤, z, env )
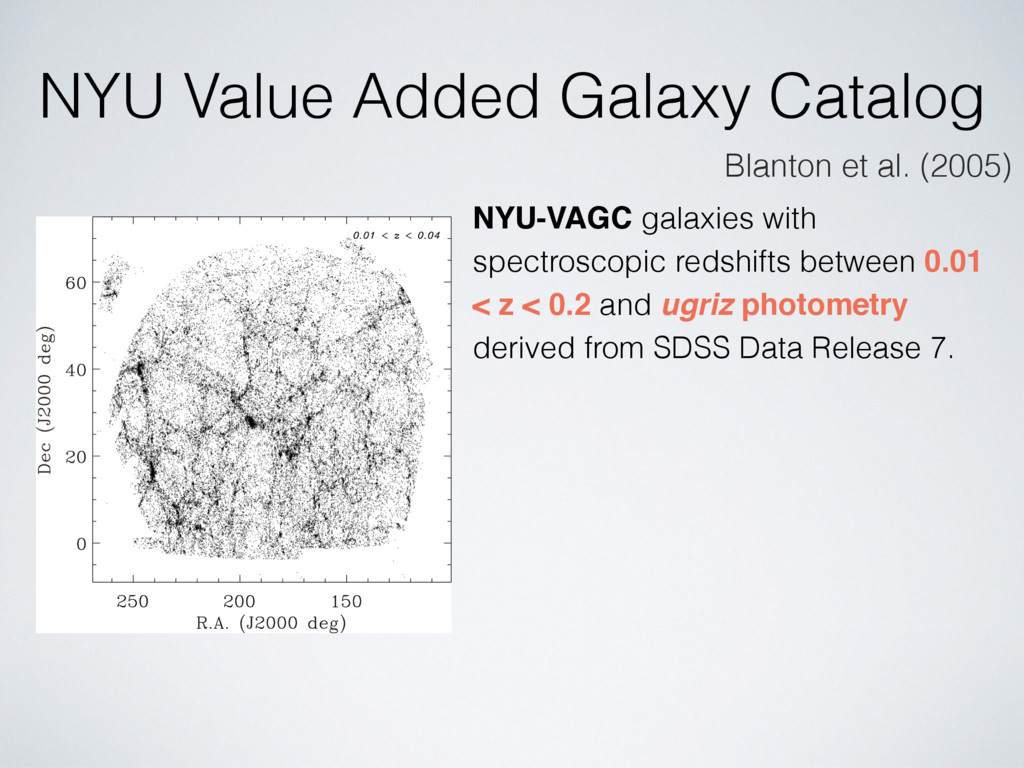
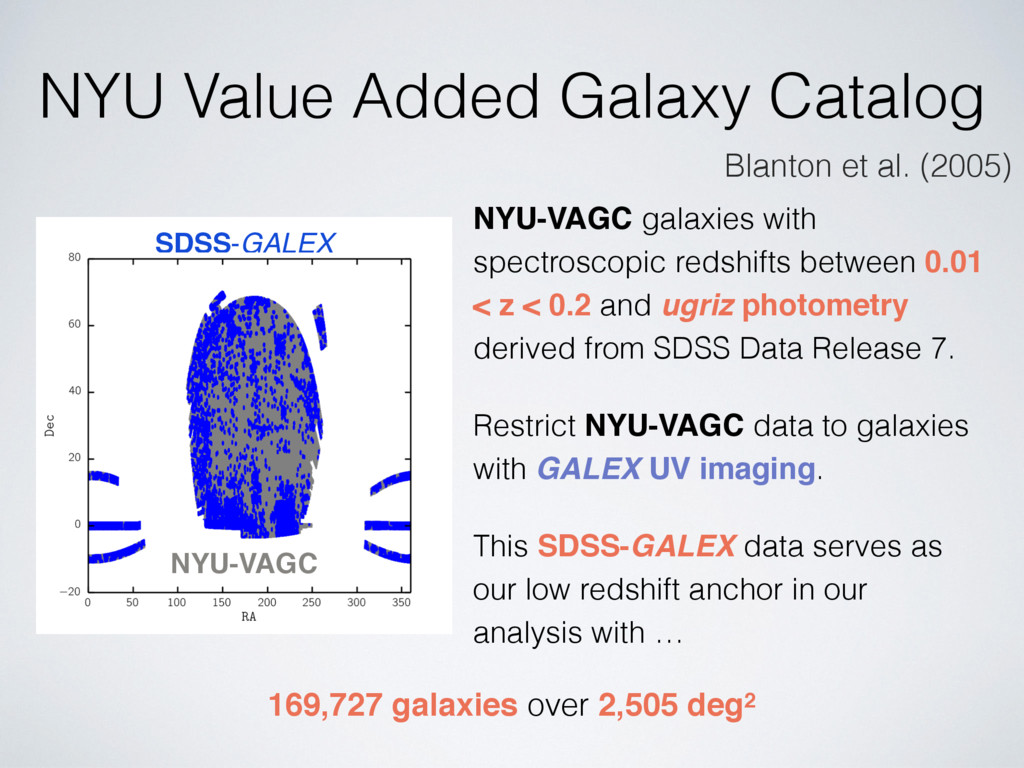
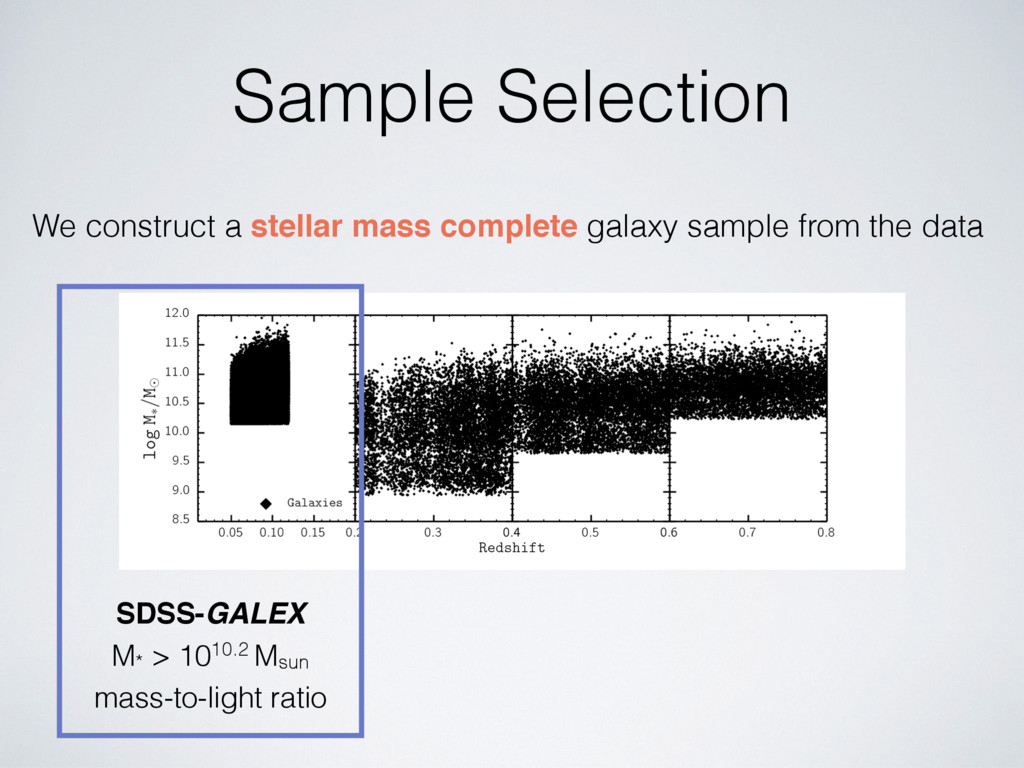
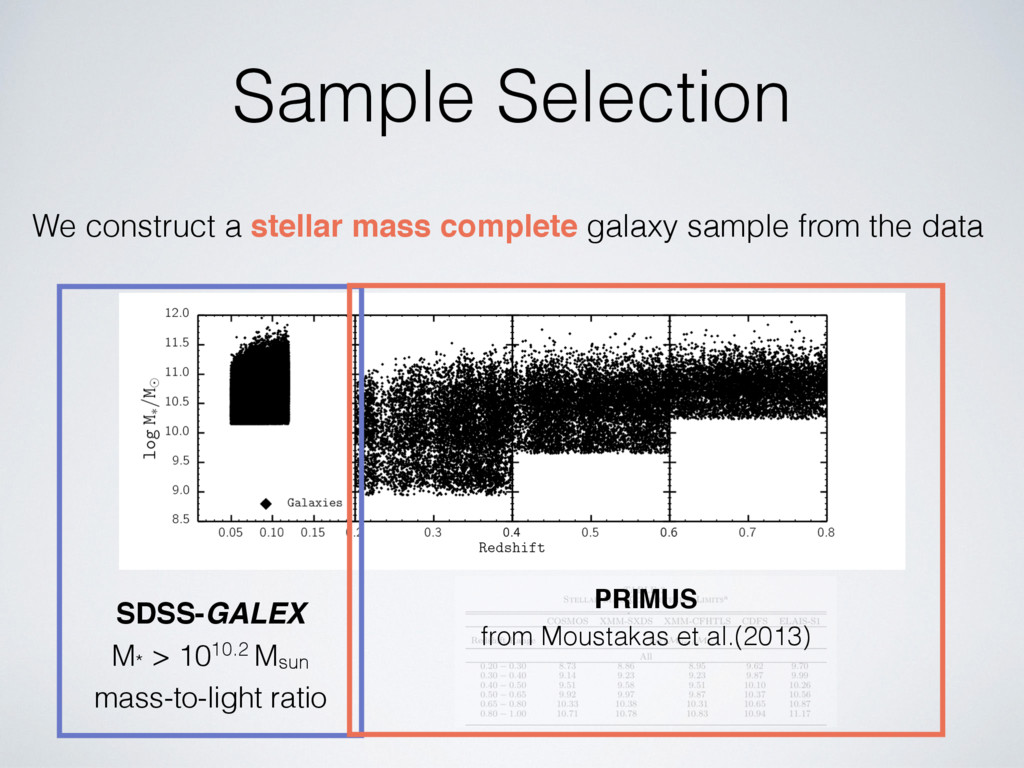
between 0.01 < z < 0.2 and ugriz photometry derived from SDSS Data Release 7. Restrict NYU-VAGC data to galaxies with GALEX UV imaging. This SDSS-GALEX data serves as our low redshift anchor in our analysis with … NYU-VAGC SDSS-GALEX 169,727 galaxies over 2,505 deg2 Blanton et al. (2005)
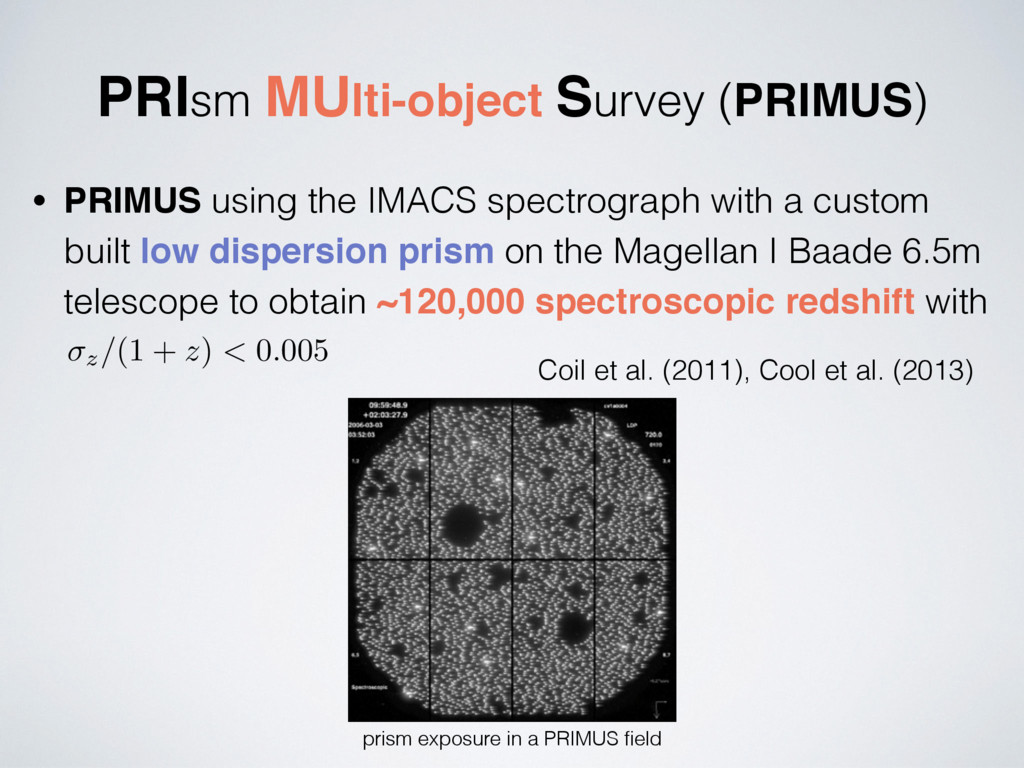
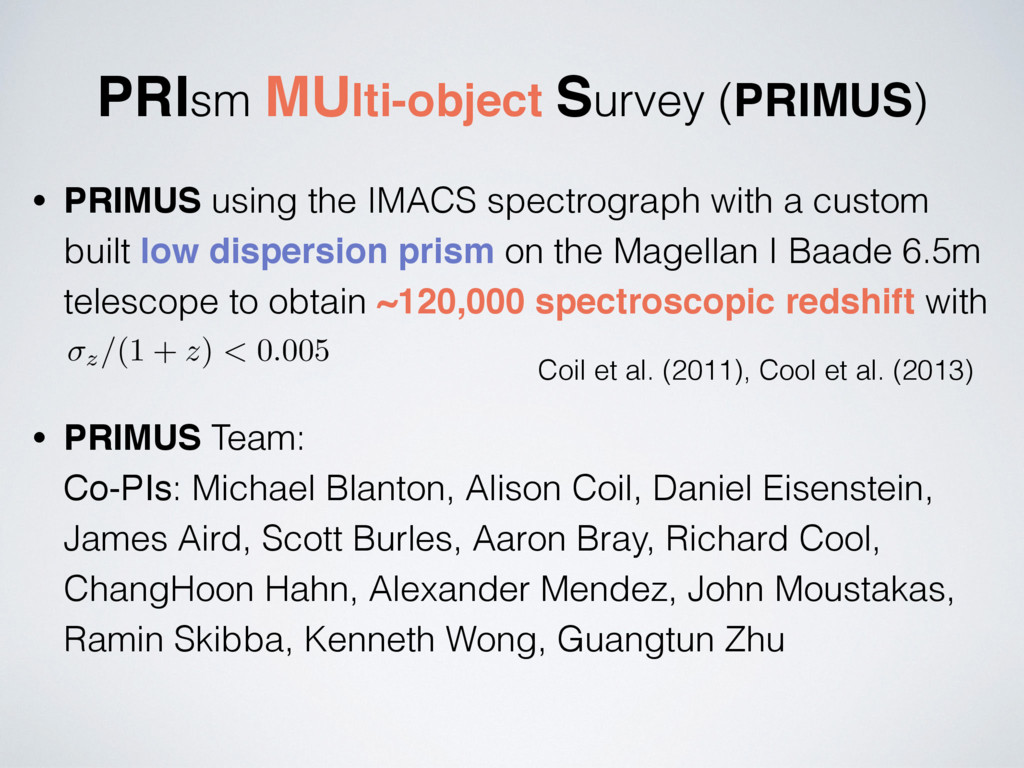
with a custom built low dispersion prism on the Magellan I Baade 6.5m telescope to obtain ~120,000 spectroscopic redshift with z/(1 + z) < 0.005 prism exposure in a PRIMUS field Coil et al. (2011), Cool et al. (2013)
with a custom built low dispersion prism on the Magellan I Baade 6.5m telescope to obtain ~120,000 spectroscopic redshift with • PRIMUS Team: Co-PIs: Michael Blanton, Alison Coil, Daniel Eisenstein, James Aird, Scott Burles, Aaron Bray, Richard Cool, ChangHoon Hahn, Alexander Mendez, John Moustakas, Ramin Skibba, Kenneth Wong, Guangtun Zhu z/(1 + z) < 0.005 Coil et al. (2011), Cool et al. (2013)
to: • ΛCDM Halo Models of Galaxy Clustering and Evolution in PRIMUS +DEEP2 at 0.2 < z < 1.2 Ramin A. Skibba, PRIMUS Team (in prep.) • Clustering as a Function of Star Formation Rate and Stellar Mass Alexander J. Mendez, PRIMUS Team (in prep.) • Color and Luminosity Dependence of Small-scale Clustering Aaron Bray, PRIMUS Team (in prep.) • PRIMUS: Effect of Galaxy Environment on the Quiescent Fraction Evolution at z < 0.8 ChangHoon Hahn, PRIMUS Team (Submitted to ApJ)
five fields with GALEX UV and Spitzer/IRAC imaging for a total of ~5.5 deg2. Using the broad wavelength photometry we apply iSEDfit to calculate stellar mass and SFR for our galaxies. (Moustakas et al. 2013)
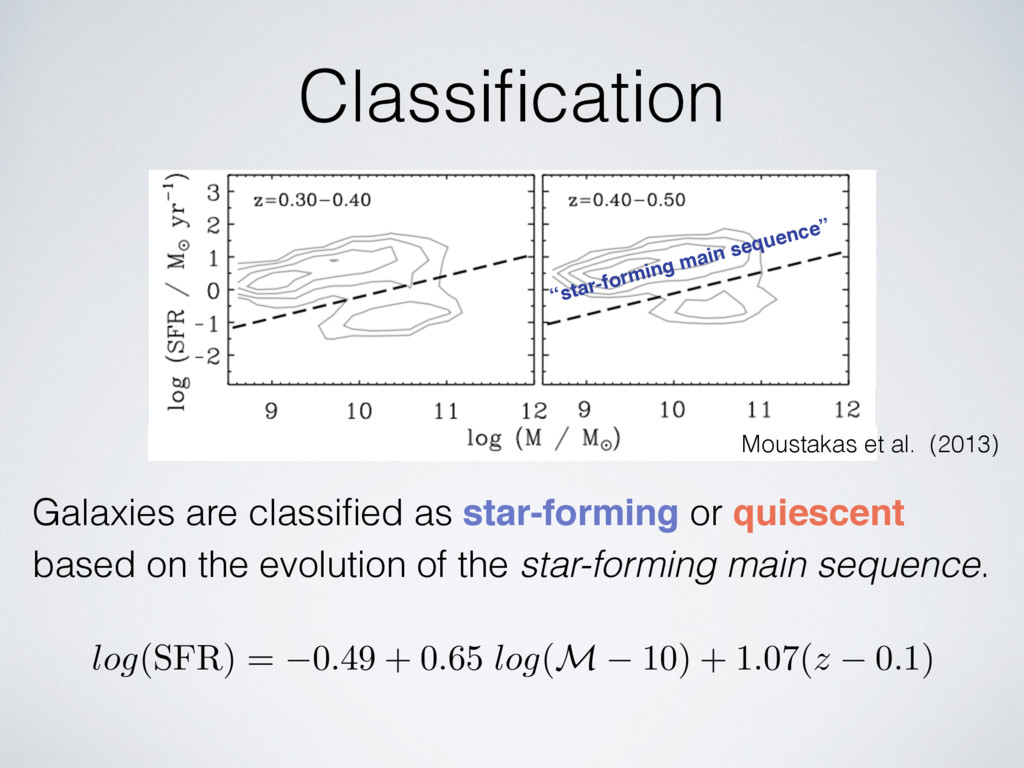
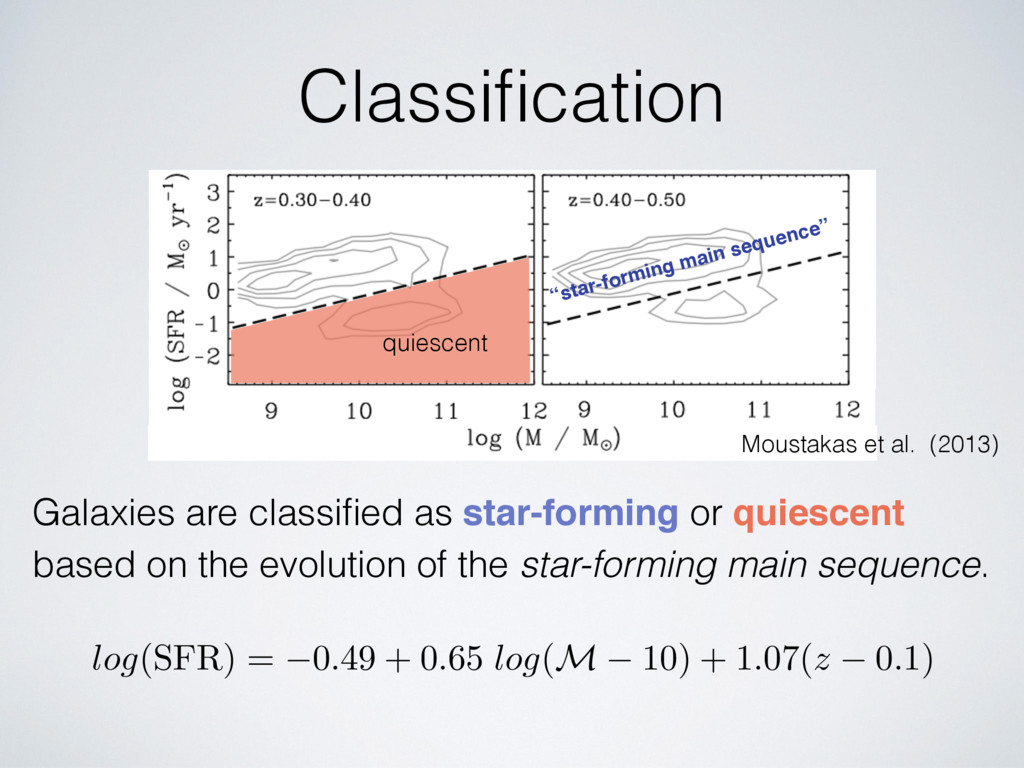
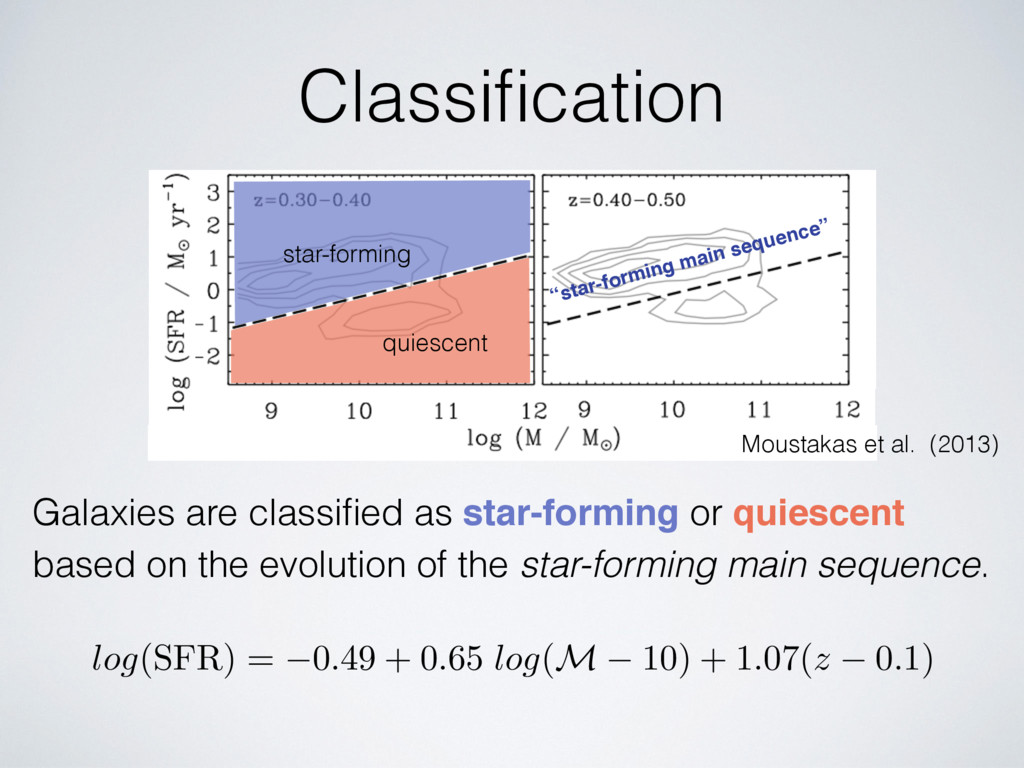
the evolution of the star-forming main sequence. log (SFR) = 0 . 49 + 0 . 65 log (M 10) + 1 . 07( z 0 . 1) Moustakas et al. (2013) “star-forming main sequence”
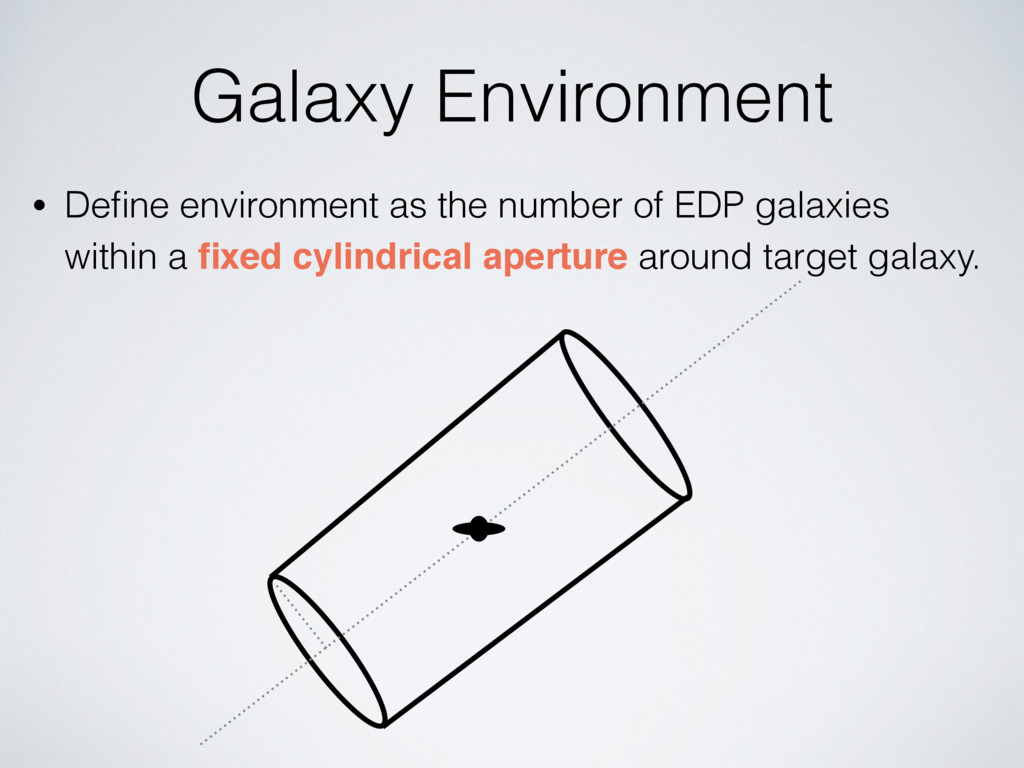
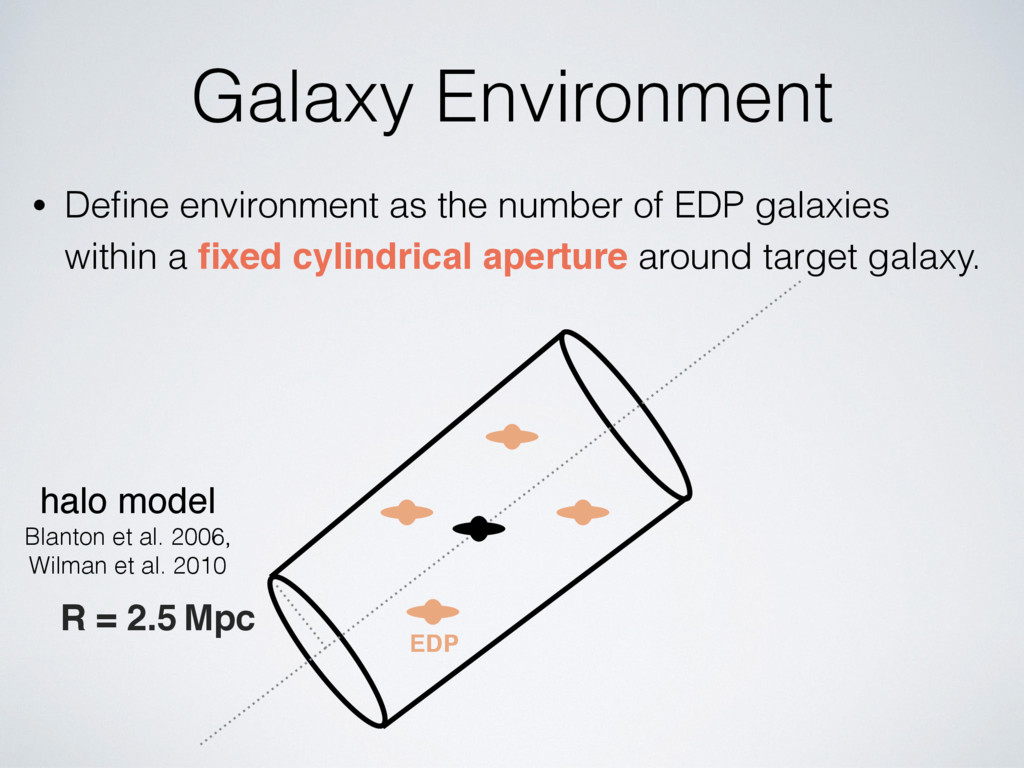
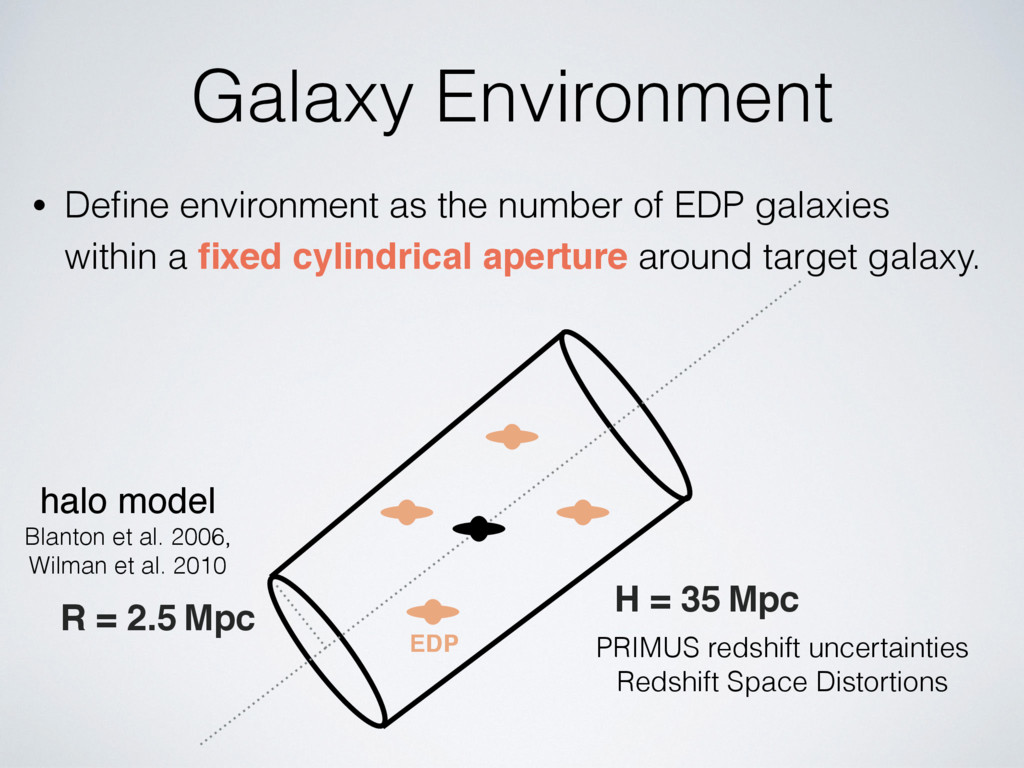
galaxies within a fixed cylindrical aperture around target galaxy. EDP R = 2.5 Mpc halo model Blanton et al. 2006, Wilman et al. 2010 H = 35 Mpc PRIMUS redshift uncertainties Redshift Space Distortions
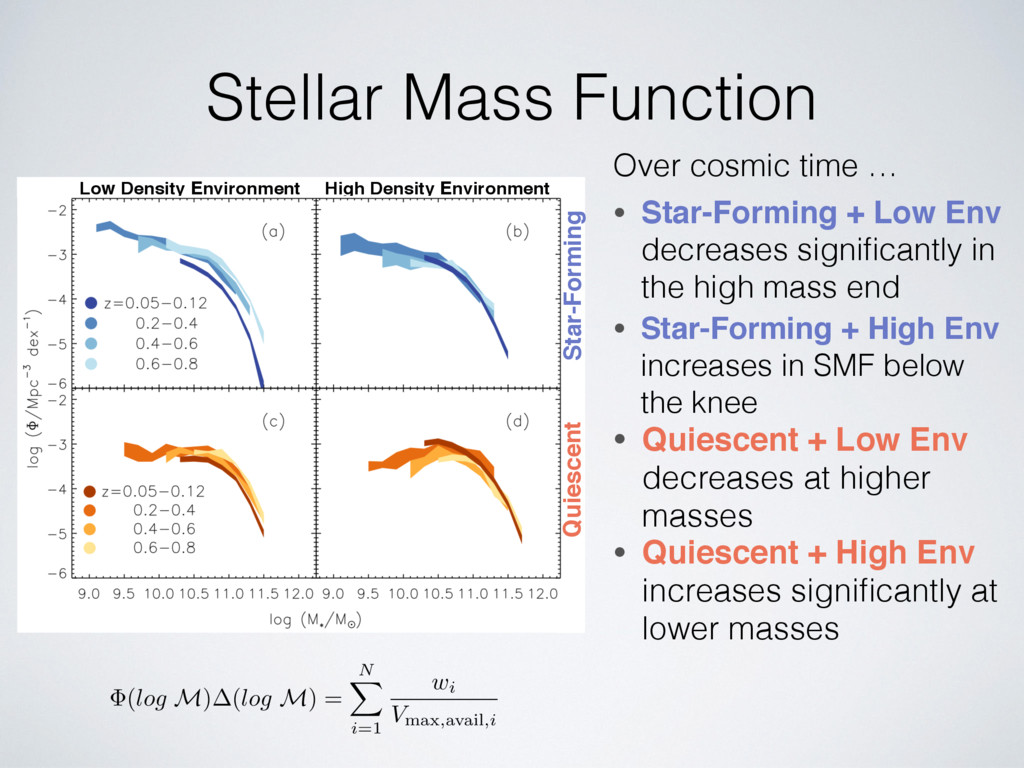
N X i =1 wi Vmax , avail ,i Low Density Environment High Density Environment Star-Forming Quiescent • Quiescent + Low Env decreases at higher masses • Star-Forming + High Env increases in SMF below the knee Over cosmic time … • Star-Forming + Low Env decreases significantly in the high mass end • Quiescent + High Env increases significantly at lower masses
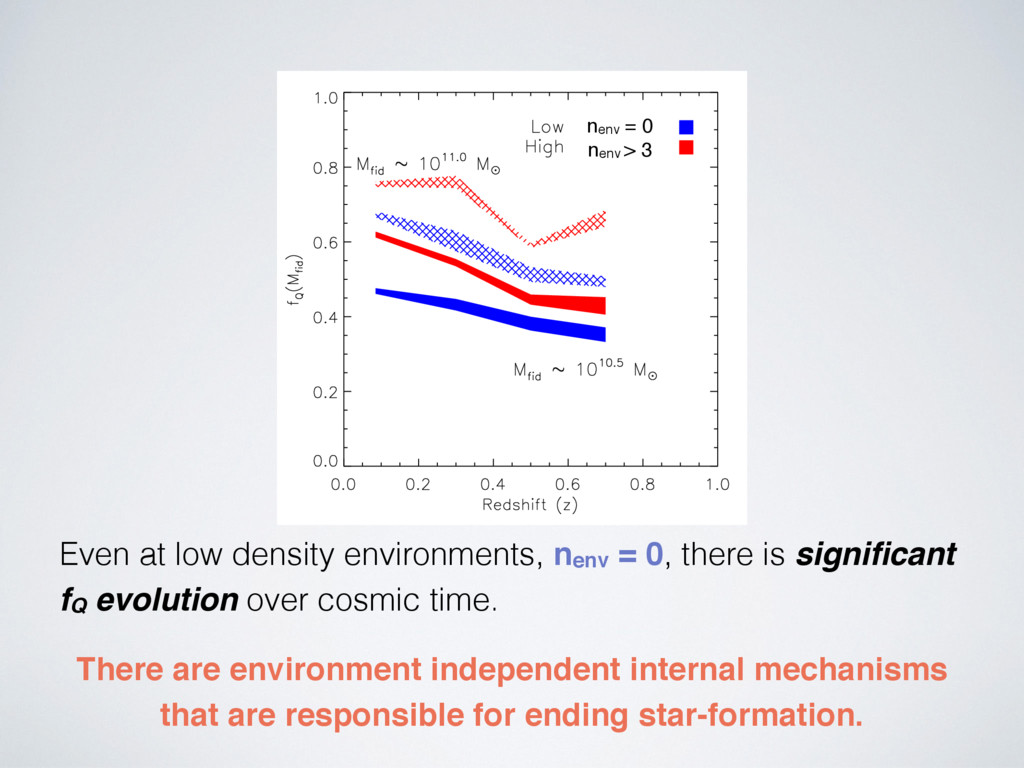
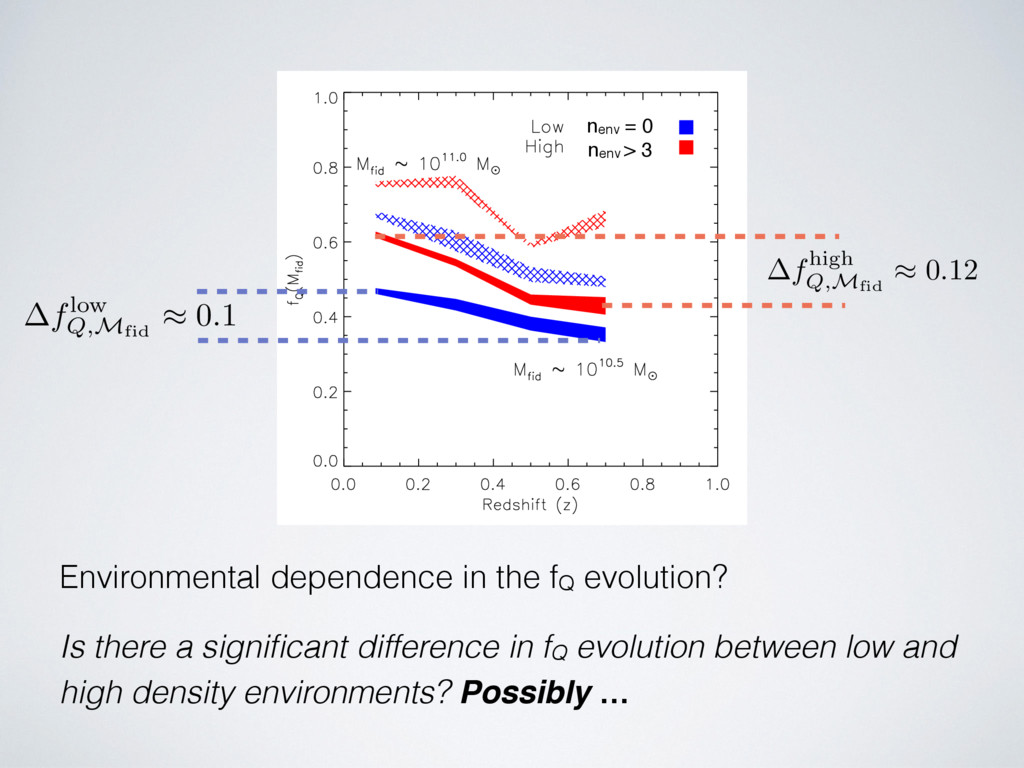
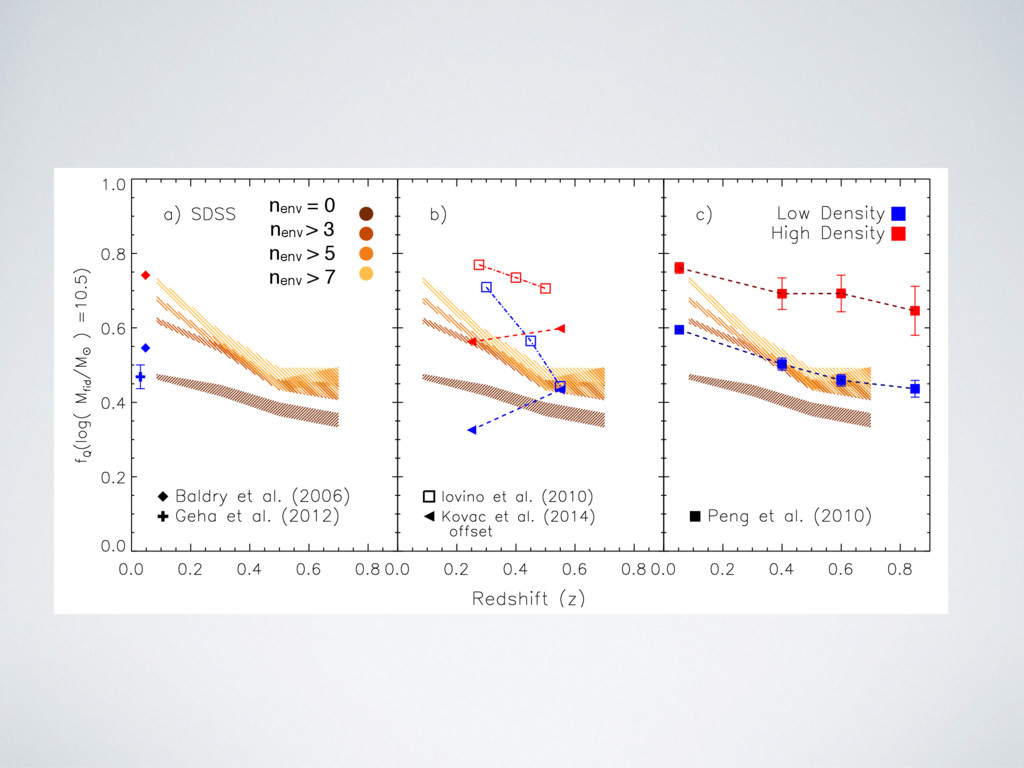
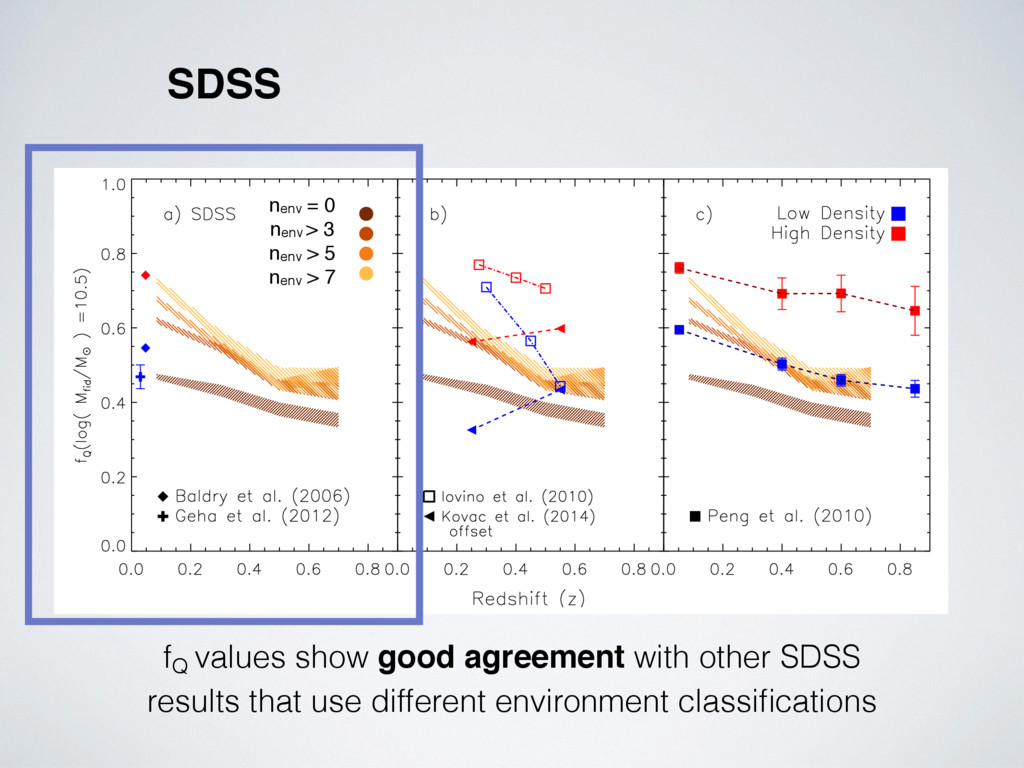
Density Environment High Density Environment fQ = Q SF + Q nenv = 0 nenv > 3 fQ( M⇤) = a log( M⇤ Mfid ) + b To better compare the fQ evolution we fit a power-law parameterization
significant fQ evolution over cosmic time. There are environment independent internal mechanisms that are responsible for ending star-formation. nenv = 0 nenv > 3
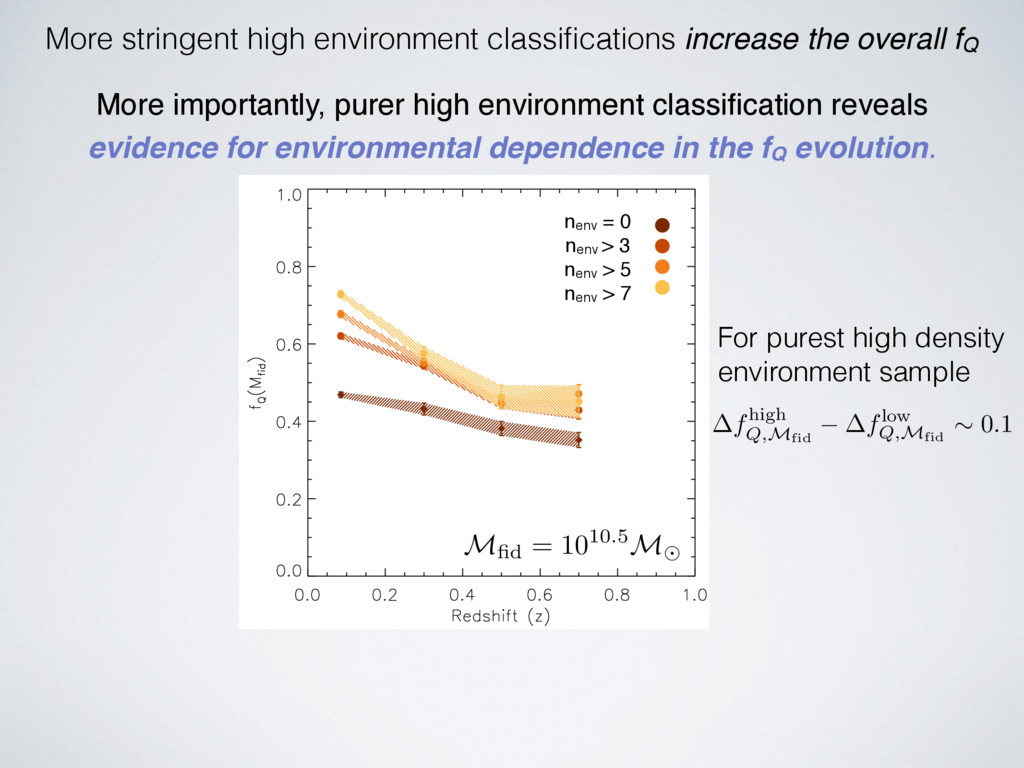
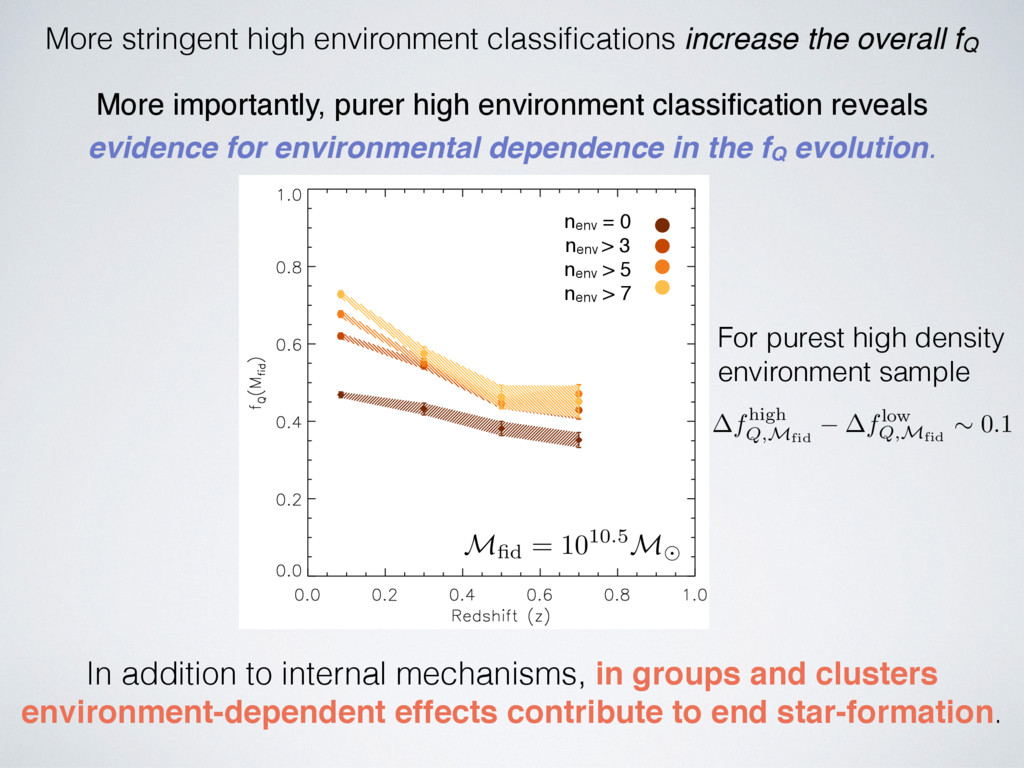
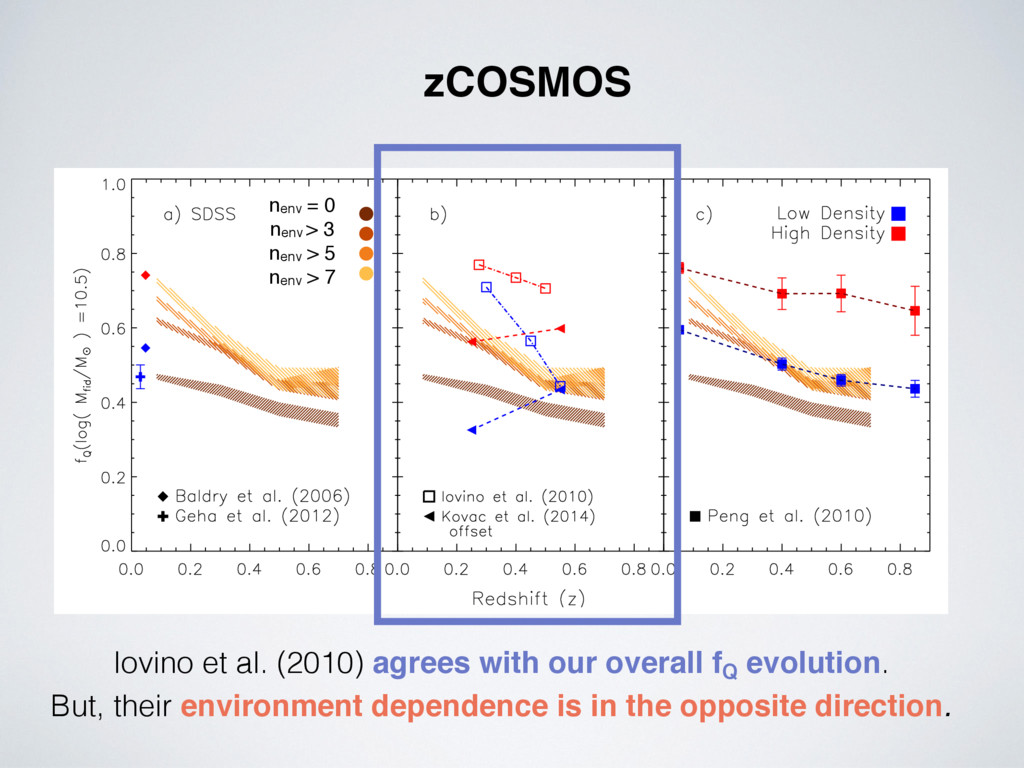
overall fQ More importantly, purer high environment classification reveals evidence for environmental dependence in the fQ evolution. In addition to internal mechanisms, in groups and clusters environment-dependent effects contribute to end star-formation. For purest high density environment sample fhigh Q,Mfid flow Q,Mfid ⇠ 0.1 nenv = 0 nenv > 3 nenv > 5 nenv > 7
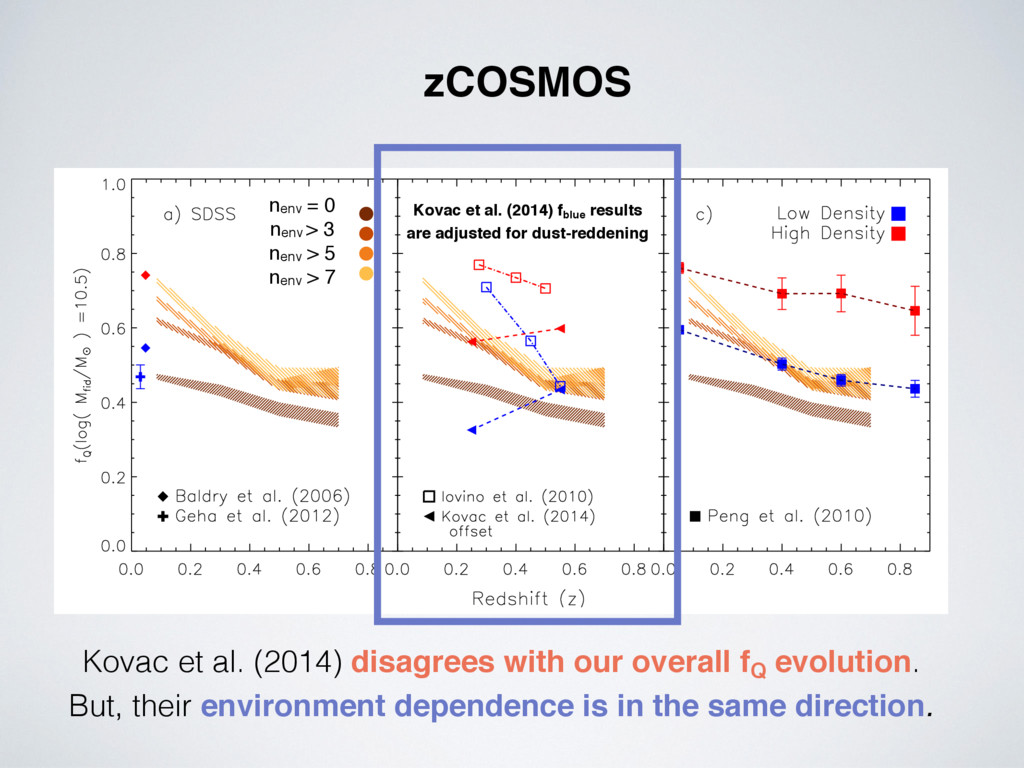
But, their environment dependence is in the same direction. Kovac et al. (2014) fblue results are adjusted for dust-reddening zCOSMOS nenv = 0 nenv > 3 nenv > 5 nenv > 7
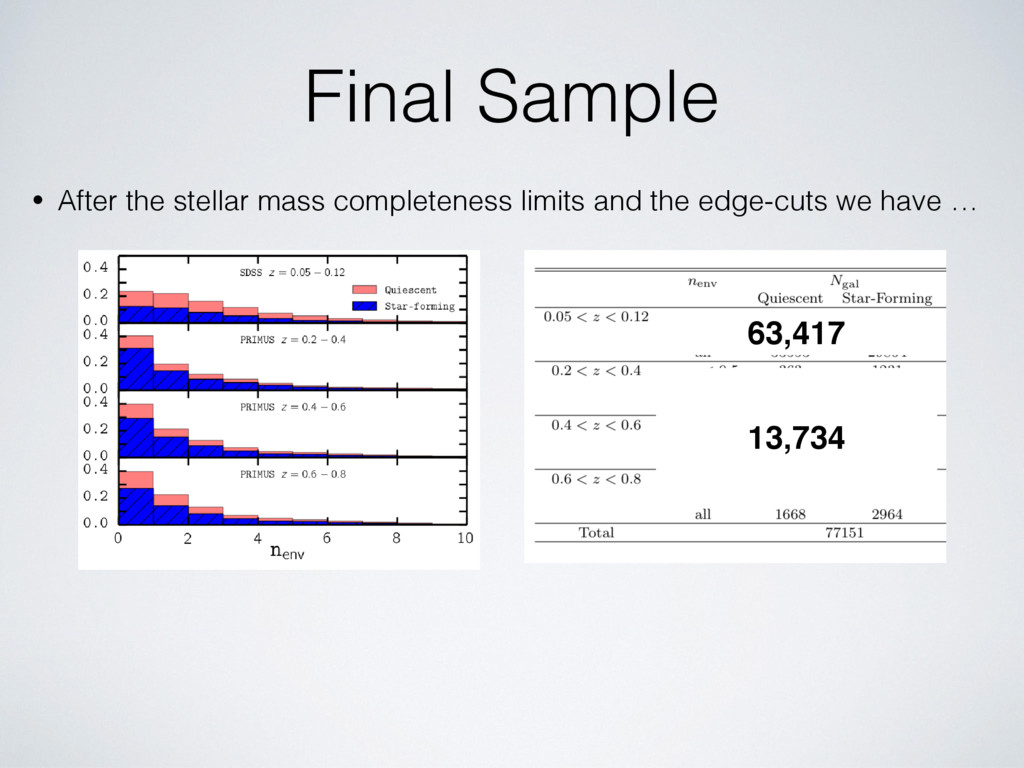
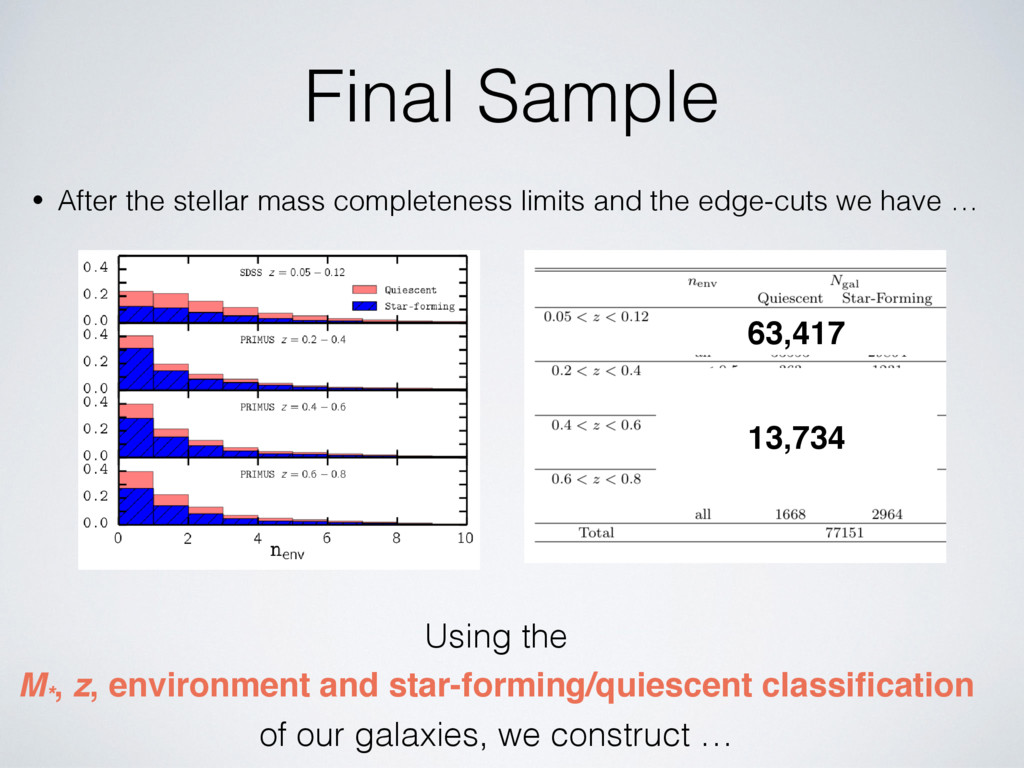
galaxies from SDSS and 13,734 galaxies PRIMUS with consistently measured galaxy environments from robust spectroscopic redshifts to calculate fQ ( Mass, Redshift, Environment ) Based on our results, • Environment-independent internal mechanisms are responsible for the cessation of star-formation. • In groups and clusters, environment dependent effects contribute to the end of star-formation. Hahn et al. (submitted) arXiv:1412.7162