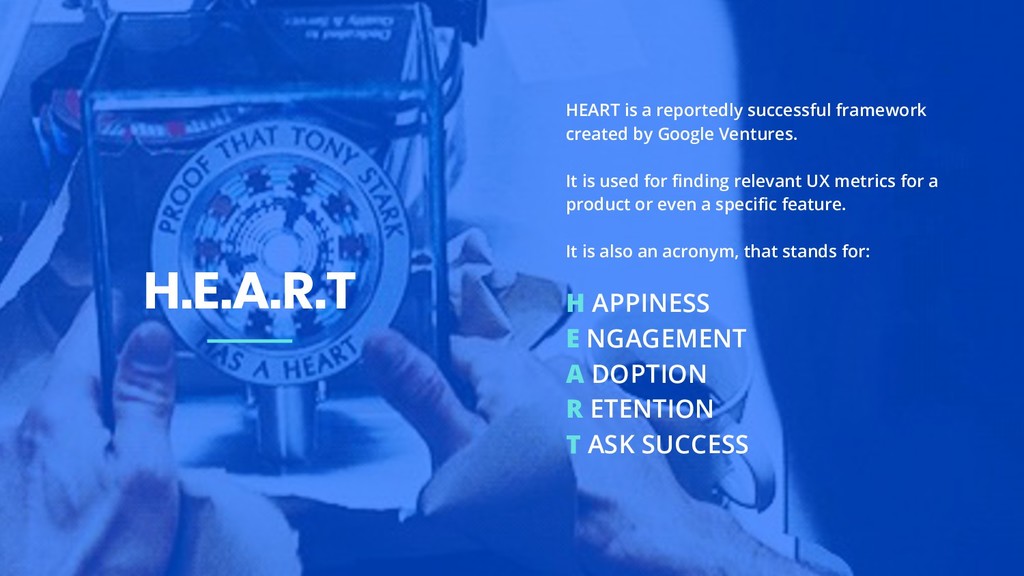
It is used for finding relevant UX metrics for a product or even a specific feature. It is also an acronym, that stands for: H APPINESS E NGAGEMENT A DOPTION R ETENTION T ASK SUCCESS H.E.A.R.T
• HEART can be applied to whole products or specific features! • HEART is better used when applied from the kickoff to the delivery date, but it can be used for monitoring project success after it is delivered. • GV authors such as Kerry Roden suggest that a team using HEART framework should only pick *ONE or TWO* categories from the five below, based on the product or feature's business goals. Good to know
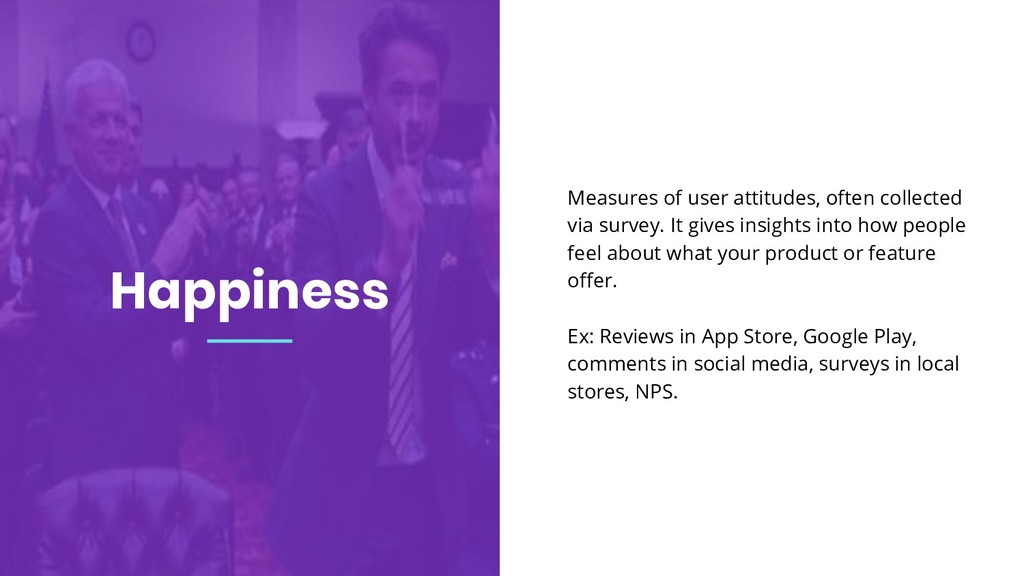
insights into how people feel about what your product or feature offer. Ex: Reviews in App Store, Google Play, comments in social media, surveys in local stores, NPS. Happiness
a user interacts with your product in a given timeframe. If he did not throw it away after obtaining it Ex: Visit per week per user ratio, number of content posted by a user, number of articles read, number of social media shares of a content or product.
gaining new users of a product or feature? Ex: Number of uploads to next version, number of new users signed up, number of purchases by new users, the conversion rate of new users. Adoption
adoption metrics, the retention metric is going to be pretty useful when coming up with a new feature or rolling out a new release. Ex: Number of active users in a period of time compared (Q2 compared to Q1), repeated purchases, churn levels in Saas. Retention
effectiveness, and error rate of a specific task. Ex: Complete profile creation, successful search results for purchases, time to upload a photo. Task Success
way to metrics is not exactly the easiest to guess. To help us figure out what metrics will be more relevant to our product/feature it is indispensable to use the Goals Signals Metrics process (a.k.a GSM). • First, you articulate your aims GOALS. • Next, you identify patterns SIGNALS which point toward success. • Finally, you build METRICS to track those patterns. Let’s take a deeper look at each of these steps in turn.
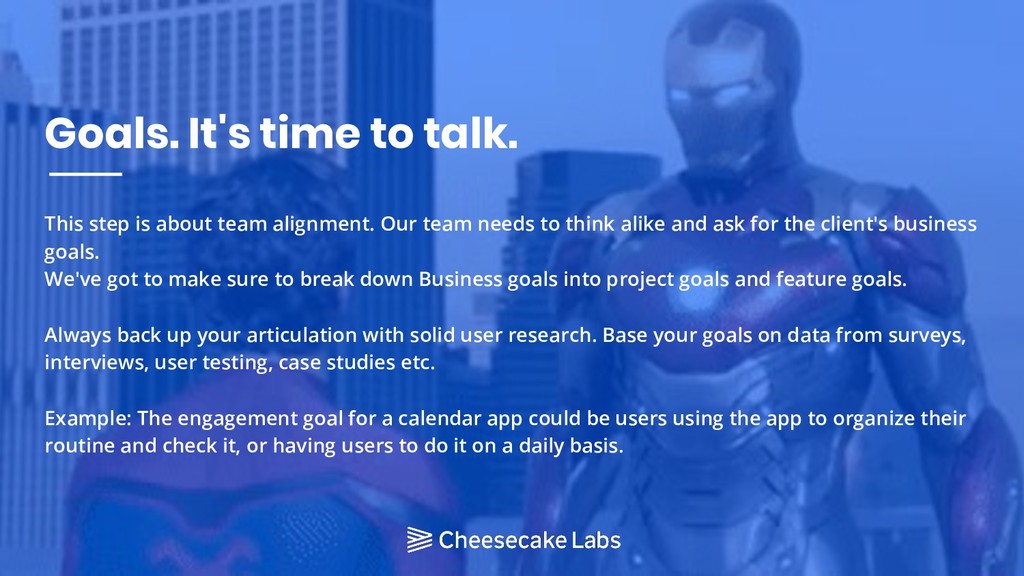
alignment. Our team needs to think alike and ask for the client's business goals. We've got to make sure to break down Business goals into project goals and feature goals. Always back up your articulation with solid user research. Base your goals on data from surveys, interviews, user testing, case studies etc. Example: The engagement goal for a calendar app could be users using the app to organize their routine and check it, or having users to do it on a daily basis.
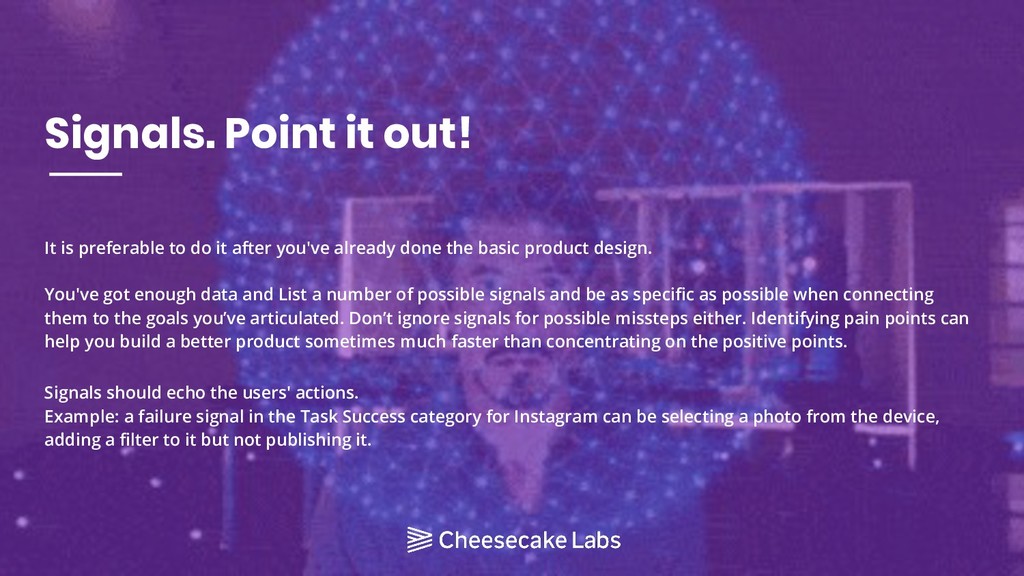
after you've already done the basic product design. You've got enough data and List a number of possible signals and be as specific as possible when connecting them to the goals you’ve articulated. Don’t ignore signals for possible missteps either. Identifying pain points can help you build a better product sometimes much faster than concentrating on the positive points. Signals should echo the users' actions. Example: a failure signal in the Task Success category for Instagram can be selecting a photo from the device, adding a filter to it but not publishing it.
use these wonderful information you've used in the design and development process to point out what'’ the most relevant information! You could use the same process for defining KPIs. You're supposed to monitor it overtime through FullStory, Google Analytics and your own backend. Try A/B Testing for better environment balance. Stay focused on the metrics that are closely related to your goals to avoid unnecessary implementation effort and dashboard clutter.
to deliver a series of user-centred metrics that allow you to measure the user experience on a large scale. These metrics can then be used for decision making in the product development process.